The Shark: Structure and Trading Rules
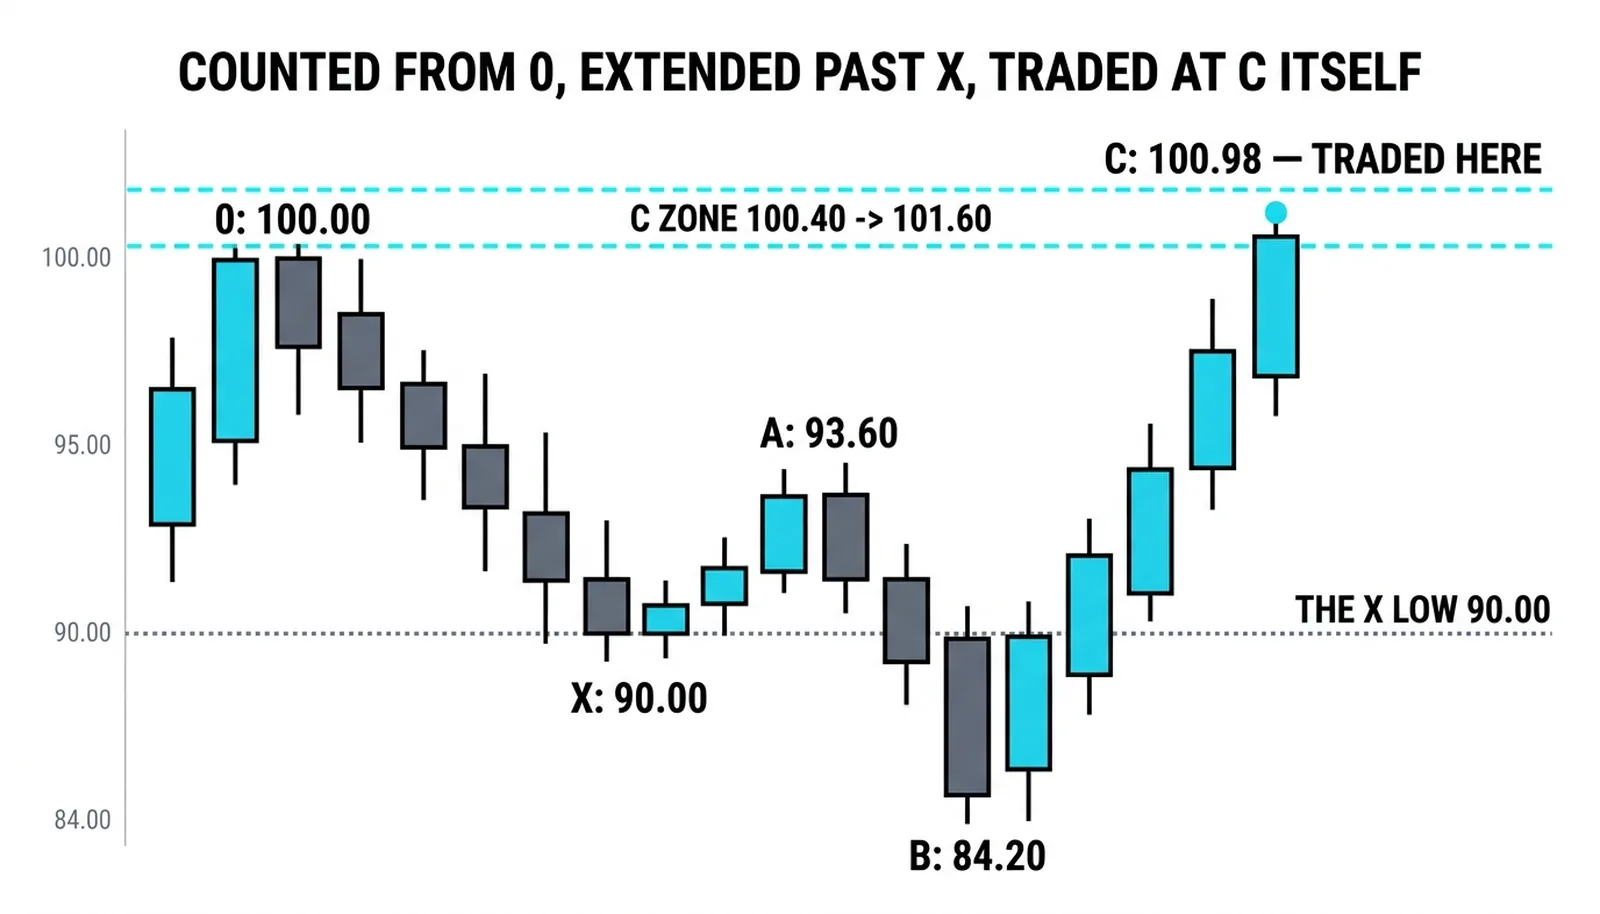
The shark pattern is the youngest and shortest harmonic structure in the set: five quick points labeled 0, X, A, B and C, where the second swing extends past the origin and the trade is taken at the final point itself, not at a zone beyond it. That last detail is the real departure. Every pattern covered so far in this block finished at D and was traded at a reversal zone past the final leg. The shark ends where it is traded. C is both the completion and the entry.

The shape is a quick draw: two hands built to mirror each other, and the whole contest decided in the single motion between draw and holster, with no second exchange. The first leg sets the range, the counter-swing overshoots the origin entirely, and the final rally snaps back to a measured projection where the reversal trade fires. Fast to form, fast to resolve, and unforgiving of hesitation.
Five Points, One Motion
The count starts at 0, not X. That alone signals the pattern is counted differently from the bat, the butterfly and the crab, and it is not a cosmetic difference. The 0 point is the true origin of the structure, and everything is measured off the leg that begins there.
The first leg runs from 0 down to X (in the bearish version; flip every direction for the bullish one). From X, price pulls back to A, and this retracement is moderate. It does not carry a tight ratio gate of its own beyond staying a reasonable partial retracement of the 0X leg. The pattern saves its strictness for later.
The first hard gate is B. Price declines again from A and must extend beyond X. That is not optional. B lands between the 1.13 and 1.618 extension of the 0X leg, measured from A. If price fails to pass X, there is no shark. The 1.13 figure is worth a second look: it is the inverse of the 88.6 percent line the bat uses, the same number seen from the other side of the ratio. Harmonic traders who learned the bat first already own this number.
The second hard gate is C, and C is where the money changes hands. From B, price rallies and completes between the 1.618 and 2.24 projection of the AB leg. The trade is taken at C itself, selling the rally (in the bearish version) against the move that just made the extreme. There is no D, no further zone, no waiting for another leg to form.
Two practical consequences follow from trading at C. First, the entry is a counter-trend entry against a strong final push, so confirmation matters: a reversal candle closing inside the projection zone is the standard trigger, not a blind limit order. Second, the stop placement is tight and mechanical, just beyond the completion zone, because the pattern offers no deeper level to hide behind. A shark that runs past its stop has simply failed.
The Youngest Pattern
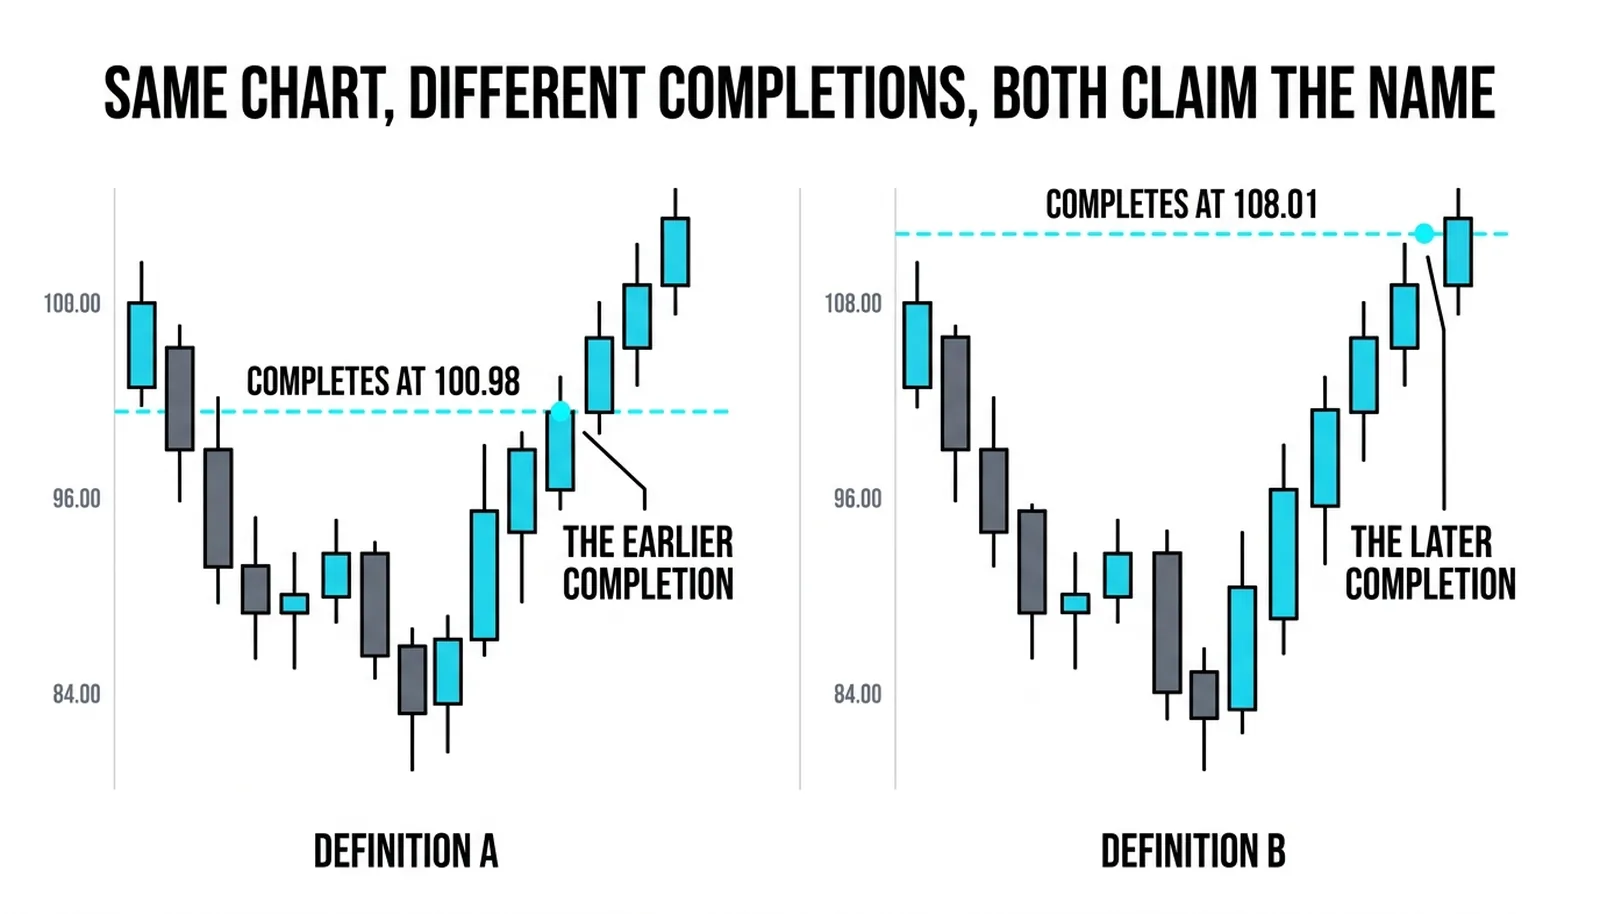
The shark comes from the later research within harmonic trading doctrine, introduced well after the older structures were established. It is the newest addition to the harmonic set, and that youth has one practical consequence that no ratio table will show: the definitions vary more between sources for this pattern than for any other in the block.
Two competent traders, each working from a reputable source, can draw different sharks on the same chart. One source quotes a narrower B extension, another accepts a wider band. One requires the 1.13 specifically, another treats anything past X as qualifying. The completion projections get the same treatment. This is not sloppiness on anyone's part. The pattern simply has not had decades of shared convention to settle its edges the way the older structures have.
The trade-off is honest and worth stating plainly. The shark completes quickly and often offers an unusually wide reward relative to its tight stop, because the entry sits at an extreme with a hard invalidation level close by. In exchange, the trader accepts the widest interpretation risk in the block. The zone is wider, the agreement is lower, and the person across the trade may be working from a different definition entirely.
The shark is also frequently treated as the first half of the related 5-0 structure. In that reading, the C point of the shark becomes the launch point of the next measurement, and the reversal off C is traded again in the opposite direction once a new set of ratios confirms. Traders who use the 5-0 treat the shark as the setup and the 5-0 as the follow-through. Traders who do not can ignore the linkage entirely and trade the shark on its own terms.
Skepticism is healthy here. A young pattern with loose definitions will produce more cherry-picked examples in books and forums than a settled one. The defense is the same as everywhere else in this course: fixed ratios chosen in advance, a fixed stop, and a written record of which definition the trader is actually using.
The Turn at 100.98
A worked example, with round invented numbers, bearish version. The chart prints 0 at 100.00 and declines to X at 90.00, a ten-point first leg. The pullback rallies to A at 94.00, a moderate retracement, nothing extreme.
From A, price declines again and pushes past X. B prints at 82.70. Check the gate: the 0X leg is ten points, and the 1.13 extension measured from A at 94.00 lands at 94.00 minus 11.30, which is 82.70. B sits exactly on the minimum extension, inside the 1.13 to 1.618 band. The structure is alive.
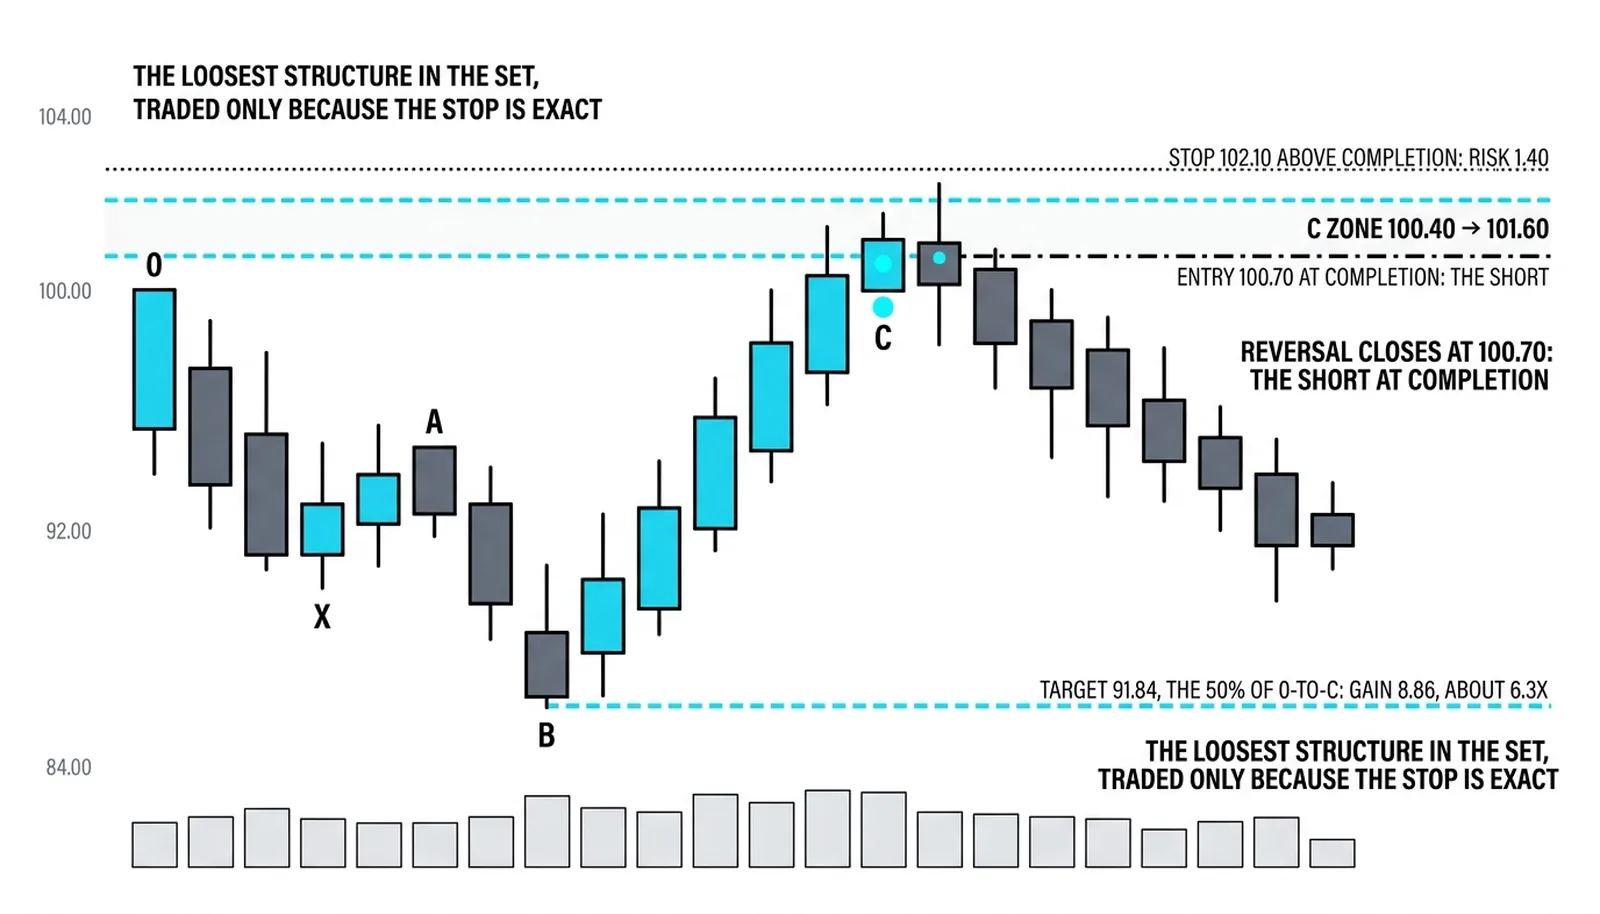
From B, price rallies. The AB leg runs from 94.00 down to 82.70, a length of 11.30. The 1.618 projection of that leg, added back from B, lands at 82.70 plus 18.28, which is 100.98. C prints at 100.98, inside the 1.618 to 2.24 window. A reversal candle forms and closes at 100.70.
The short is taken at 100.70. The stop sits at 102.10, just beyond the completion zone, risking 1.40 per unit. The first target is the 50 percent retracement of the B-to-C leg: that leg spans 82.70 to 100.98, and its midpoint is 91.84. The gain to target is 8.86 against a risk of 1.40, roughly 6.3 times the risk.
Now the failed version, stated plainly. Price does not reverse. The rally continues through the completion zone and trades above 102.10. The stop fires, the loss is 1.40, and the pattern is dead. No re-entry on hope, no widening the stop because the ratios "almost" held.
The deeper honesty sits underneath the stop. Another trader, working from a different source's definition, would have drawn the completion a full point lower and never taken this trade at all. Both traders followed the rules as their sources state them. The pattern's short life as a standard is part of its price, and the stop rule is what makes a loose structure tradeable at all. The ratios locate the trade; the stop is what allows the trader to survive the disagreement.
| Point | Leg It Ends | Ratio That Defines It | Example Price |
|---|---|---|---|
| 0 | Origin of the structure | Starting point, no ratio | 100.00 |
| X | First leg (0 to X) | Reference swing for extensions | 90.00 |
| A | Pullback (X to A) | Moderate retracement of 0X | 94.00 |
| B | Second decline (A to B) | 1.13 to 1.618 extension of 0X, beyond X | 82.70 |
| C | Final rally (B to C) | 1.618 to 2.24 projection of AB; trade taken here | 100.98 |
Shark Questions, Answered
What is the shark pattern?
The shark is a five-point harmonic structure labeled 0, X, A, B and C, where the second swing extends beyond the origin and the trade is taken at the final point, C. It is the youngest pattern in the harmonic set, drawn from the later work of harmonic trading doctrine, and it is traded as a reversal at the completion of the C projection rather than at a zone beyond it.
How is the shark different from other harmonics?
The shark is counted from 0 instead of X and is traded at its final labeled point instead of at a D point beyond it. Its B point must extend past the origin of the structure, landing between the 1.13 and 1.618 extension of the first leg, which is a stricter overshoot requirement than the older patterns carry. The count, the overshoot and the entry location are the three differences that matter.
What is the 5-0 pattern?
The 5-0 is a related structure that treats the shark's C point as the launch of a new measurement. After the shark completes and reverses, the 5-0 waits for a fresh set of legs and ratios to form off that reversal, then trades the continuation. Traders who use it treat the shark as the first half of a larger sequence; the shark stands alone perfectly well for those who do not.
Why do shark definitions vary?
The definitions vary because the pattern is the newest in the set and has had the least time to settle into shared convention. Different sources quote different B extensions and different completion windows, so two traders can draw different sharks on the same chart while each following a legitimate source. The practical answer is to fix one definition in writing, pair it with a hard stop, and never improvise the ratios mid-trade.
Next in the block, the 5-0 takes the reversal this pattern creates and builds a second trade on top of it, which is where the shark's speed starts paying twice.