Why Fibonacci Works in the Markets
The ratio tradition works in the markets for two reasons, one mathematical and one human. The mathematics is real: the sequence and its ratios describe genuine proportions that exist whether or not anyone trades them. The human reason does the heavier lifting: because a critical mass of traders watches the same levels computed the same way, those levels become zones where decisions cluster, and clustered decisions move prices. Neither reason alone would be enough. Together they explain why a number sequence from the thirteenth century shows up on every modern charting platform.

Think of a standing ovation: the first few people rise on their own judgment, the rest rise because the first ones did, and soon the whole house is up and staying seated feels stranger than standing. Fibonacci levels behave the same way. A few traders act at a level because the proportion is real, more act because the first group acted, and eventually the level holds because everyone expected it to hold. The previous two lessons built the sequence itself and explained the golden ratio and its derived family. This one closes the foundation by answering the question a skeptic should ask before drawing a single line: why does any of this belong on a chart at all?
Three Layers of the Claim
The honest answer comes in three layers, and they are not equally strong. Separating them keeps you from believing more than the evidence supports.
Layer one: the mathematics is real. The sequence is genuine arithmetic. Each number is the sum of the two before it, the ratio between consecutive numbers converges on 1.618, and the derived family, 0.618, 0.382, 0.236, follows by simple division. The cluster method builds an entire methodology on these ratios computed exactly this way, and no part of the trading application needs to fake the math. If someone tells you the numbers themselves are mystical or invented, they are wrong. The arithmetic checks out every time.
Layer two: the proportion claim. In trending markets, counter-moves often stall near proportional fractions of the prior leg. A rally of ten points pulls back three point eight, or six point two, before continuing. This is an empirical observation, not a law, but it has been observed often enough across enough markets that dismissing it entirely is its own kind of dogma. The fraction family traders agreed to watch is 23.6, 38.2, 61.8, and 78.6 percent. Notice the wording: agreed to watch. The set is a convention, and conventions only matter because people honor them.
Layer three: the consensus mechanism. This is the layer that does the actual work, and the next section gives it the space it deserves. The short version: the tools ship on every platform, the computation is standardized, and enough participants placing orders at the same prices makes those prices matter.
One wrinkle belongs here because honesty demands it. The famous 50 percent retracement is not a Fibonacci ratio at all. It comes from Dow Theory and the older observation that markets often retrace half a move. Traders use it so heavily alongside the true ratios that it earned honorary membership in the family. A later lesson owns up to this in detail. For now, file it under a useful rule: the trading community adopts levels because they work often enough, not because they descend from a single pure source.
The Self-Fulfilling Machine
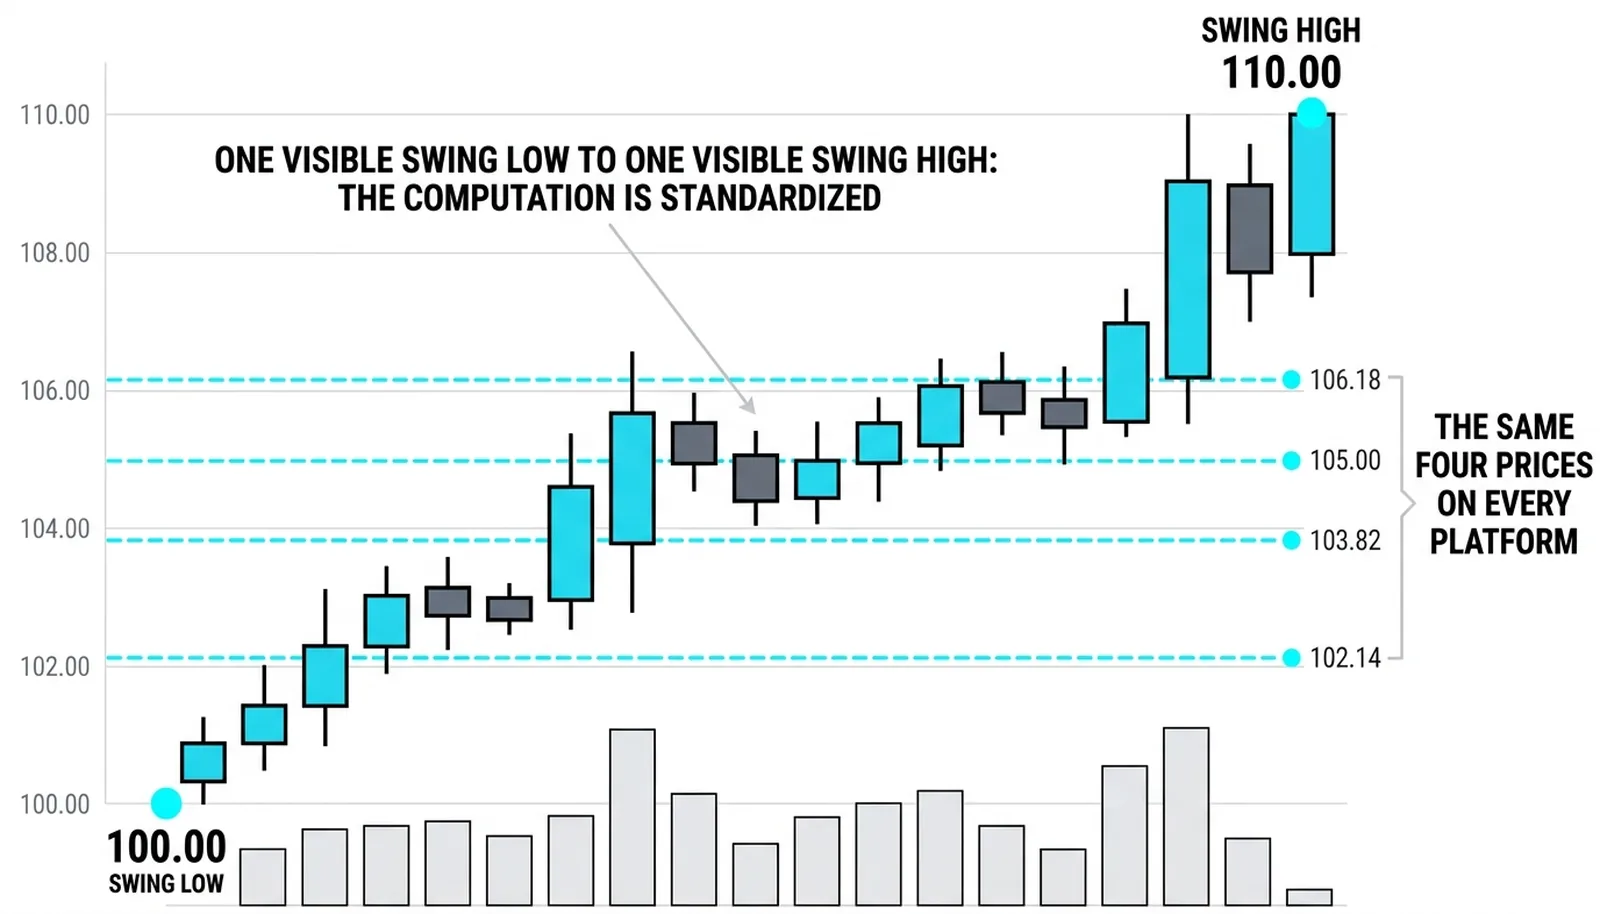
Standardization does the work. Every charting platform computes Fibonacci retracements the same way: pick a swing low, pick a swing high, the platform divides the vertical distance by the same ratios and draws the same horizontal lines. Two traders on opposite sides of the world, looking at the same obvious swing, see levels at identical prices to the penny. No interpretation, no settings to argue about, no version drift.
That uniformity is rarer than it sounds. Most tools allow endless parameter fiddling, which fragments attention across a hundred variants of the same idea. Fibonacci retracement resists that. The swing points involve some judgment, but once a major swing is obvious to everyone, the levels are fixed. Attention converges instead of scattering.
Converged attention becomes clustered orders. Limit buy orders stack near the 38.2 and 61.8 levels. Stops hide just beyond them. Profit targets sit at the extensions. When price reaches a level, it meets a wall of pre-committed decisions, and that wall is what produces the bounce, the pause, or the rejection. The level holds because the orders are there, and the orders are there because the level was expected to hold. The circle is complete and completely human.
This is what the respect described in the previous level's lessons really is. Nobody respects the number 1.618. They respect the fact that thousands of other participants are watching the same line and will act on it. The level is a coordination point, like a meeting time everyone agreed on without ever speaking. Show up at the agreed hour and the room is full. Show up at a random hour and it is empty.
What the Levels Do Not Do
Nothing pulls price toward 1.618. There is no force, no gravity, no physics. The claim was never about nature commanding markets; it is about the clustering of human decisions at agreed prices. Any trader who talks about the golden ratio as a law markets must obey has confused the map's popularity with the territory's obedience.
The levels also guarantee nothing. A 61.8 percent retracement is a zone where a reaction is more likely than at a random price, not a price where a reaction is owed to you. Plenty of trends slice straight through three levels without pausing. The tool shifts probability slightly in your favor at specific locations. The promise is that modest, and it is enough to build a trade around, provided risk is defined before entry.
Failure, handled correctly, is information. When a level the whole room was watching breaks, the break says more about control than ten levels that held quietly. A 61.8 percent retracement that fails in public tells you the sellers overwhelmed a wall of pre-committed buyers, which means the sellers are stronger than the consensus assumed. That is a genuine signal about who is winning, delivered at a known price with a known invalidation. Quiet levels that hold confirm the trend. Loud levels that break warn you the trend's foundation is weaker than the crowd believed.
The practical posture follows: watch reactions instead of believing in numbers. The level proposes, price disposes. Your job at a Fibonacci zone is to observe how price behaves there, not to assert how it must behave. Traders who worship the levels get run over by the failures. Traders who treat the levels as questions get answers they can trade.
The Pullback to 103.60
Here is a worked example with round numbers, entirely hypothetical. A market swings from a low of 100.00 to a high of 110.00, a clean 10.00-point leg. Applying the standard retracement family to that leg produces four watched levels: 106.18, 105.00, 103.82, and 102.14.
| Level | Fraction of the leg | Price | Expected behavior |
|---|---|---|---|
| Shallow retracement | 38.2% | 106.18 | Strong trends may turn here with little warning |
| Halfway mark | 50.0% | 105.00 | Honorary level, heavy order clustering |
| Golden retracement | 61.8% | 103.82 | The most watched zone, deepest healthy pullback |
| Deep retracement | 78.6% | 102.14 | Last stand before the swing low is threatened |
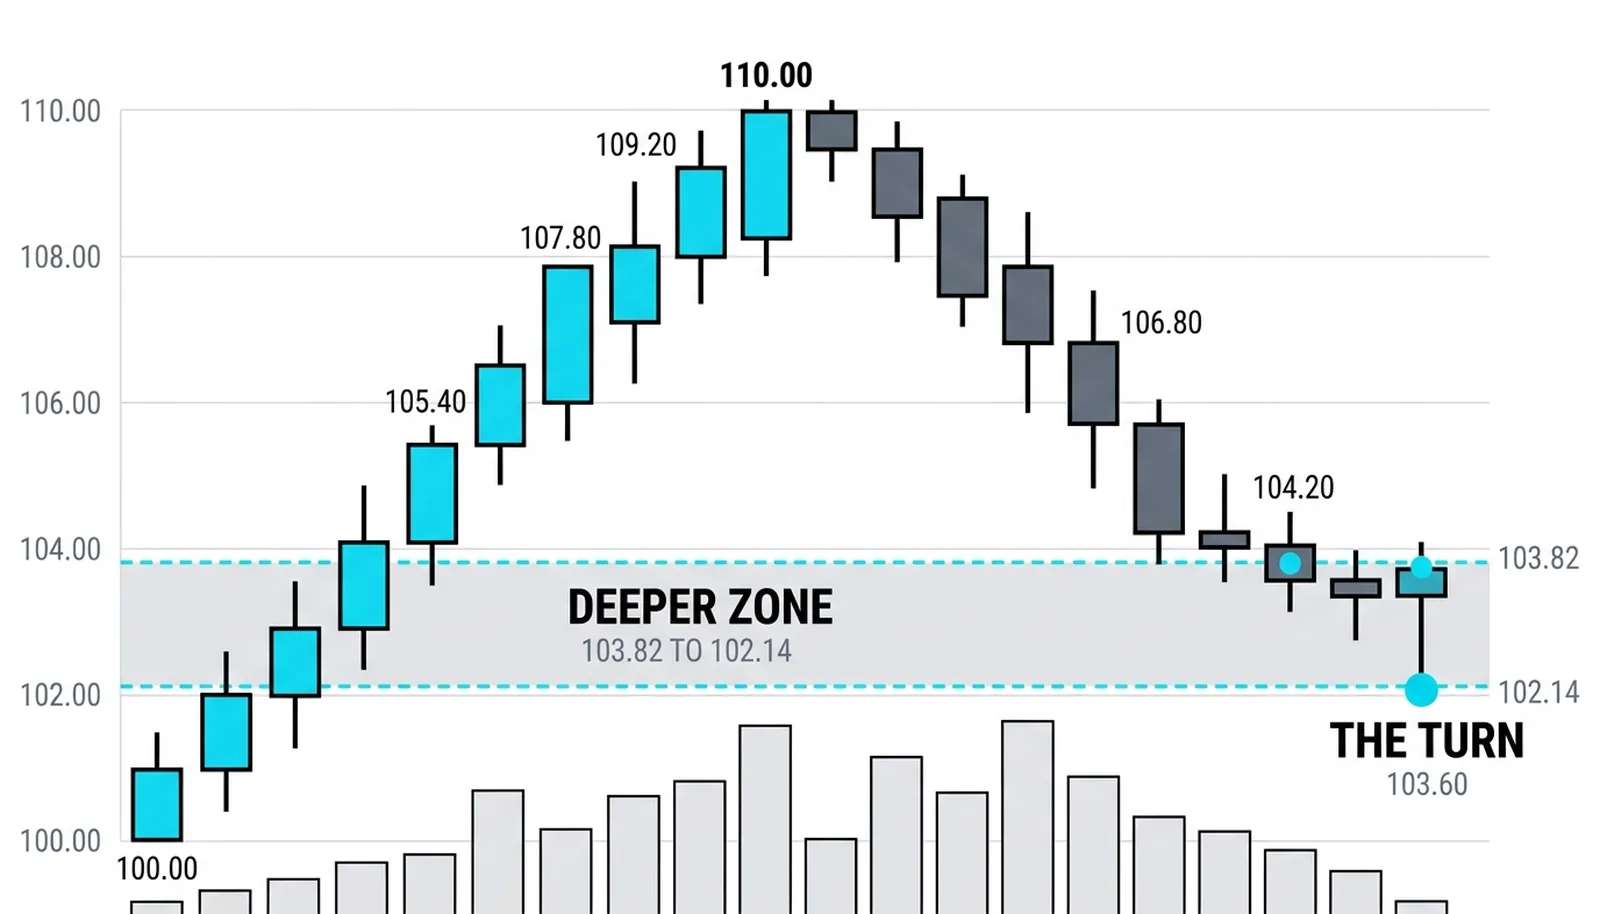
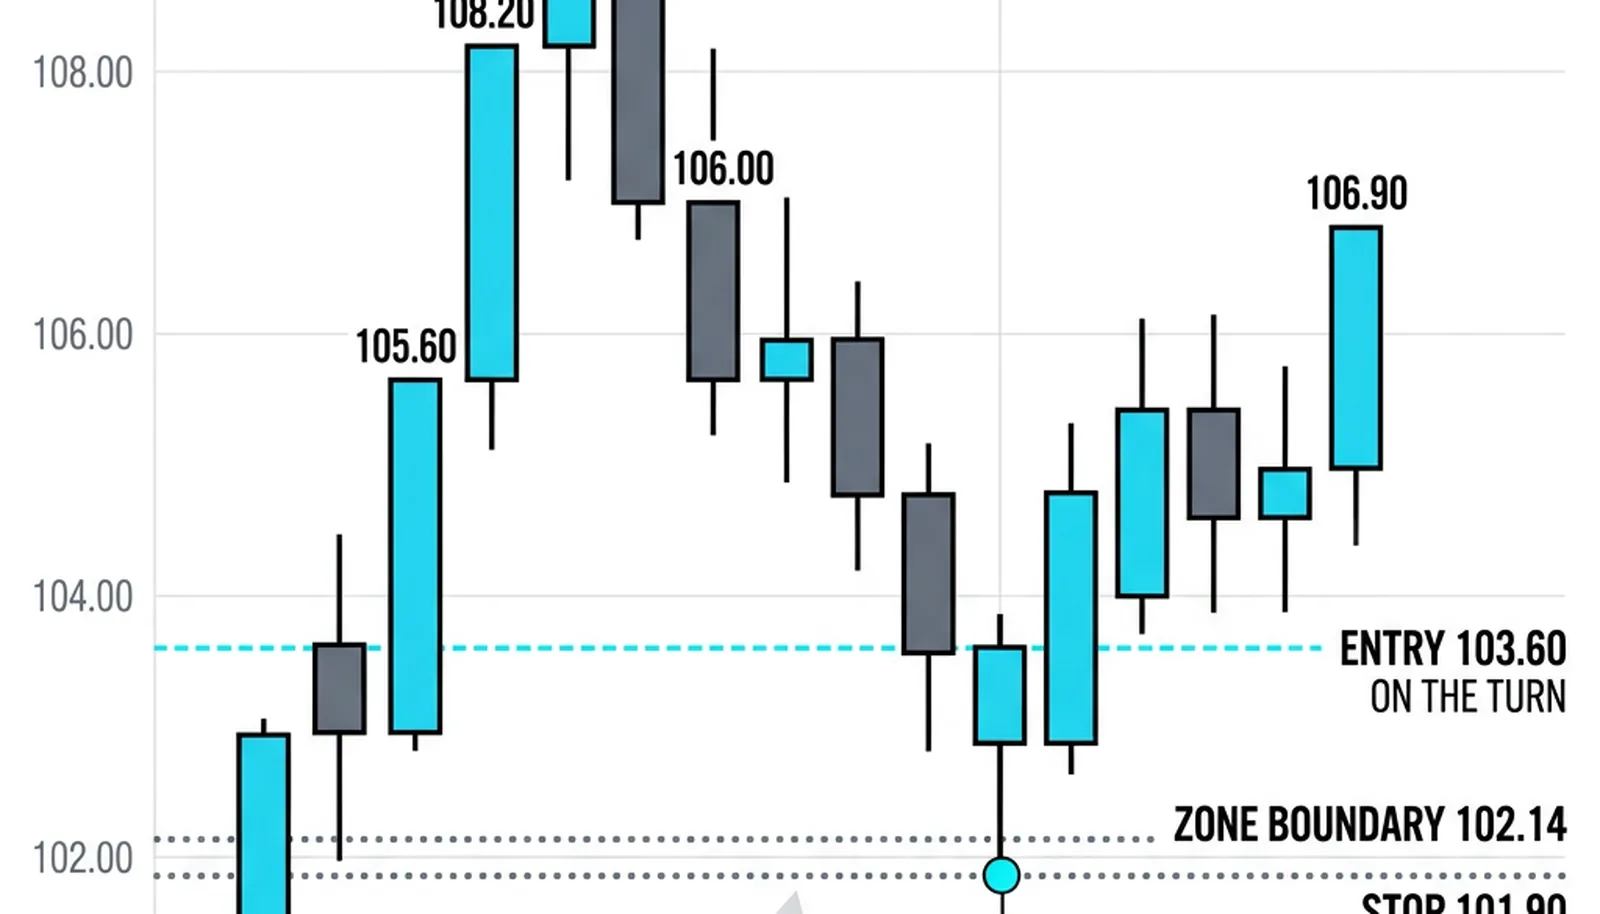
Price pulls back from 110.00. It passes through 106.18 without pausing, drifts through 105.00, and reaches 103.60, inside the deeper zone near the 61.8 percent level. There it holds. Selling dries up, a candle turns, and the trader takes the long entry at 103.60 on that turn.
The stop goes below the zone's deeper boundary at 101.90, risking 1.70 per unit. The target is the prior high at 110.00, a potential gain of 6.40. That is roughly 3.8 times the risk, which is what a well-located entry buys you: the level supplied the location, and the location supplied the asymmetry.
Now the failed version, because it will happen to you. Price reaches the zone, hesitates, then closes at 101.60, below the 78.6 percent boundary. The bounce idea is dead. No re-entry logic, no averaging down, no hoping. The next honest reference is the swing low itself at 100.00, and the trade that mattered was the exit, not the entry. The zone supplied location, never certainty, and the discipline that makes the whole toolset safe is the one the previous level taught: watch the close, respect the invalidation, and let the level be a hypothesis the market grades.
Fibonacci in Markets Questions, Answered
Why does Fibonacci work in trading?
It works for two compounding reasons: the ratios describe genuine mathematical proportions, and enough traders watch the same standardized levels that orders cluster there and make the zones temporarily self-fulfilling. The math alone would not move prices, and the crowd alone would have nothing to coordinate on. Together they create zones where reactions are more likely than at random prices.
Is Fibonacci self-fulfilling?
Largely, yes, and that is not an insult. The levels hold because participants expect them to hold and place orders accordingly, which is the same mechanism behind most support and resistance. A self-fulfilling level backed by millions in clustered orders is more useful than a "real" level nobody watches.
Do professional traders use Fibonacci?
Many do, usually as one input among several rather than a standalone system. Professionals value the levels because they are standardized and widely watched, which makes them useful for locating entries, stops, and targets where other participants are also making decisions.
What happens when a Fibonacci level fails?
The failure itself becomes information: a level the whole market watched that breaks in public signals the expected buyers or sellers were overwhelmed, which says something real about who controls the tape. The correct response is to exit at the predefined invalidation and look to the next reference, not to defend the level.
The foundation is now complete: the sequence, the ratio, and the honest reasons any of it belongs on a chart. The next lesson puts the tool in your hands, starting with how to pick the swing points that make every level you draw worth watching.