The Golden Ratio: Why Markets Respect It
The golden ratio is the number 1.618, and markets respect it for one honest reason: it is the fixed proportion the Fibonacci quotients settle on, and a very large crowd of traders watches the levels derived from it, which is enough to make price behave differently there. Nothing about the number pulls price toward it. The respect comes from attention, and attention comes from the fact that every charting platform ships the tools and every trader running them computes the same levels from the same visible swings.

The same proportion repeats far from charts, showing up in shells and seed heads at every scale, which is exactly where the cluster method says to study the ratio before trusting it on price. The previous lesson built the Fibonacci series and watched the quotients converge. This lesson is about the number they converge on, what that number inherits from geometry, and what it hands to the chart.
The Only Number That Equals Its Own Reciprocal Plus One
Start with the identity that makes 1.618 unusual. It is the only positive number that equals its own reciprocal plus one. Take 1.618, flip it, and you get roughly 0.618. Add one and you are back at 1.618. Add one to 0.618 and you also land on 1.618. The number contains itself at every step, a self-similarity no other number has.
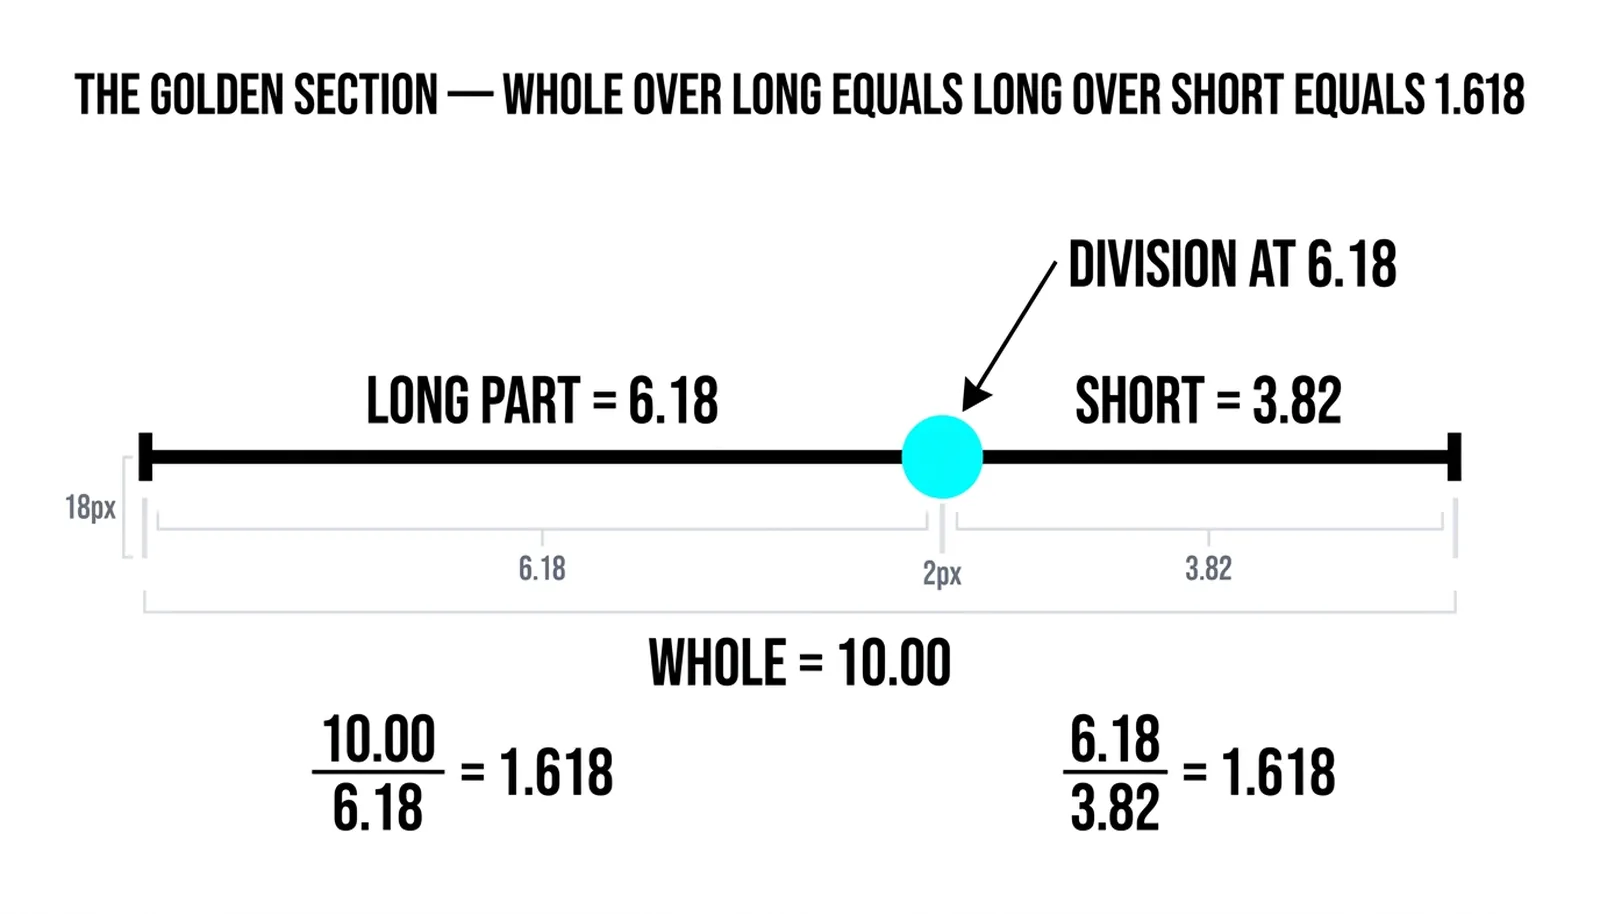
Geometry gives the same proportion a physical form. Take a line and divide it so the whole relates to the long part as the long part relates to the short part. Whole over long equals long over short, and both equal 1.618. That cut is the golden section, and it has been known since antiquity.
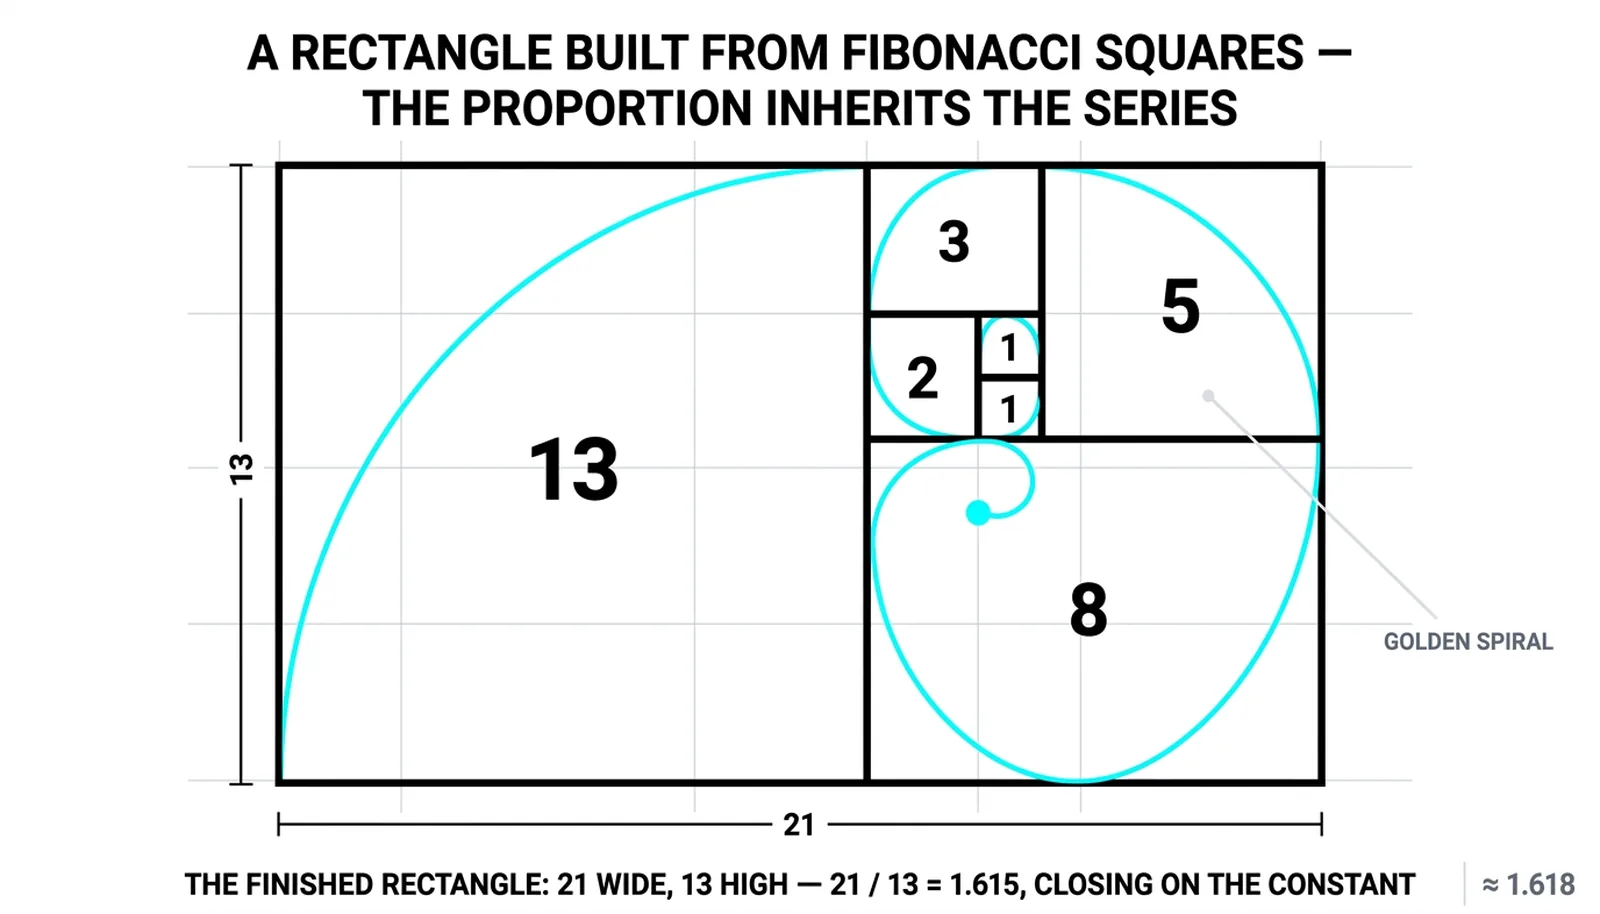
Build a rectangle on that division, with sides in the ratio 1 to 1.618, and you get the golden rectangle. Architects and designers have used this proportion for centuries because it looks right to the human eye. Remove a square from a golden rectangle and the piece left over is another golden rectangle, smaller but identical in proportion. The shape reproduces itself endlessly, which is the same self-similarity the arithmetic showed.
This matters for trading only as background. The chart tools do not draw rectangles. But understanding that the ratio is a fixed mathematical relationship, not an arbitrary guess, explains why the levels derived from it are so stable across every platform and every market.
From Geometry to Nature to a Price Chart
The cluster method lists where the ratio turns up outside of mathematics: the arrangement of petals on flowers, ammonite fossils, even the proportions of the pentagram. The pattern recurs in structures that grow by adding to themselves, which is what the Fibonacci series models.
The trading tools work with a family of numbers derived from the ratio, not the bare 1.618 itself. The family comes from simple operations:
- 0.618, the inverse of 1.618, the most-watched retracement of all.
- 0.382, the square of 0.618, the shallow retracement of strong trends.
- 0.236, the cube of 0.618, a very shallow level used in fast moves.
- 0.786, close to the square root of 0.618, the deep retracement before a move is considered broken.
Each member of the family inherits the same self-similar property. Multiply 0.618 by itself and you get 0.382. Multiply again and you get 0.236. The family is one number wearing different sizes.
Here is how the family becomes chart levels. A trader marks a visible swing, a low and a high. The platform measures the distance between them and draws horizontal lines at 38.2, 50, 61.8, and 78.6 percent of that distance. The 50 percent line is not a Fibonacci number at all, but it rides along because traders have always watched half-moves. Every other line is the ratio family applied to one leg of price.
The result is a set of prices that any trader anywhere can reproduce exactly. Same swing, same math, same levels. That reproducibility is the entire mechanism of what comes next.
Why Markets Respect It, Honestly
Nothing physical enforces these levels. No ratio has ever forced a bounce. Price is not a nautilus shell, and a market does not know it is supposed to stop at 61.8 percent of anything.
What does happen is this. The platforms ship the tools by default. Millions of traders measure the same obvious swings. They compute the same levels, place orders near them, set alerts at them, and watch them. When price reaches 103.82 on a well-watched swing, buy orders fire, shorts cover, and hesitation appears, because a critical mass of participants decided in advance to act there. The level becomes temporarily real through clustered behavior.
The respect is a consensus made of chart settings rather than decree. That is the honest framing, and it has two consequences.
First, the respect is conditional. It holds while the crowd keeps watching and while the underlying control of the trend stays unchanged. When a real shift in supply and demand arrives, price cuts through a Fibonacci level as if it were not there, because it was never a wall, only a gathering place.
Second, the trader's job is observation, not belief. The levels are decision zones where reactions are more likely than at random prices. Mark them before price arrives. Then watch what price actually does there. A level that produces a strong rejection tells you the crowd defended it. A level that price slices through tells you the crowd's opinion did not matter this time. Both readings are information.
Treat the levels as a map of where decisions cluster, never as a promise of what the decision will be.
One Line Divided at 61.8
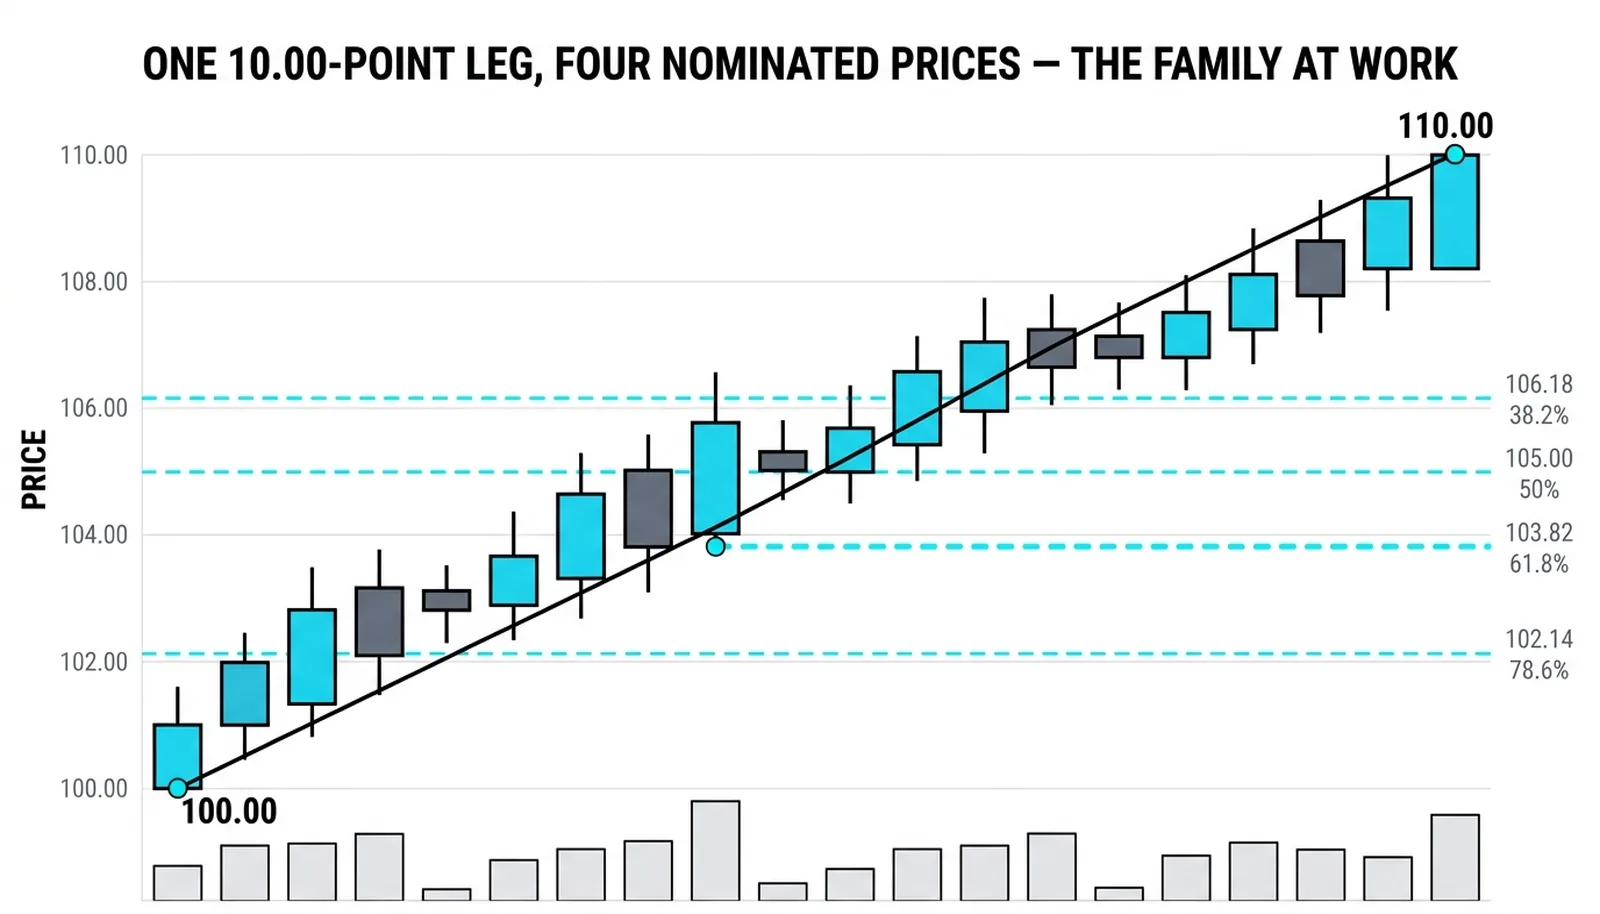
A hypothetical illustration with round numbers. A swing runs 10.00 points, from a low of 100.00 up to a high of 110.00. Apply the golden-section logic back down from the high.
61.8 percent of the 10.00-point leg is 6.18. Subtract from the high and the level sits at 103.82. That single price is the golden ratio's nomination on this swing: the point where the pullback has retraced the proportion the whole family is built on.
The rest of the family fills in around it. 38.2 percent of the leg is 3.82, placing the shallow level at 106.18. The half, not a Fibonacci number but always drawn, sits at 105.00. 78.6 percent of the leg is 7.86, putting the deep level at 102.14.
| The ratio | The math on the leg | The price | What it nominates |
|---|---|---|---|
| 0.382 | 10.00 x 0.382 = 3.82, off the high | 106.18 | Shallow pullback, trend still strong |
| 0.500 | 10.00 x 0.500 = 5.00, off the high | 105.00 | The halfway mark, watched by convention |
| 0.618 | 10.00 x 0.618 = 6.18, off the high | 103.82 | The golden-section retracement |
| 0.786 | 10.00 x 0.786 = 7.86, off the high | 102.14 | Deep pullback, last defense of the swing |
These are the prices the ratio family nominates on one ordinary swing, before any tool is drawn on any screen. Every trader who measures this same 100.00 to 110.00 leg computes the same four numbers. That shared arithmetic is why 103.82 can attract a reaction, and why the reaction, when it comes, is a crowd event rather than a mathematical law.
Golden Ratio Questions, Answered
What is the golden ratio?
The golden ratio is the number 1.618, the fixed value the Fibonacci quotients converge on as the series grows. It is the only positive number equal to its own reciprocal plus one, and geometrically it is the proportion of the golden section, where the whole relates to the long part as the long part relates to the short part.
Why do traders use the golden ratio?
Traders use it because the levels derived from it are reproducible by everyone. Any trader measuring the same swing computes the same 38.2, 61.8, and 78.6 percent prices, so those prices become shared reference points where orders and attention cluster.
Is the golden ratio proven to work in markets?
No, and no honest practitioner claims otherwise. The number itself exerts no force on price. What works, conditionally, is the crowd behavior around the levels, and that behavior holds only while enough participants keep watching and the underlying trend stays intact.
What do 0.618 and 1.618 mean?
They are two faces of the same proportion. 0.618 is the inverse of 1.618, and adding one to 0.618 returns 1.618. On charts, 0.618 and its relatives mark retracements inside a swing, while 1.618 and its relatives project extensions beyond it.
Next, the toolkit gets practical: how retracements are drawn, how extensions project targets, and how confluence turns several overlapping levels into one zone worth trading.