Swing Highs and Lows: Mark Them Precisely
Marking swing highs and swing lows precisely is a rule set, not an eye test. Once the rules are fixed, the same chart produces the same labels for every trader who applies them. That repeatability is the point of this lesson. A swing high is a turning point where buyers stopped being able to push price higher, and a swing low is the mirror image where sellers ran out. The previous lesson built the framework and used these labels freely; this one delivers the precise marking rules behind every one of those labels.

Think of a machinist's caliper, read to the thousandth of an inch, because a part that is almost the right size does not fit. A swing point that is almost in the right place does the same damage to a structure read. Sloppy labels produce sloppy invalidation levels, and sloppy invalidation levels produce trades that were never really tested. Precision here is cheap. It costs a few definitions and the discipline to keep them.
The Five Rules
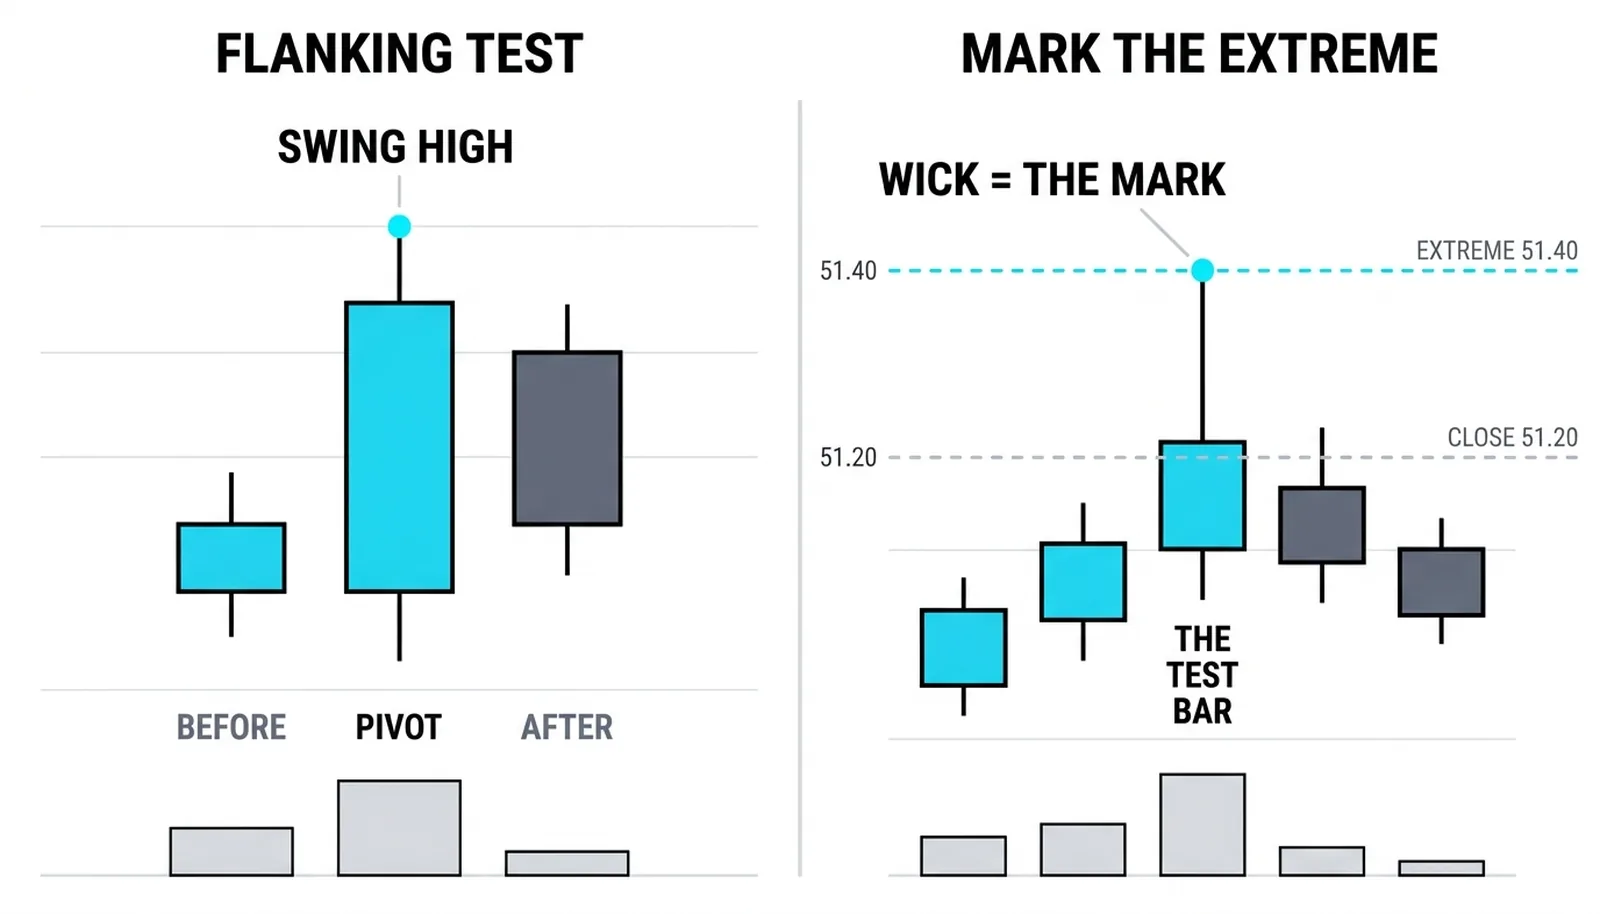
Rule one: the flanking test. The price action framework defines a pivot high as a bar whose high is higher than the bar before it and the bar after it, and a pivot low as the same pattern inverted. That is the minimum window: one bar on each side. The window can be widened. Some traders demand two or more lower highs on each side before they will label a swing. Widening the window filters out noise and catches only meaningful turns, but it adds lag, because the label cannot be confirmed until the flanking bars have printed. That trade-off, precision against lag, is a choice the trader makes once and keeps.
Rule two: mark the extreme. The swing high is the highest price touched, the wick tip, not the close. The wick is where buyers actually failed. A bar that closed at 51.20 but wicked to 51.40 told the market something at 51.40, and that price is the one future sellers will remember. The same holds for lows: the swing low is the lowest print, the bottom of the wick, where sellers actually failed.
Rule three: consistency. Pick a flanking window and a wick convention once, then keep them. A label that changes with the trader's mood changes nothing at all. The whole value of a marked chart is that the marks mean the same thing on Tuesday as they did on Monday.
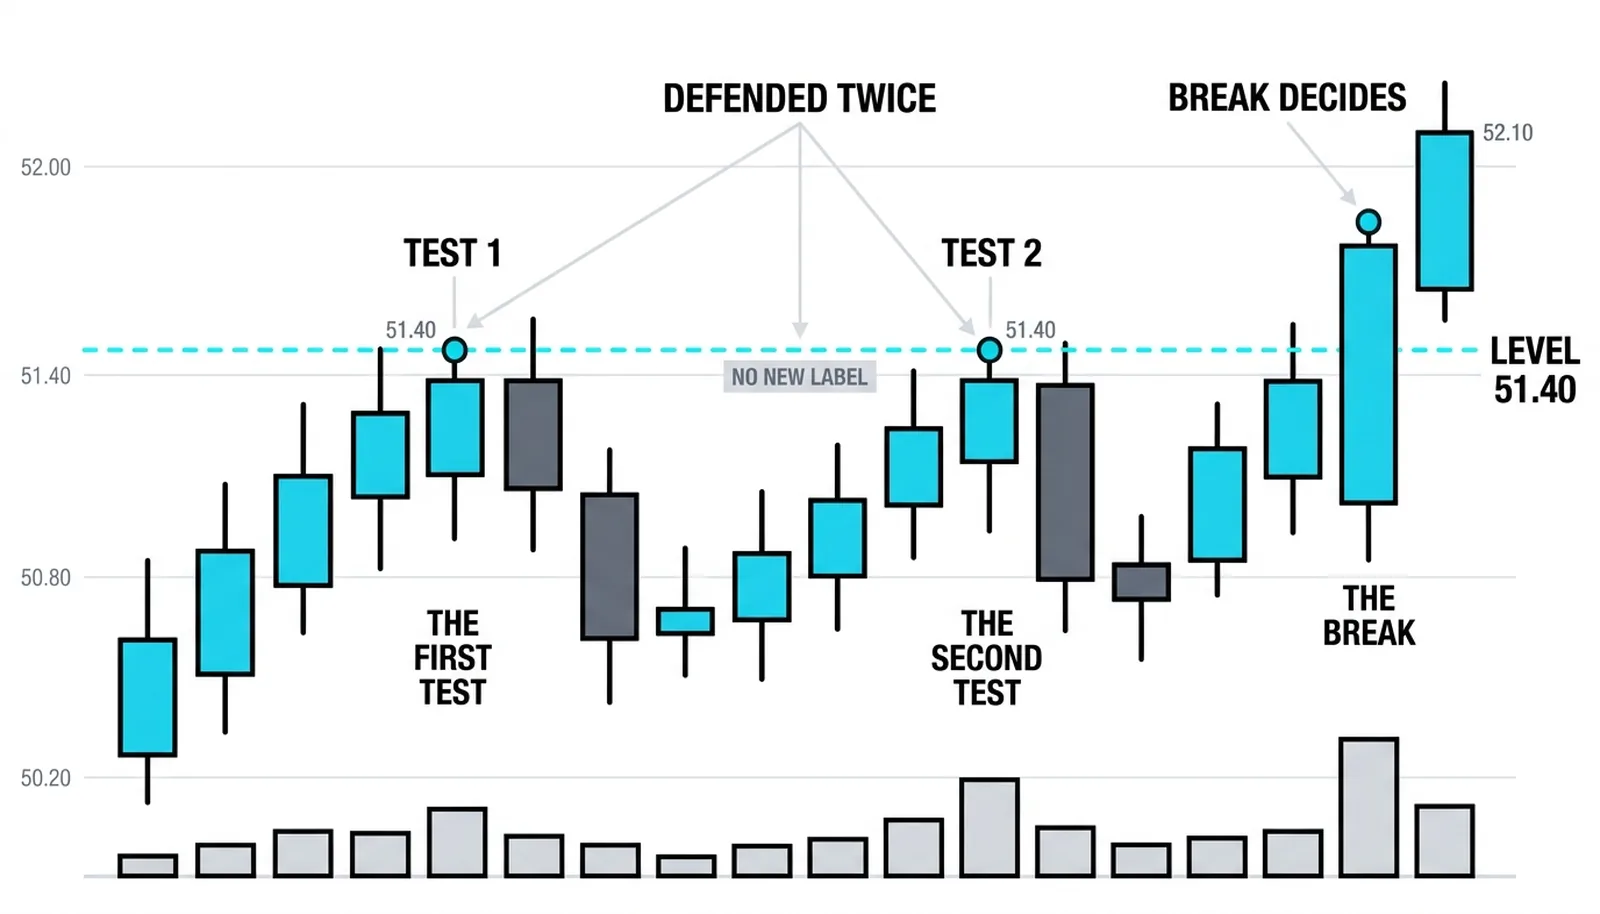
Rule four: equal highs and equal lows. When two swings print at the same price, do not declare one the winner. Mark the level. The market is saying that price matters, and the break of that level, in either direction, is the event that matters. This is the same kind of break the earlier structure lessons already trade. Equal highs are not a labeling problem. They are information.
Rule five: recency. For breaks and warnings, only the most recent unbroken swing point counts for the break. Older labels are history, not defense. A swing high from three weeks ago that price has already traded through is an annotation, not a live level. The tape-reading framework describes the bar-by-bar version of this discipline through the pullback count, where each lower low inside an upswing is a candidate turn that the rules must sort, keeping only the swings that survive the flanking test.
The Decisions Hiding Inside the Rules
Every rule above hides a decision, and hiding decisions is where marking systems quietly fall apart. Bring them into the open.
How wide a flanking window? A one-bar window marks everything, including turns that lasted an hour and meant nothing. A three-bar window marks only turns the market defended for several bars, but the trader learns about them late. Neither is wrong. The mistake is switching between them mid-chart, because then the labels stop being comparable to each other.
Wick or close? This lesson's convention is the wick, because the extreme is where the failure happened. Some traders mark closes instead, arguing that closes are where the auction settled. Both conventions work. What does not work is marking the wick on the swings that help the current bias and the close on the ones that hurt it.
The lag-versus-precision trade. Every confirmation bar added to the window makes the label more reliable and less timely. A swing high confirmed by three lower highs on each side is a sturdy label, but by the time it exists, price may already be halfway through the move the trader wanted to catch. There is no setting that removes this cost. There is only a setting the trader has chosen, written down, and accepted.
Why equal highs refuse a label. Calling a winner on two identical prices invents information the market never gave. Two touches at 51.40 say the level is defended. They do not say the trend is up or down. The honest mark is the level itself, and the honest trade waits for the break to pick the direction.
What the Marking Feeds
The labels are the inputs to every structural decision that follows.
The most recent marked swing low is the uptrend's invalidation. That is the price where the long is wrong, not approximately wrong. If the trend is a sequence of higher highs and higher lows, the last higher low is the load-bearing member, and a break of it ends the pattern the trade was built on.
The most recent marked swing high is the level whose break the trend's proof requires. An uptrend that cannot take out its last swing high has stopped doing the one thing that defines it. Until that break prints, the trend is unproven, however good it feels.
Stops belong beyond the marked extreme with a small buffer, never at the exact tick. The market loves to test the obvious price by a few ticks, because that is where the cluster of orders sits. A stop placed exactly at the swing low is a stop placed at the most visited price on the chart. A buffer of a few ticks past the extreme keeps the trade alive through the test and still exits if the level genuinely fails.
The honesty, stated plainly: these conventions genuinely differ between traders and platforms. An automated zigzag study and a hand-marked chart can disagree at the margins without either being wrong. The labels are a convention faithfully applied, not a fact discovered in the data. The value lies in the consistency, because a framework that shifts its definitions can never be tested, only believed.
Ten Bars, Five Decisions
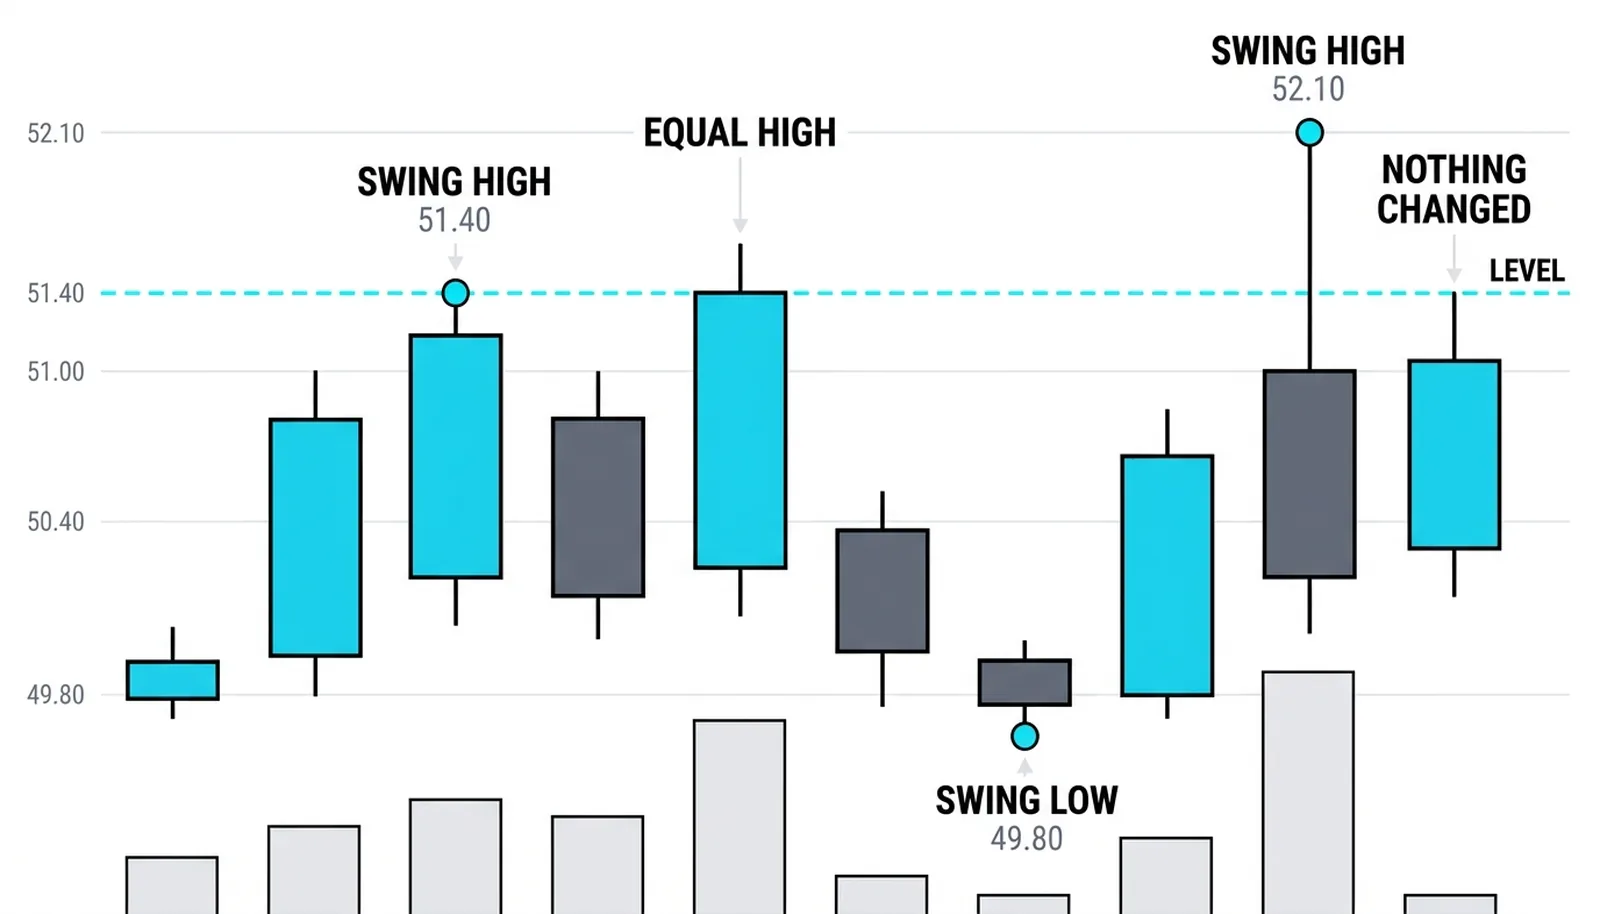
A hypothetical daily sequence, ten bars, round numbers. The daily highs run: 50.20, 50.80, 51.40, 50.90, 51.40, 50.30, 49.80, 50.60, 52.10, 51.70. The convention is a one-bar flanking window and wick extremes.
Bar three prints 51.40, flanked by 50.80 before and 50.90 after. The flanking test passes. Swing high, marked at 51.40.
Bar five prints 51.40 again. Rule four applies: this is the equal-high case. No new label, no forced ranking. The level at 51.40 is marked as defended twice, and the market is told to prove itself with a break.
Bar seven's low at 49.80 sits between a higher low before it and a higher low after it. The inverted flanking test passes. Swing low, marked at 49.80.
Bar nine prints 52.10, taking out the 51.40 level, with a lower high on each side. Swing high, marked at the wick tip of 52.10 even though the body closed lower, because the extreme is where buyers failed.
Bar ten prints 51.70 and changes nothing. It is neither a new extreme nor a break. The sequence stands intact.
| Point | Price | Rule Applied | Label |
|---|---|---|---|
| Bar 3 | 51.40 | Flanking test, one bar each side | Swing high |
| Bar 5 | 51.40 | Equal highs, mark the level | Level, no new label |
| Bar 7 | 49.80 | Flanking test, inverted | Swing low |
| Bar 9 | 52.10 | Flanking test, wick extreme | Swing high |
The read: the most recent unbroken swing high is 52.10, and the most recent swing low is 49.80. A close above 52.10 is the trend's next proof. A close below 49.80 is the uptrend's invalidation. Everything between those two marks is waiting.
Swing Marking Questions, Answered
How do you mark swing highs and lows?
Apply the flanking test: a swing high is a bar whose high exceeds the highs of a fixed number of bars on each side, and a swing low is the same pattern inverted. Mark the extreme price, the wick tip, and keep the window and the convention identical across every chart.
How many bars must flank a swing high?
One bar on each side is the minimum definition, and two or three is a common choice for filtering noise. More flanking bars mean sturdier labels and later confirmation. Pick the number once, write it down, and never change it mid-chart.
Do you mark the wick or the close?
Mark the wick. The extreme is where buyers or sellers actually failed, and that is the price the market will retest. Marking closes is a workable alternative convention, but mixing the two on one chart destroys the consistency the labels exist to provide.
What do you do with equal highs?
Mark the level and refuse the ranking. Two swings at the same price mean that price is defended, and the break of the level in either direction is the event worth trading. Forcing a higher-or-lower call on identical prices invents information the chart never gave.
With the marking rules fixed, the next lesson puts them to work on the frame itself: separating internal structure from external structure, so the small swings inside a move stop impersonating the move itself.