Why Combining Analysis Types Works
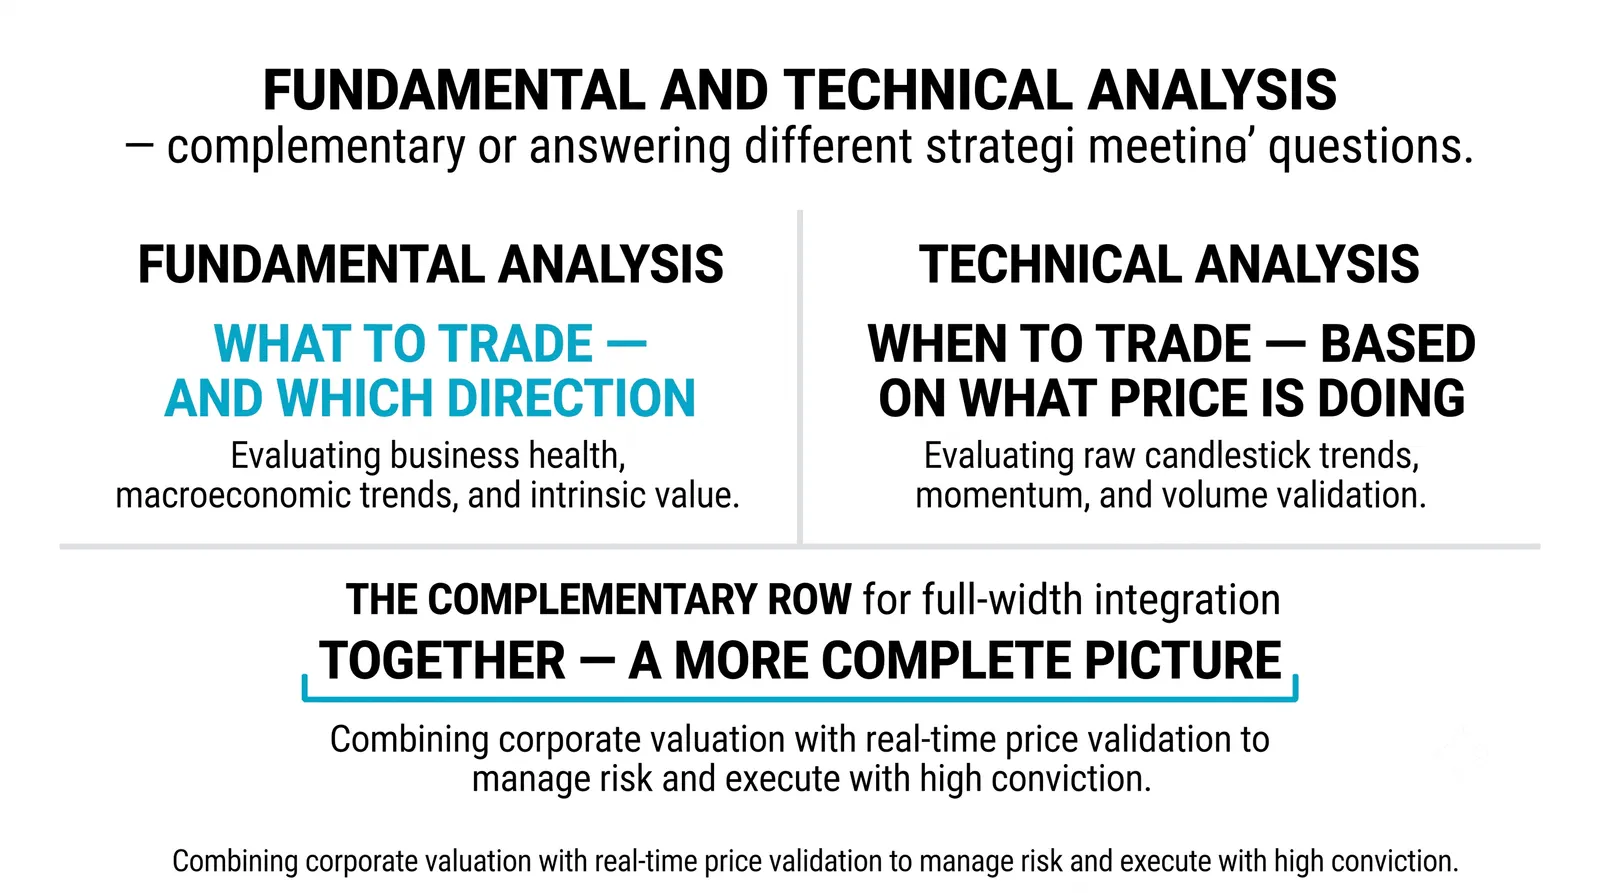
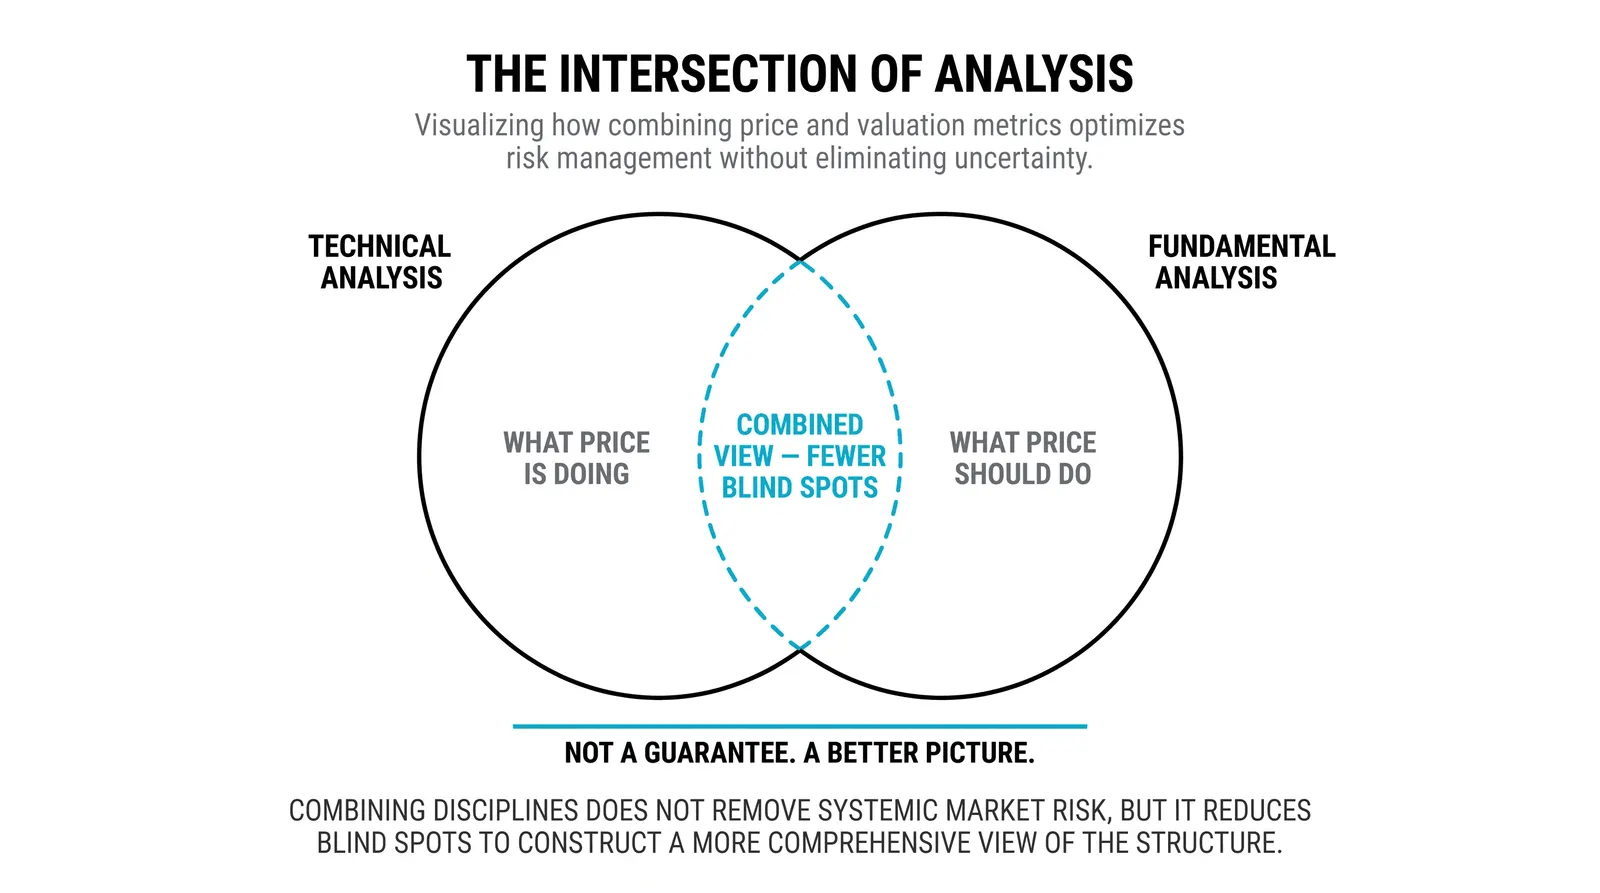
Combining analysis means using two or more independent methods before you commit money, and the reason is simple: every single method has a blind spot, and a second method closes part of that gap. When two unrelated approaches point the same way, a large share of your bad trades never happens. You trade less often, but the trades you take have better reasons behind them.

Think of it like a pilot's pre-flight check. The engine gauges look fine and the weather looks fine, and the flight happens only when both agree, because either one alone can be wrong. Price charts are one gauge. Fundamentals are the other.
What Technical Analysis Alone Misses
A chart shows you what price has done. It does not tell you why, and it does not tell you whether the price is fair.
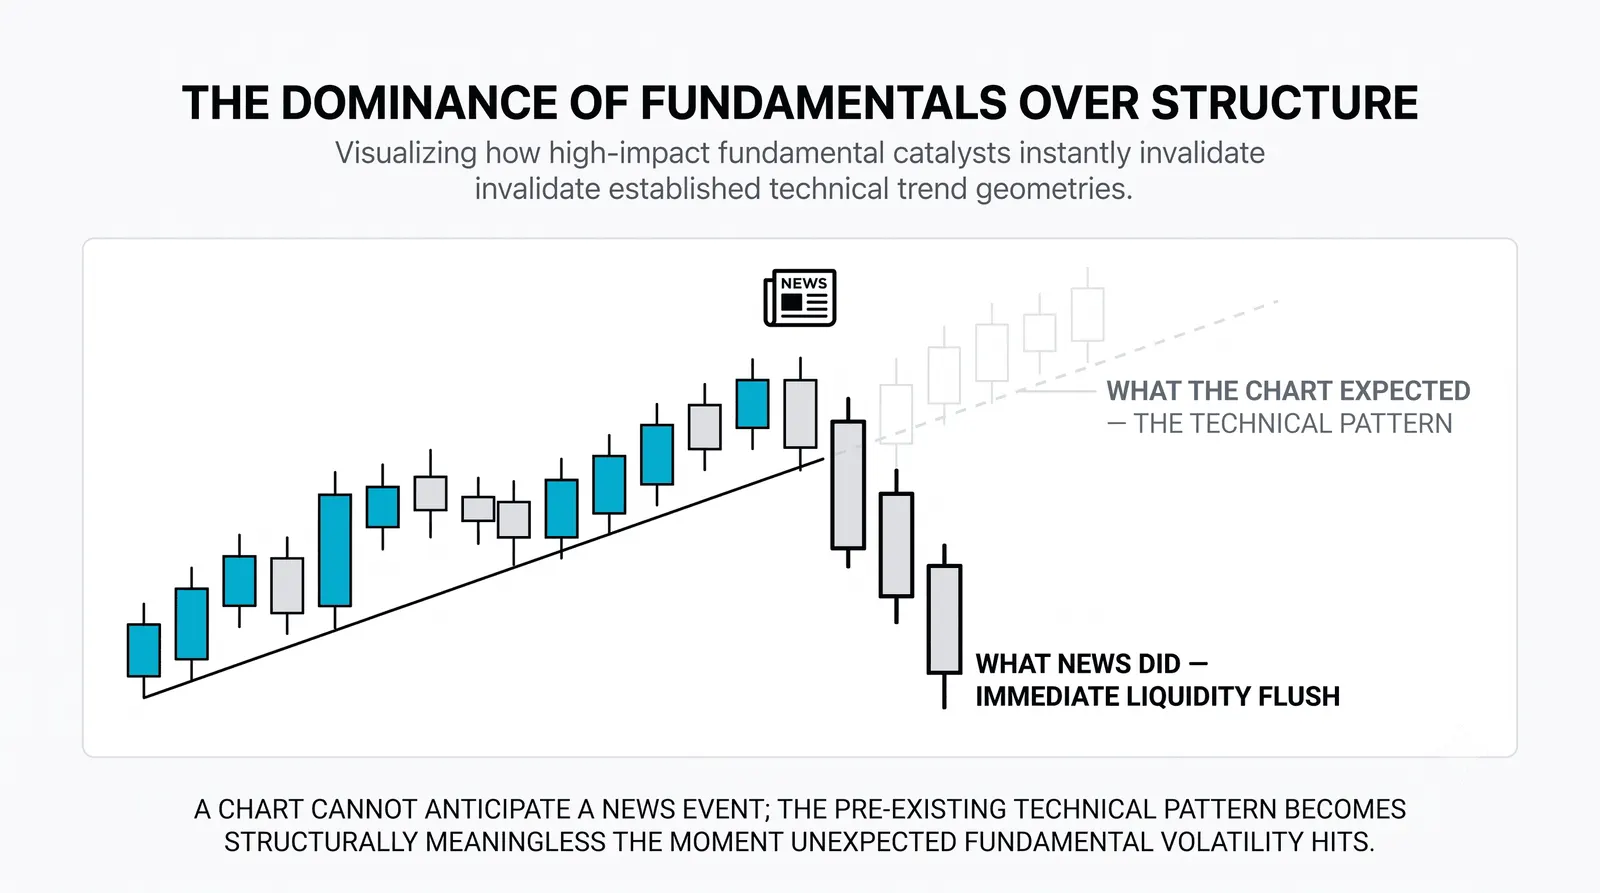
A stock can trend up beautifully while the business underneath it shrinks. The chart will not warn you. It only reports what buyers and sellers have done so far, and crowds can be wrong for a long time.
Technical traders handle this with stops and discipline, and that works. But it means accepting that some of your cleanest setups are built on nothing. You are trading the pattern, not the asset.
The blind spot in one line: a chart can tell you when, but never whether the price makes sense. The method itself is laid out in what technical analysis is.
What Fundamental Analysis Alone Misses
Fundamental analysis answers the question charts cannot: what is this thing actually worth? Earnings, debt, cash flow, competitive position. Done well, it gives you a rough fair value.
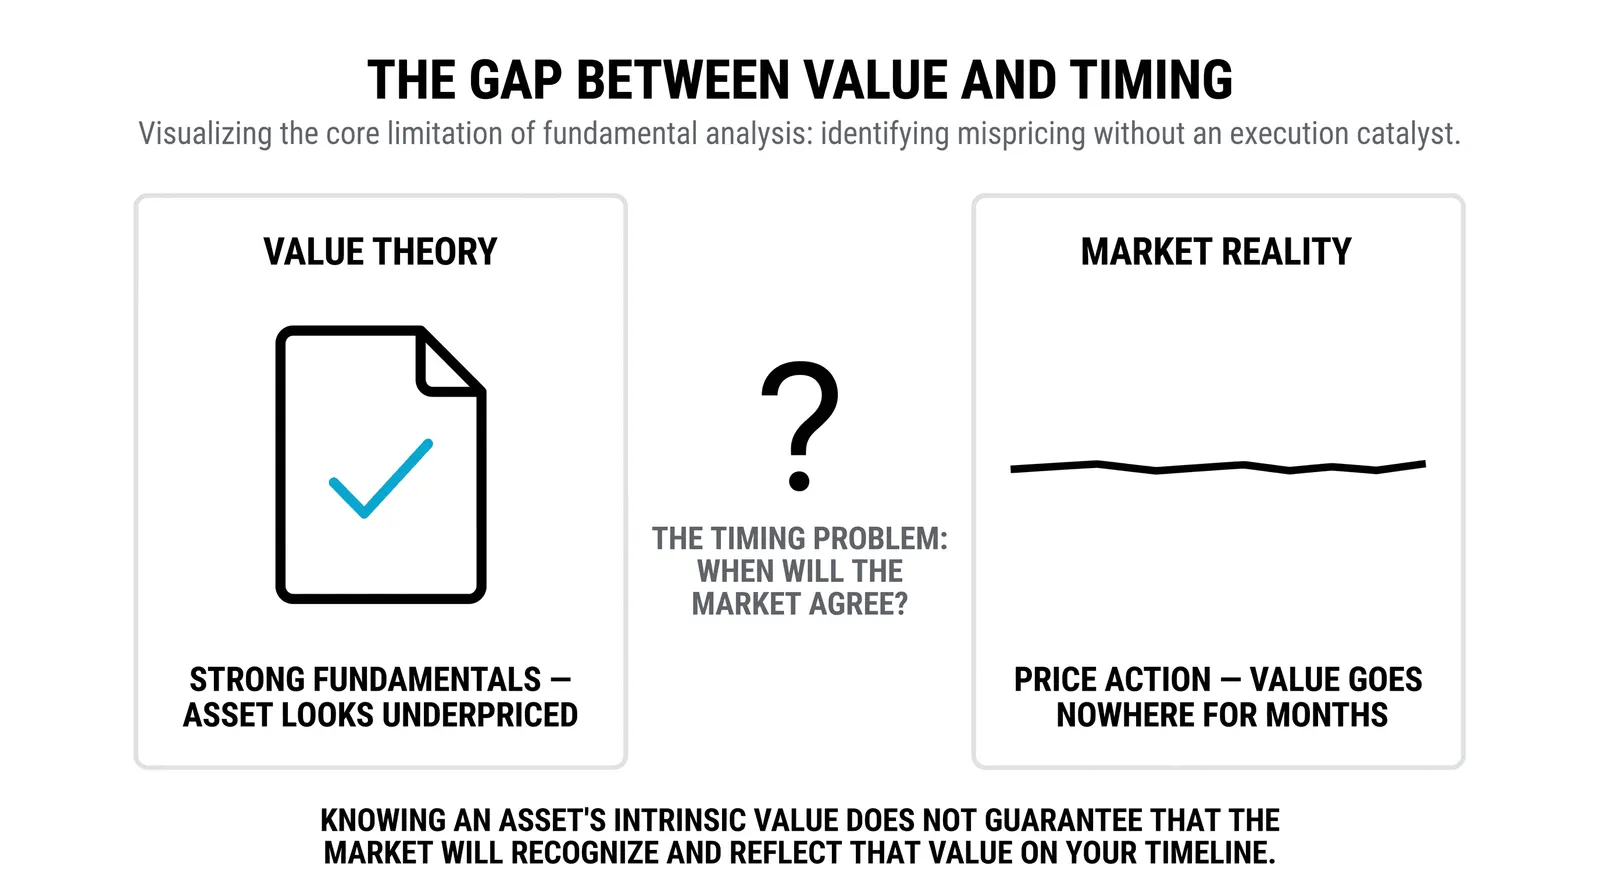
What it cannot give you is timing. A stock can trade at half your estimate of fair value and then get cheaper for two more years. Cheap is not a floor. It is an opinion, and the market is free to ignore your opinion indefinitely.
It also misses the crowd. Fundamentals assume prices eventually move toward value, but the path there is set by emotion, forced selling, and flows that have nothing to do with the business. The investor who is right about value but early by three years still loses money for three years.
So the mirror-image blind spot: fundamentals can tell you what to own, but not when to own it. The method is laid out in what fundamental analysis is.
Confluence: Two Reasons, One Price
Confluence is the point where independent methods agree. Not similar methods. Independent ones, arriving at the same conclusion by different roads.
Here is a hypothetical example with round numbers. Suppose your fundamental work says a stock is worth about 200. It currently trades at 150. That is reason one: a value gap of roughly 25 percent.
Now look at the chart. Price has spent three months moving sideways between 145 and 150. Every dip toward 145 gets bought. Volume dries up on the down days and expands on the up days. That is a base with a visible floor of buyers, and it is reason two: a structure reason.
Notice what happened. The value case came from the financial statements. The structure case came from the order flow printed on the chart. Neither one caused the other. They just happen to agree at the same price zone, 145 to 150.
That agreement is the edge. If the fundamentals are wrong, the base still gives you a defined level to be wrong against. If the base breaks, the value gap tells you the trade idea is damaged, not just the timing. Each method covers the other's weak side.
One Method vs Two, Side by Side
| One method alone | Two methods combined | |
|---|---|---|
| Blind spots | Full blind spot on one side (value or timing) | Each method covers part of the other's gap |
| Trade frequency | High, every setup qualifies | Low, only overlapping signals qualify |
| Confidence per trade | Rests on a single line of reasoning | Rests on two independent lines of reasoning |
| Failure mode | Silent, you find out after the loss | Often visible early, one leg stops agreeing |
The trade-off is real. You will take fewer trades, and some winners will happen without you because only one method agreed. Accept that upfront. Filtering is the point, not the cost.
The Rule That Keeps This Honest
Each method must agree for a different reason. This is the rule most people break without noticing.
If your two confirmations are a moving average crossover and a momentum indicator, you may only have one reason. Both are computed from the same price history. The same fact counted twice is not confirmation. It is repetition with extra steps.
A real second reason comes from a different source of information. Financial statements versus price structure. Earnings revisions versus volume behavior. The more independent the inputs, the more the agreement means.
Before any trade, write both reasons down in one sentence each. If the sentences boil down to the same fact, you have one reason, and repetition is not a second one.
Questions About Combining Analysis
Isn't this overcomplicating things for a beginner?
No, as long as you stop at two methods. Two is the right ceiling for now. Three or four methods sounds safer but usually means you will always find something that disagrees, and you will freeze or cherry-pick. One chart skill plus one fundamental check is enough structure to filter trades without burying you.
Do professionals actually combine methods?
Yes, most of them do, even the ones with a strong primary style. Pure quants still check whether a signal makes economic sense. Deep value funds still watch price action before sizing in. The labels differ, but the habit of demanding two independent reasons is close to universal among people who survive.
Where exactly do I start?
Start with one chart skill and one number. For the chart, learn to spot a base: a sideways range with a floor that keeps holding. For the number, pick one valuation measure, such as price-to-earnings versus the company's own history, and learn what cheap and expensive look like for it. Practice finding situations where both line up, on paper, before risking anything.
What if the two methods disagree?
Then there is no trade, and that is the system working. Disagreement is information. A cheap stock in a falling chart is telling you the crowd knows something or the selling is not done. Wait for the chart to stabilize, or move on. Forcing a trade when your methods argue is how combining analysis turns into its opposite.
Your next step is to build a short pre-trade checklist, one line per method, and use it on paper trades for a month. The habit of writing down two independent reasons before every entry is the skill that makes everything else in this course stick. For a taste of a third, independent lens entirely, see intermarket analysis.