What Is Fundamental Analysis
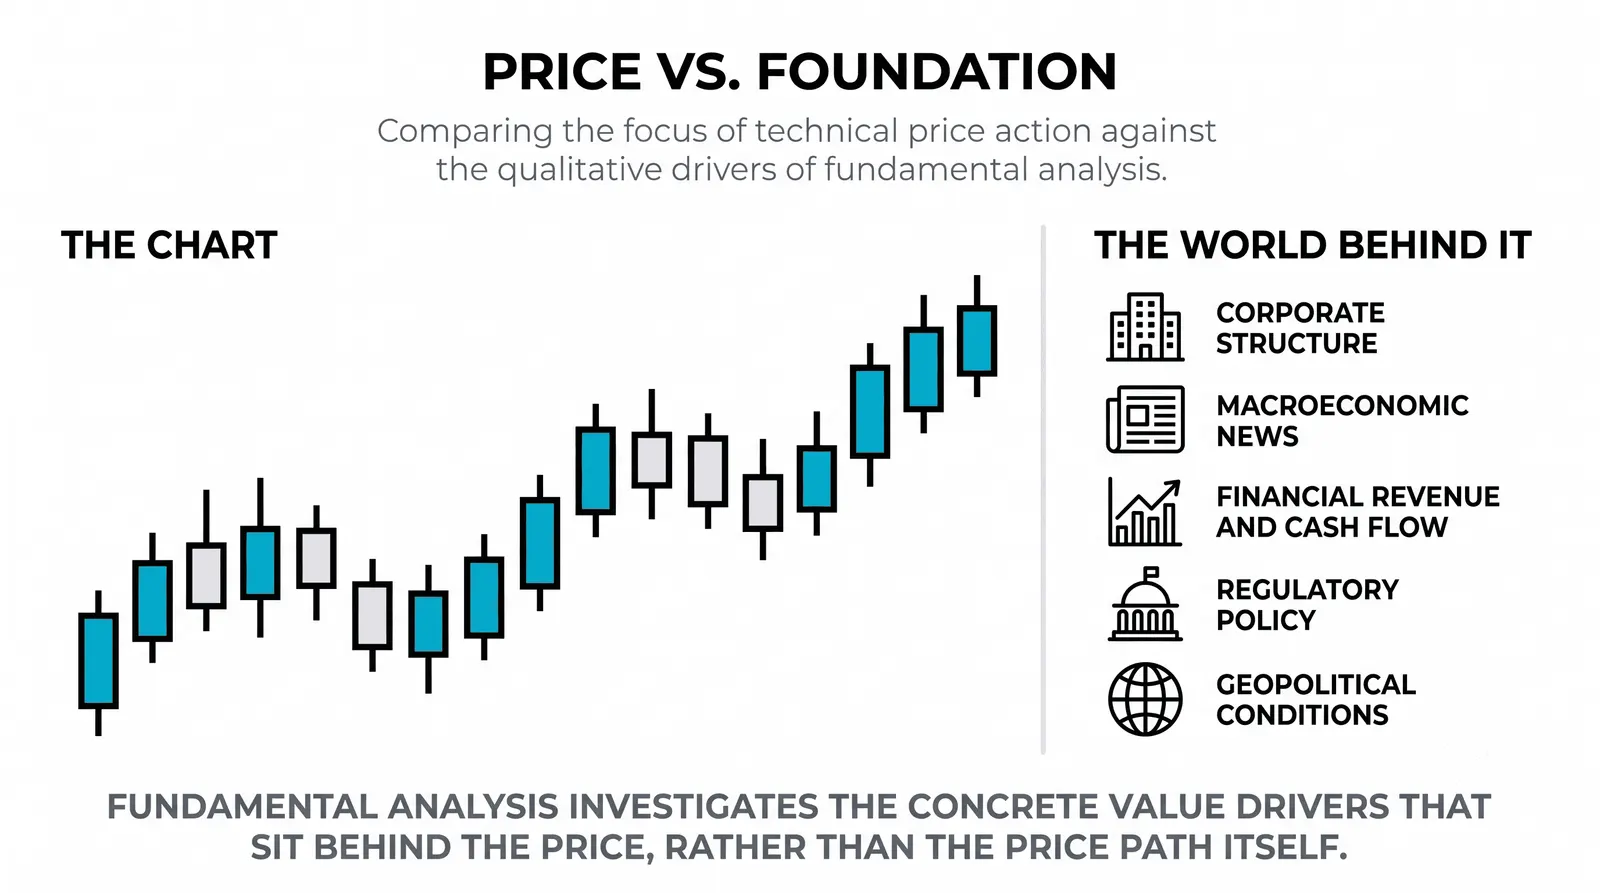
Fundamental analysis is the practice of judging what an asset is actually worth using real-world factors like earnings, cash flow, debt, interest rates, and economic growth, rather than chart behavior. You are asking a simple question: what is this thing worth, and does the current price make sense? Everything else in this post is detail on how to answer that question honestly.

Think of it like buying a used car. You check the engine, the mileage, and the service history before you look at the paint. The chart is the paint.
The Inputs, Market by Market
Each market has its own set of raw materials. The logic stays the same, but the numbers you pull differ.
Stocks. You look at earnings, cash flow, and debt, because a company that earns consistently and owes little can survive bad years and fund its own growth.
Currencies. You watch interest rates, inflation, and growth, because money flows toward economies offering higher real returns with stable prices.
Crypto. You track adoption and network activity, because a chain with growing users and transactions has demand behind it, while one with neither is a ticker and a story.
Notice what is missing from every list: the chart. That is deliberate. A fundamental analyst treats price as the thing to be explained, not the explanation.
Top-Down or Bottom-Up
There are two directions you can work, and both are legitimate.
Top-down starts wide and narrows. You assess the economy first, then pick the industries that benefit from those conditions, then find the strongest companies inside those industries. If rates are falling, for example, you might favor sectors that borrow heavily, then hunt for the best operator in that group.
Bottom-up reverses the order. You find a company with strong numbers on its own merits, then check whether the industry and economy will help or hurt it. The idea is that a genuinely good business can do well even in a mediocre environment.
Beginners often ask which one is correct. Neither. Top-down keeps you from fighting the macro tide, and bottom-up keeps you from buying a mediocre company just because its sector is hot. Most working analysts blend the two without thinking about it.
What the Work Actually Looks Like
Here is a simplified, hypothetical example with round numbers.
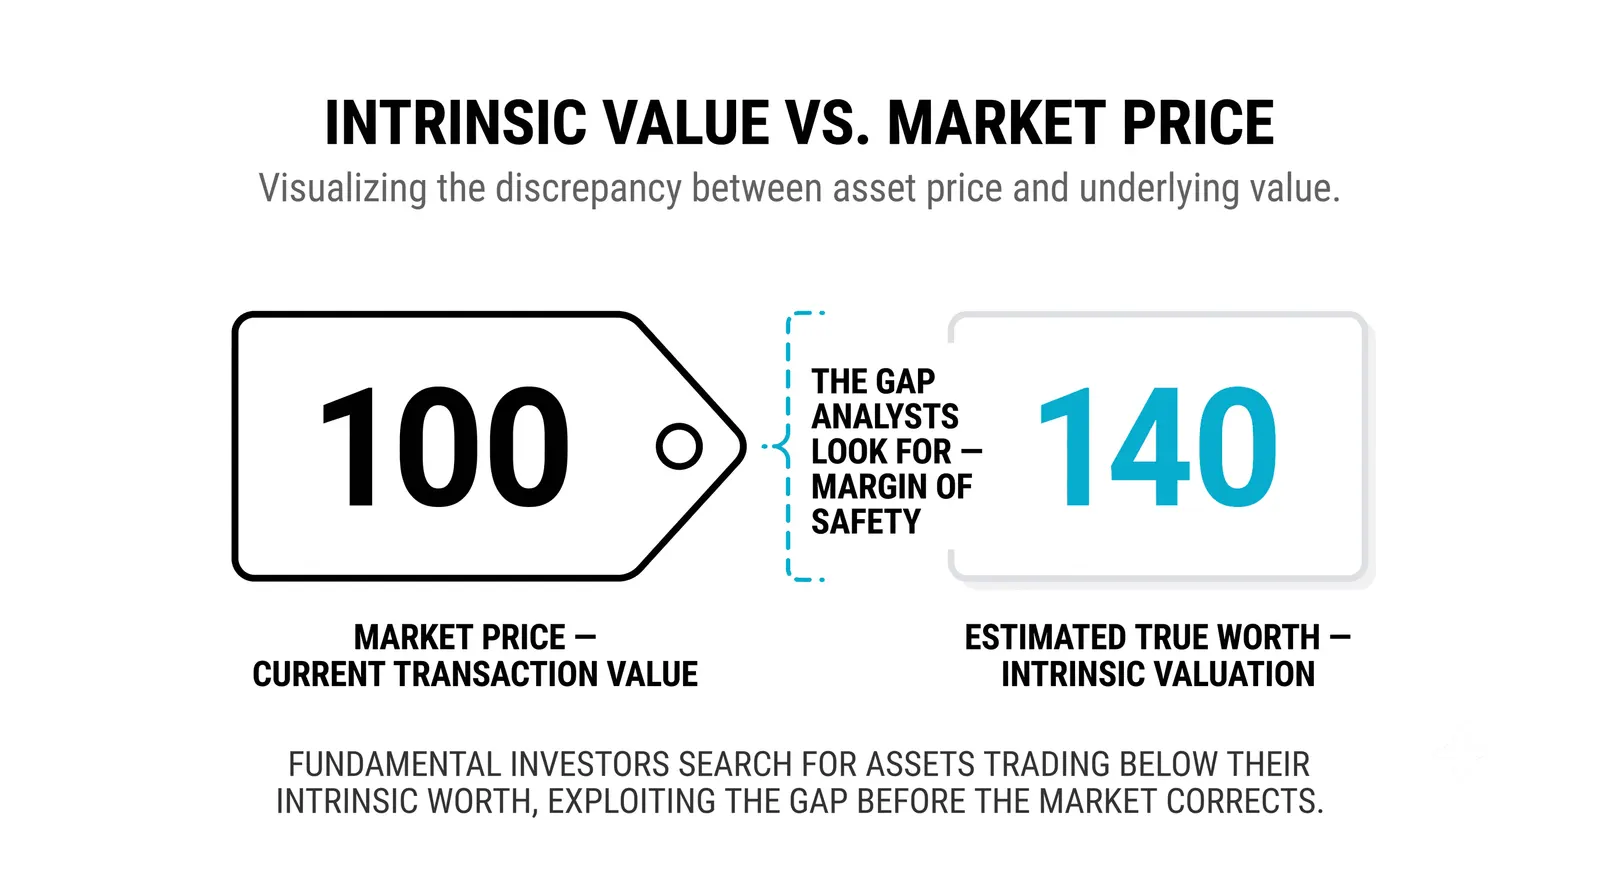
Imagine a company earns 10 per share each year, and it has done so reliably. Similar companies in its industry trade at about 20 times earnings. Multiply 10 by 20 and you get 200, a rough reference point for what the market typically pays for this kind of earnings stream.
Now suppose the stock trades at 150. The gap between 150 and 200 is where the real work begins. The lazy conclusion is that the stock is cheap and you should buy it. The better question is: what does the market see that my simple math does not?
Maybe debt is rising. Maybe a competitor is taking share. Maybe earnings are about to fall, and the 10 per share is history, not the future. The multiple comparison did not give you an answer. It gave you a question worth investigating. That is what fundamental analysis actually produces: better questions, not certainties.
Sometimes the investigation confirms the discount is real and unjustified. Sometimes it reveals exactly why the discount exists. Both outcomes are useful, because both keep you out of blind trades.
Fundamental vs Technical, Side by Side
These two approaches get framed as rivals, but they answer different questions. This table keeps it short.
| Fundamental | Technical | |
|---|---|---|
| Question asked | What is it worth? | Where is price likely to go? |
| Inputs | Earnings, rates, economic data | Price, volume, patterns |
| Typical horizon | Months to years | Minutes to weeks |
| Main weakness | Right about value, wrong about timing | No opinion on underlying worth |
Read the weakness row twice. Each method fails in a way the other one covers. That is why many experienced traders use fundamentals to decide what to trade and technicals, covered in what technical analysis is, to decide when.
The Honest Limits
You deserve the uncomfortable parts, because this is where beginners get hurt.
Cheap can stay cheap for years. A stock trading below your estimate of fair value can stay there far longer than your patience or your account can tolerate. Being right about value says nothing about when the market will agree with you.
The numbers arrive late. Earnings come out quarterly. Economic data comes out monthly, often revised afterward. You are always analyzing a photograph of the past and projecting it forward. Markets, meanwhile, price the future in real time.
Guidance can be wrong. Companies miss their own forecasts constantly. Analysts who cover a stock full time get surprised regularly. Your estimate of fair value is built on assumptions, and assumptions break.
None of this makes fundamental analysis useless. It makes it a tool for framing decisions, not a machine that prints correct answers. Treat any fair value number as an estimate with a wide error bar, and size your positions accordingly.
Questions About Fundamental Analysis
Is fundamental analysis only for long-term investors?
No, but it fits long horizons most naturally. Value gaps take time to close, so investors get the most direct benefit. Shorter-term traders still use it as a filter, avoiding assets with deteriorating fundamentals even when the chart looks fine.
Do traders use fundamentals at all?
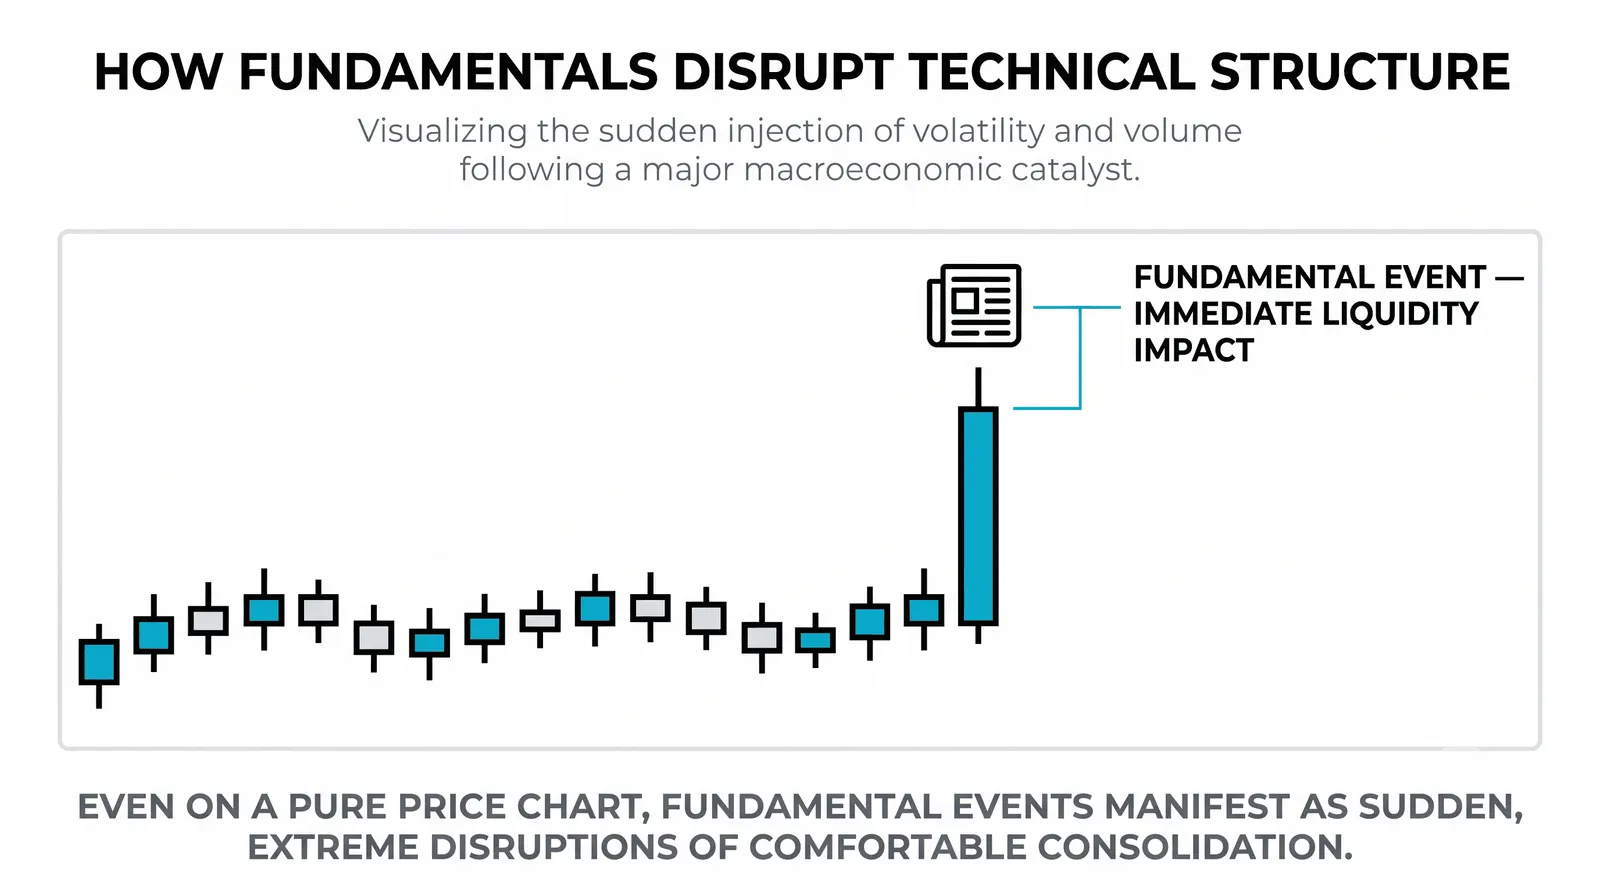
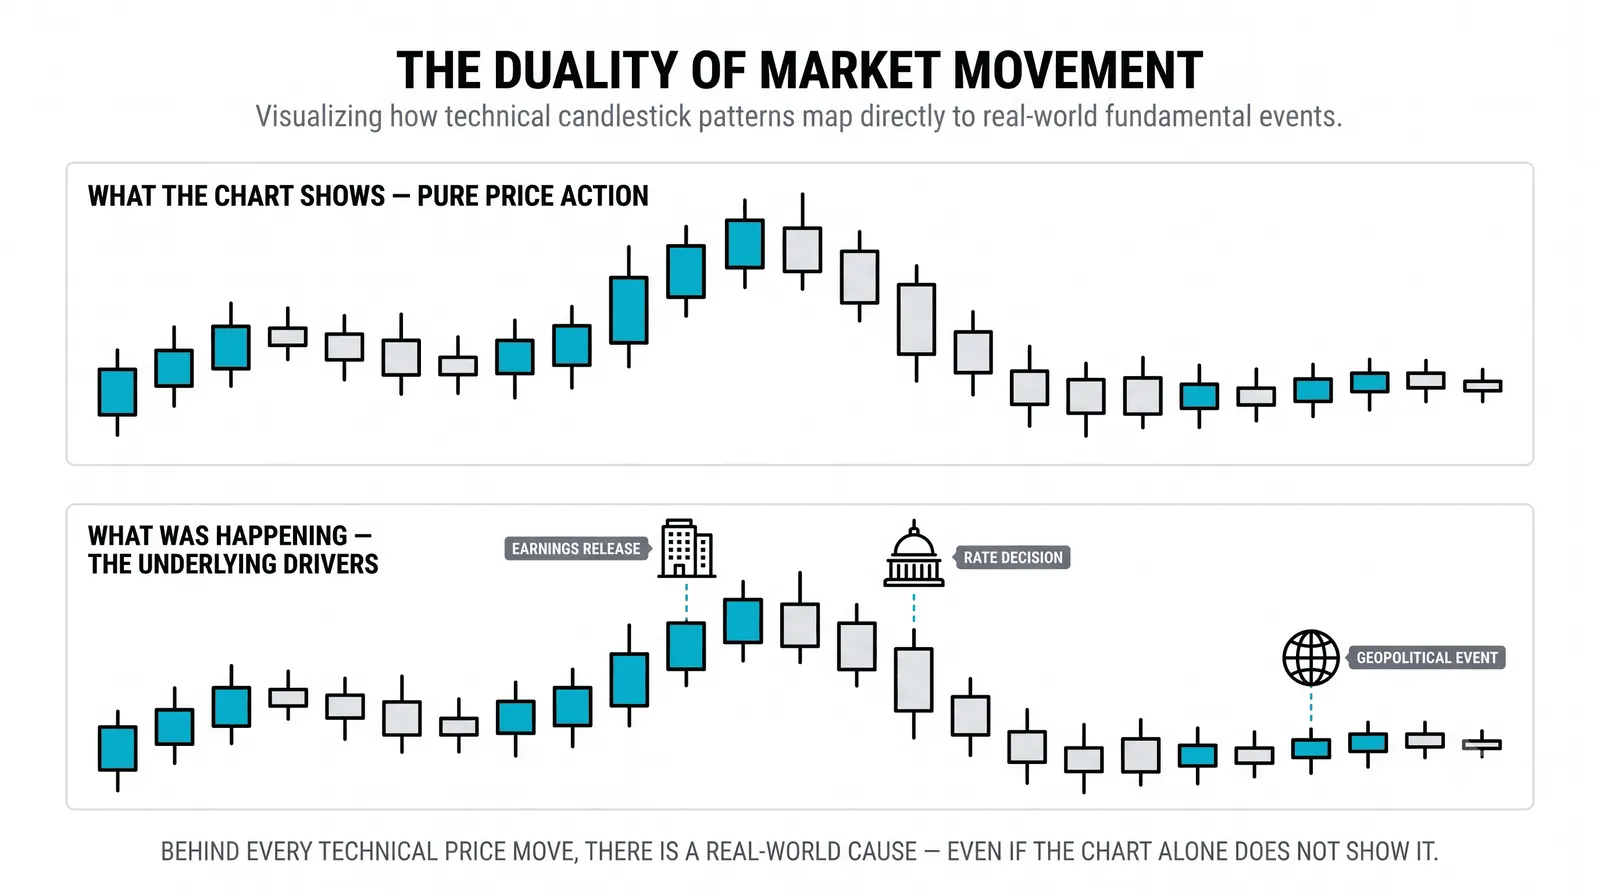
Yes, mostly as context and as an event calendar. Earnings dates, central bank decisions, and inflation releases all move prices violently, and a trader who ignores them gets blindsided. You do not need to build valuation models to respect the schedule.
Where do I find the numbers?
Company financials come from quarterly and annual reports, which are free on regulator and company investor-relations sites. Economic data comes from government statistics offices and central bank publications. Most charting platforms and financial news sites summarize both, which is fine for learning, but go to the source when a decision matters.
Which should I learn first, fundamental or technical?
Learn whichever matches your intended timeframe first, then add the other. If you plan to hold positions for months, start with fundamentals. If you plan to trade intraday or swing, start with technicals and pick up fundamental awareness as you go. Either way, you will eventually want both, because each one covers the other's blind spot.
Next, practice reading one real earnings report from a company you already know, and write down your own rough estimate of what it is worth before you check the current price. That single exercise teaches more than a dozen articles, and it pairs naturally with how earnings releases move prices, where fundamental analysis meets actual trade timing.