How Intermarket Analysis Works
Intermarket analysis is the practice of reading bonds, stocks, currencies, and commodities as four gauges fed by the same forces, so a move in one market becomes context for another instead of noise. Those forces are interest rates, growth expectations, and risk appetite. Every one of the four markets prices them constantly, from a different angle.

Think of it this way: four reporters covering the same fire file four different stories, and the fire, not any single story, is the event. Your job is to read all four stories and infer the fire.
Why No Market Moves Alone
Each asset class answers a different question about the same economy. Bonds answer: where are rates headed, and how scared is capital right now? Stocks answer: how strong are future earnings expected to be? Currencies answer: which economy offers the best return and the safest parking? Commodities answer: how much does the physical world cost today?
Because all four respond to the same three forces, they move in related ways. A shift in rate expectations hits bonds first, then bleeds into stocks, then the currency, then commodities. The sequence varies, but the linkage does not disappear.
Studying one market in isolation throws away context the other three already printed. If you trade stock index futures and never glance at yields, you are ignoring the market that often moves first. If you trade gold and never check the dollar, you are missing half of gold's engine.
This does not mean you need to become an expert in four markets. It means you learn the handful of relationships that repeat, and you check them before you commit to a bias. A sibling lesson covers correlations, the measured statistics of how pairs move together. This lesson stays at the level of direction and logic, no numbers required.
The Bond-Stock Relationship
Start here, because this is the relationship you will use most. Bond yields and stock prices compete for the same pool of capital, and that competition creates a push-pull you can read.
When yields rise, two things pressure stocks. First, bonds now pay more, so some capital leaves equities for the safer return. Second, higher yields mean higher borrowing costs for companies, which squeezes future earnings. Both effects pull the same direction.
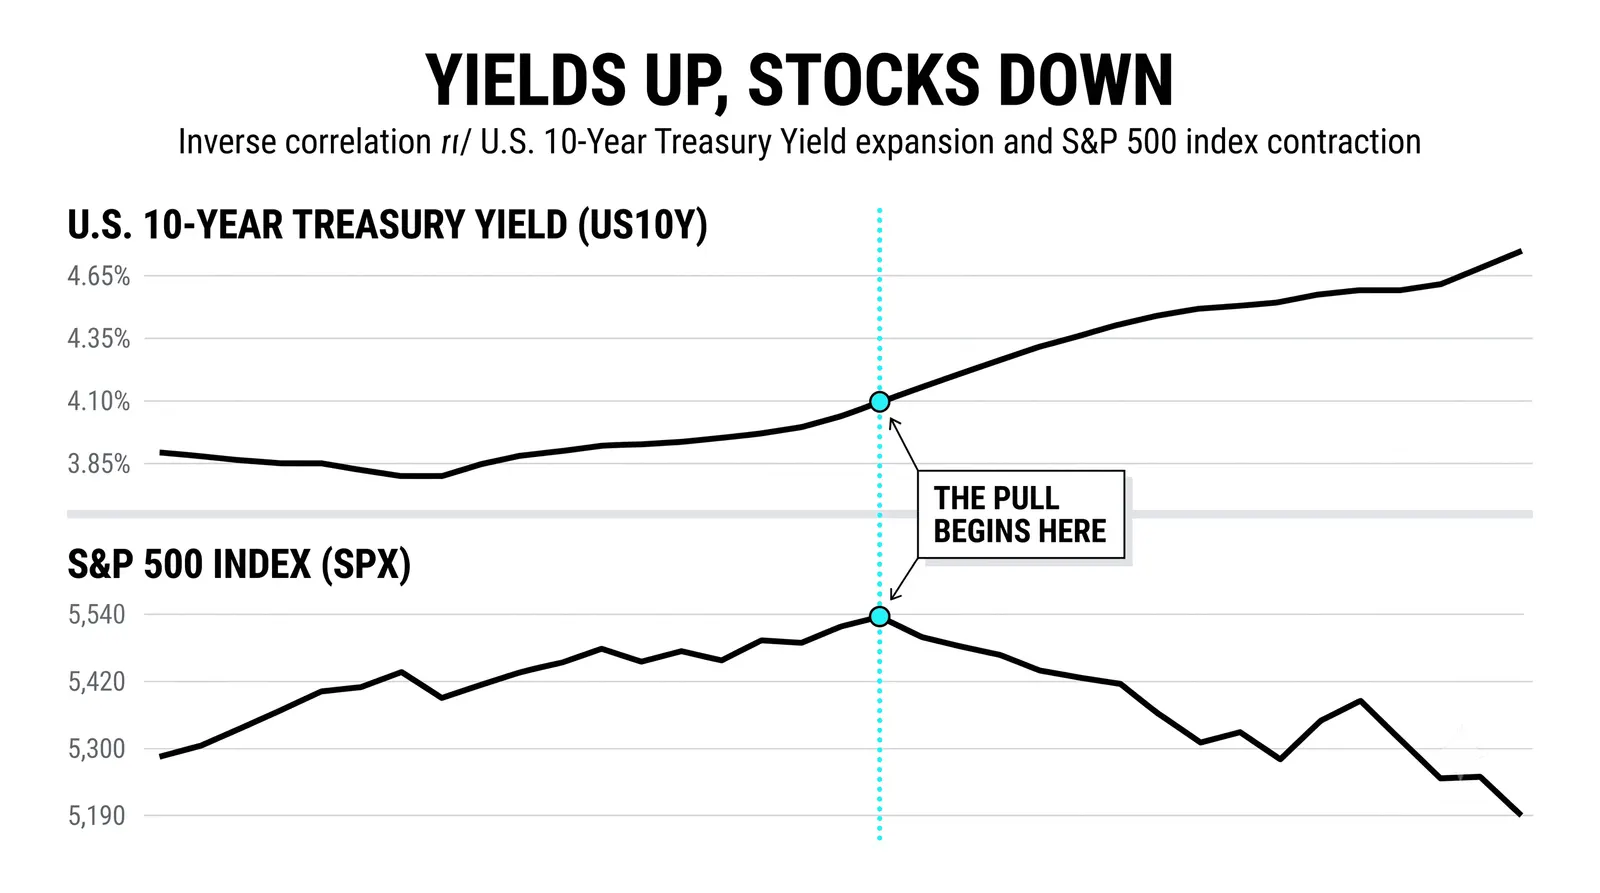
When yields fall, both pressures ease. Bonds pay less, so stocks look better by comparison, and cheaper borrowing supports earnings. This is why stock rallies so often run alongside falling yields.
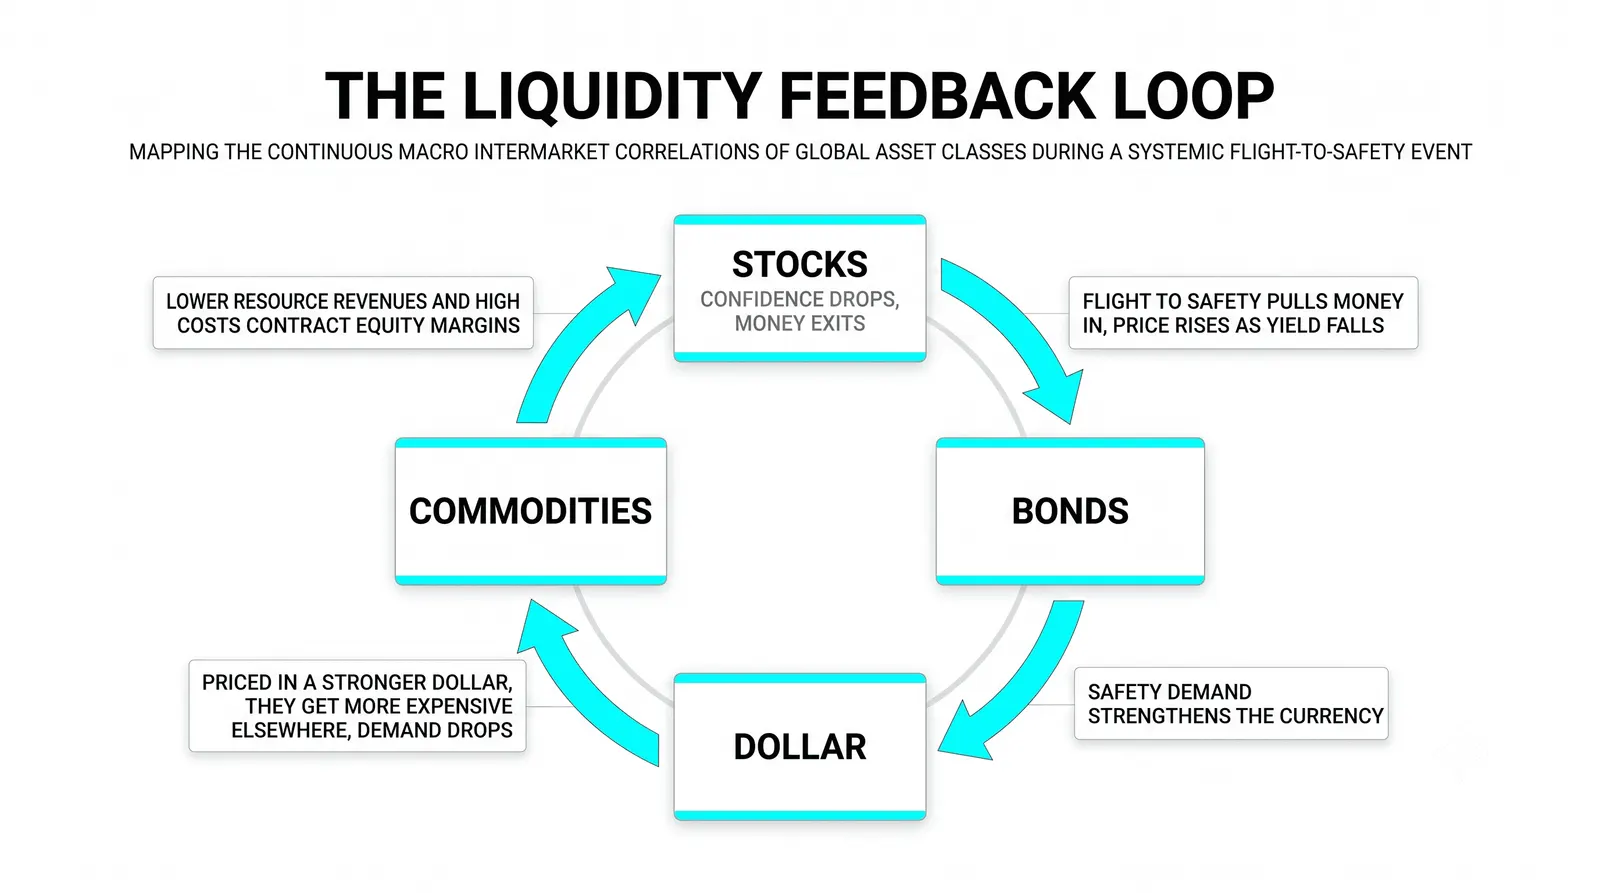
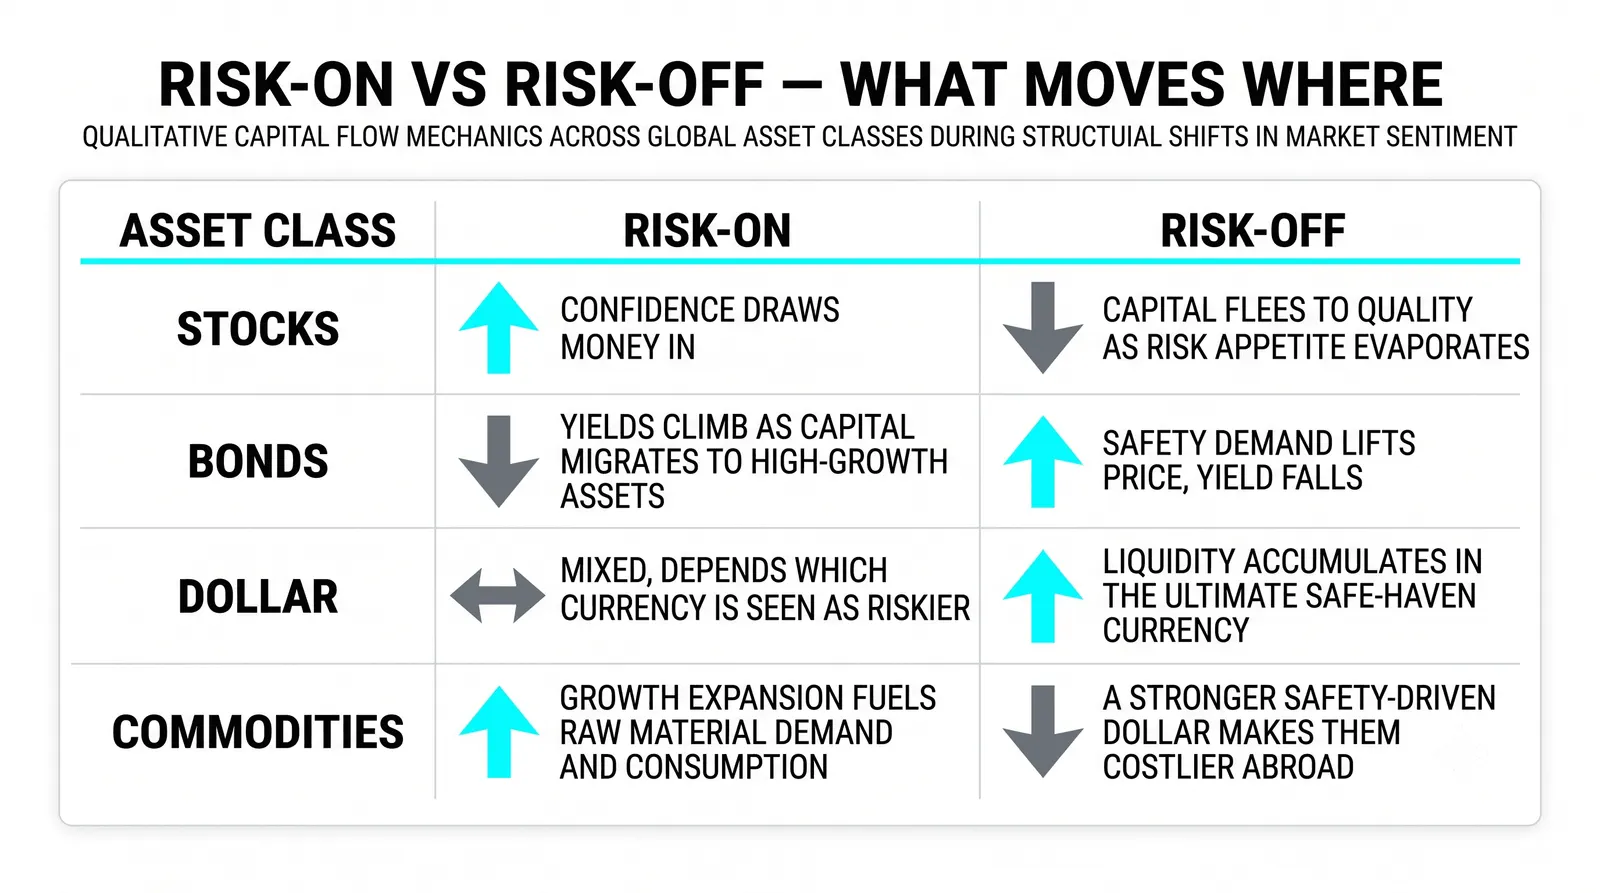
Traders describe the flow between these two markets with two terms. Risk-on means money moving out of bonds and into stocks: yields rise because bond prices fall, and equities climb. Risk-off means the reverse: money leaves stocks and buys bonds. A flight to safety is the sharp version of risk-off, and it has a precise signature: bonds get bid, prices up, yields down.
Be honest about the limits. This relationship bends and it lags. Sometimes yields and stocks rise together for weeks because growth expectations dominate. Sometimes the bond market reacts hours before equities, sometimes after. Treat it as a strong tendency, not a law.
Currencies and Commodities: The Dollar Effect
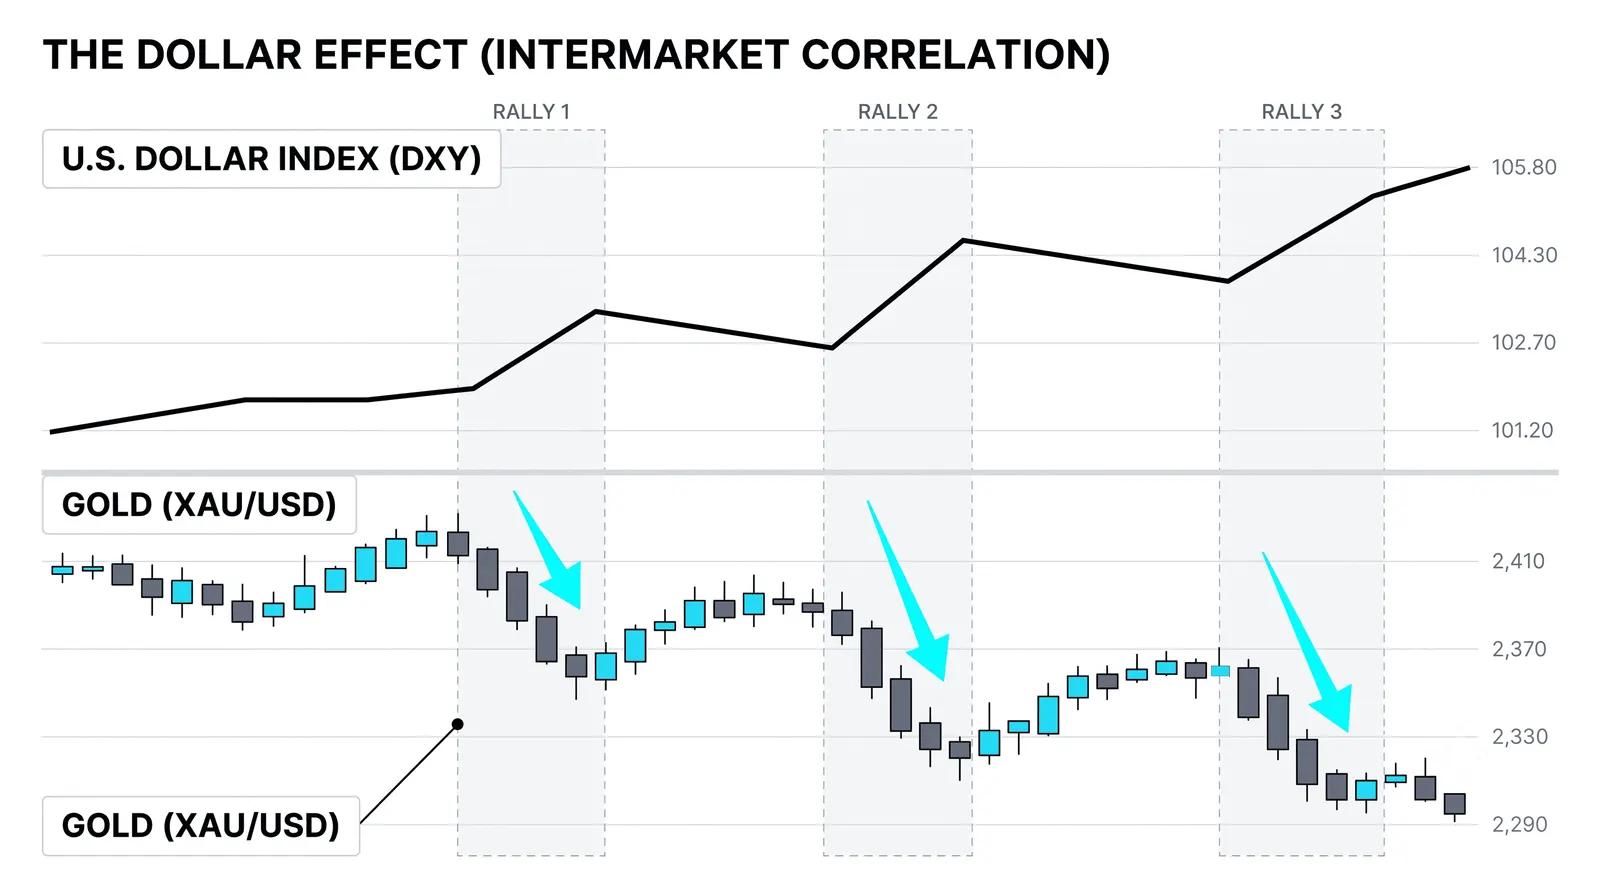
The cleanest intermarket relationship involves no judgment at all. Most major commodities are priced in US dollars, and that single fact creates a mechanical link.
When the dollar strengthens, a barrel of oil or an ounce of gold costs more in euros, yen, or yuan. Foreign buyers pull back, demand softens, and the dollar price sags. When the dollar weakens, the same goods get cheaper for the rest of the world, demand picks up, and prices lift.
Nothing about the commodity itself changed. The pricing unit moved. That is why this relationship is the most reliable of the bunch: it comes straight from arithmetic, not sentiment.
Gold sits at the intersection of two of these channels. It falls when the dollar rises, and it also falls when real yields rise, because gold pays nothing and suddenly competes with a better-paying bond. When both hit at once, gold's drop can be fast. When both reverse, the rally can be just as sharp.
Reading Intermarket Signals Together
One market confirming your idea is interesting. Three markets telling the same story is a picture. The practical method is a three-direction read: check yields, check stocks, check the dollar, and ask whether they agree.
Say yields are climbing, stocks are falling, and the dollar is rising. All three point to tightening conditions and defensive positioning. That is one coherent picture, and it should weigh on any long-equity idea you were considering. Now say yields are falling, stocks are rising, and the dollar is flat. That is a risk-on picture with no contradiction. Your long bias has company.
Mixed reads happen constantly, and they carry information too. If stocks rally while yields spike, something unusual is driving one of them, and caution is the correct response. Disagreement between markets is a signal to shrink your conviction, not to pick a side and argue.
These reads add weight to a bias. They never replace the chart work. Your levels, your structure, and your session context still decide the trade. Intermarket context decides how much you trust the setup and how much size it deserves. When you want to turn these relationships into a hard ranking of which asset is strongest, that is what relative strength does, and a sibling lesson covers it.
One Day, Four Markets
Here is a hypothetical session, with round numbers, to show the read in action. Nothing here is a recommendation; it is an illustration of the thinking.
The session opens and the 10-year yield jumps from 4.20 percent to 4.35 percent in the first hour. That is a fast move. Rising yields mean bond prices are falling, and the first question is whether stocks will feel the pressure.
They do. Stock index futures slide from 5,200 toward 5,120. The bond market moved first, and equities confirmed the direction. Two markets now agree: capital is being repriced defensively.
Next, the dollar index climbs. A firmer dollar alongside rising yields fits the same story, since higher US rates attract capital into dollar assets. Three markets, one direction.
Then gold sells off, and it has two reasons. The stronger dollar makes it more expensive for foreign buyers, and higher yields make a zero-yield asset less attractive. Gold is taking the double weight, and its decline confirms the read from a fourth angle.
Step back and count. Yields up, stocks down, dollar up, gold down. Four moves, one risk-off picture, confirmed from three directions beyond the market you might be trading.
Now imagine you came into the day holding a long bias on the stock index. Your levels might still look fine on the chart. But the intermarket read just delivered a second opinion, and the second opinion said wait. You do not have to short. You can simply stand down, keep your risk flat, and let the day prove itself. Passing on a trade that the whole market complex argued against is a win you never see on a statement.
The Four Core Reads at a Glance
| First Move | What It Signals | Typical Read for Other Markets |
|---|---|---|
| Yields up | Rate expectations rising or bonds being sold | Stocks pressured, dollar often firm, gold under weight |
| Yields down | Easing expectations or demand for safety | Stocks relieved if growth holds, gold supported, dollar softens |
| Dollar up | Capital flowing toward US assets | Commodities sag, gold pressured, foreign buyers retreat |
| Risk-off stretch | Defensive positioning across markets | Bonds bid and yields down, stocks down, dollar and gold mixed by safe-haven demand |
Use this table as a starting map, not a script. Markets will hand you days that match no row, and those days are information too.
Intermarket Analysis, Answered
Do I need four charts open all day?
No. You need a pre-session check of yields, the dollar, and one or two commodities relevant to what you trade, plus a quick recheck when something moves sharply. Most traders run this on a small secondary screen or a single watchlist with four tickers. The goal is awareness, not surveillance.
Which relationship should I learn first?
Learn bonds versus stocks first, because it influences the widest range of instruments and it frames the risk-on and risk-off language you will hear everywhere. Add the dollar-commodity link second, since it is mechanical and easy to verify. Those two cover most of what you will actually use.
Does this work for day trading?
Yes, but as a filter rather than a trigger. On an intraday basis, intermarket reads tell you whether the wind is at your back or in your face, and they help you size and select trades. They do not give you entries. Your session levels and structure still do that job.
What happens when the relationships break down?
They bend, lag, and occasionally invert, and you should expect it. When markets that usually agree start disagreeing for days, treat it as a regime question: something in the underlying forces has shifted, and your job is to reduce conviction until a consistent picture returns. The traders who get hurt are the ones who keep trading the old relationship after the market stopped honoring it.
From here, the natural next step is the correlation lesson, where these directional reads get measured, and then relative strength, where they get ranked. Build the habit of the three-direction check now, and those tools will have something solid to stand on.