Why Context Matters in Analysis
In any analysis, context is everything that surrounds a signal, and it decides what the signal means. A breakout, a hammer candle, a moving-average cross: none of these carry meaning on their own. They borrow meaning from where they happen, what came before them, and which timeframe you are looking at.

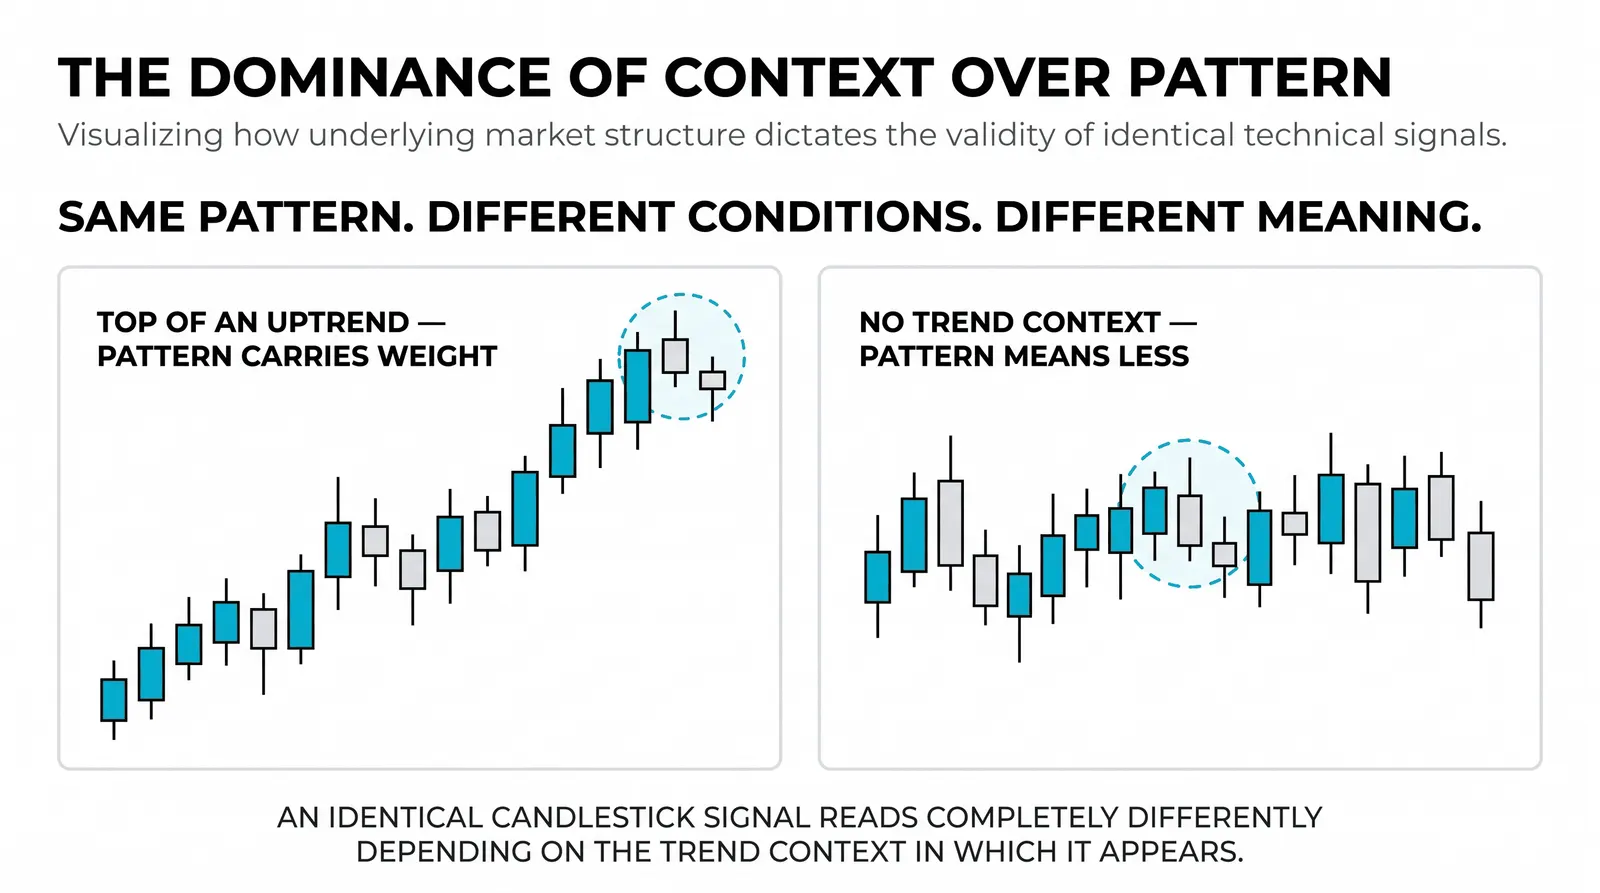
The same pattern in different surroundings can point in opposite directions. That is not a flaw in the pattern. That is how markets work. A signal is a word, and context is the sentence it sits in.
Most losing trades from new traders are not bad signals. They are decent signals read in a vacuum. This post shows you how to stop doing that.
What Context Actually Means
Context has three parts, and you can check all three in under a minute.
First, where price sits on the bigger chart. Is it near a high, near a low, in the middle of a range, or pressing against a level that has mattered before? Location changes everything. A buy signal at the top of a two-year range is a different animal from the same signal at the bottom.
Second, what preceded the signal. Did price drift sideways for weeks, or did it just sprint 30 percent? A quiet chart and an exhausted chart produce the same candle shapes with very different odds behind them.
Third, which timeframe you are on. A strong uptrend on the 15-minute chart can be a tiny pullback inside a daily downtrend. If you only look at one timeframe, you are reading one page of a book and guessing the plot. Trend structure on the bigger chart is the first layer, and it is defined in what a trend is.
The Same Signal, Two Opposite Meanings
Here is a hypothetical example with round numbers. Stock A has traded sideways between 90 and 100 for three months. Volume is quiet. The chart looks bored. Then price breaks above 100 and holds. That breakout is a possible start. The long base means sellers at 100 have been absorbed, and new buyers are stepping in with room above them.
Now stock B. It has run from 72 to 100 in three weeks, a near-vertical 40 percent climb. Then it prints the identical breakout above 100. Same price, same candle shape, same level. But this one smells like exhaustion. Everyone who wanted in is already in. The breakout is more likely to be the last burst of buying than the first.
Same signal. Opposite meaning. The only difference is what came before it, and that difference is the whole trade.
Think of it like a person saying "I'm fine." Said calmly after a good week, it means one thing. Said through clenched teeth after a terrible day, it means the opposite. The words are identical. The context is the message.
Read the Layers in Order
Zoom out before you zoom in. This is the single habit that fixes most context blindness.
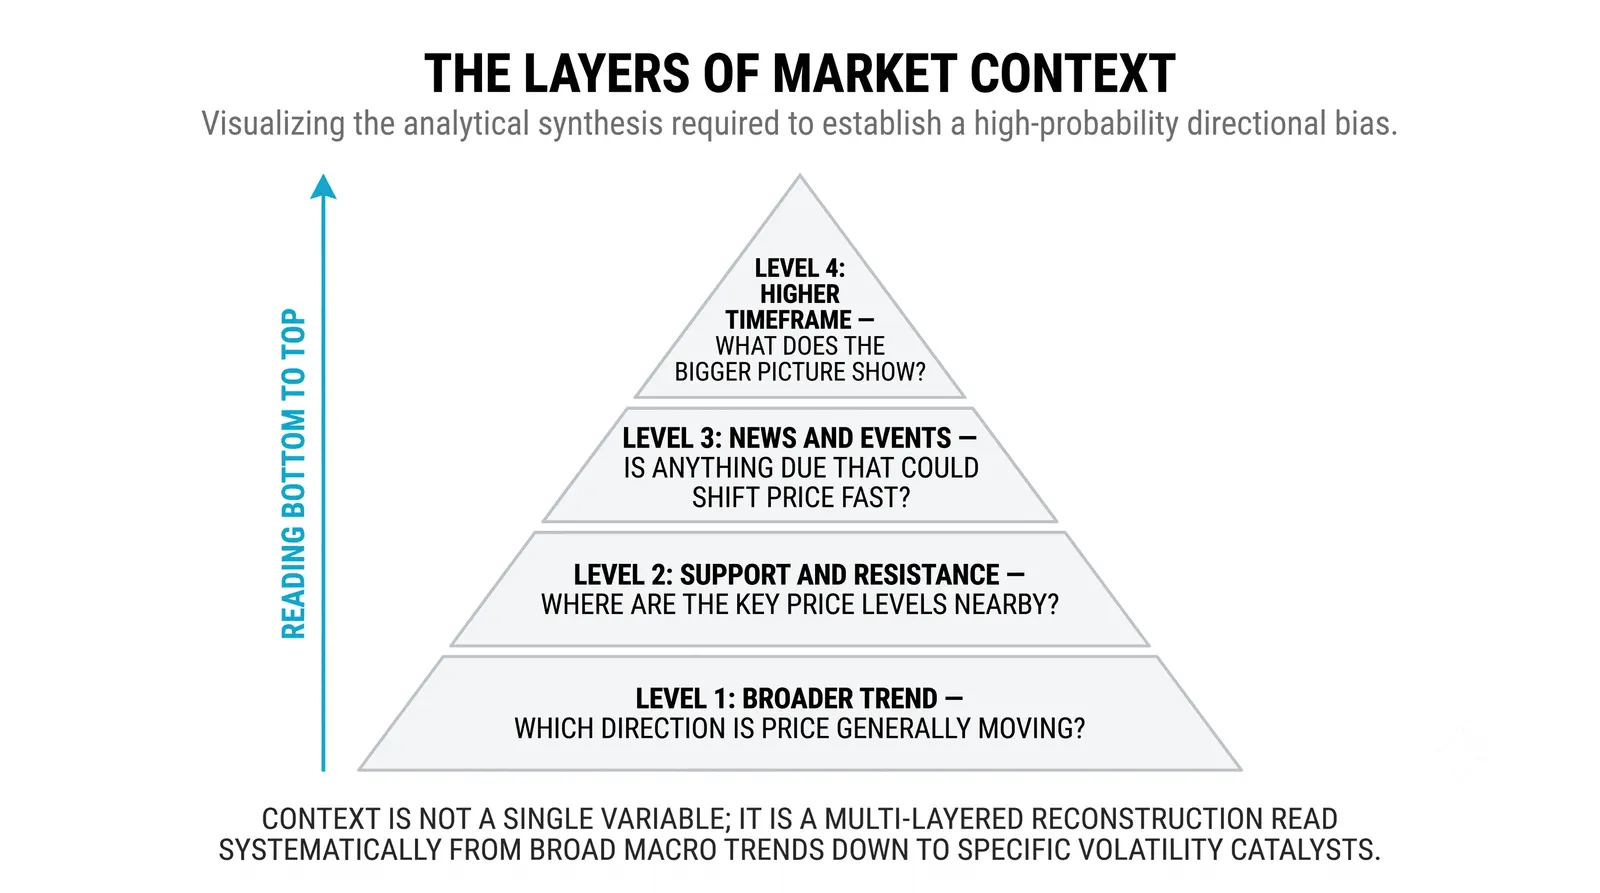
Start with the bigger timeframe. If you trade off the hourly chart, look at the daily first. Ask one question: is price trending, ranging, or sitting at a major level? Write the answer down if you have to.
Then drop to the level. Mark where price is relative to recent highs, lows, and obvious support or resistance. A signal that fires directly into resistance is weaker than the same signal with open space above it.
Only then look at the single candle or pattern. The candle is the last thing you read, not the first. Most beginners do this backwards. They spot a pretty candle, then go hunting for reasons to take it. The candle-location idea gets its own deep dive in why location matters more than the pattern.
- Bigger timeframe: trend, range, or key level?
- Location: where does the signal sit relative to support and resistance?
- The signal itself: does the candle or pattern agree with the first two answers?
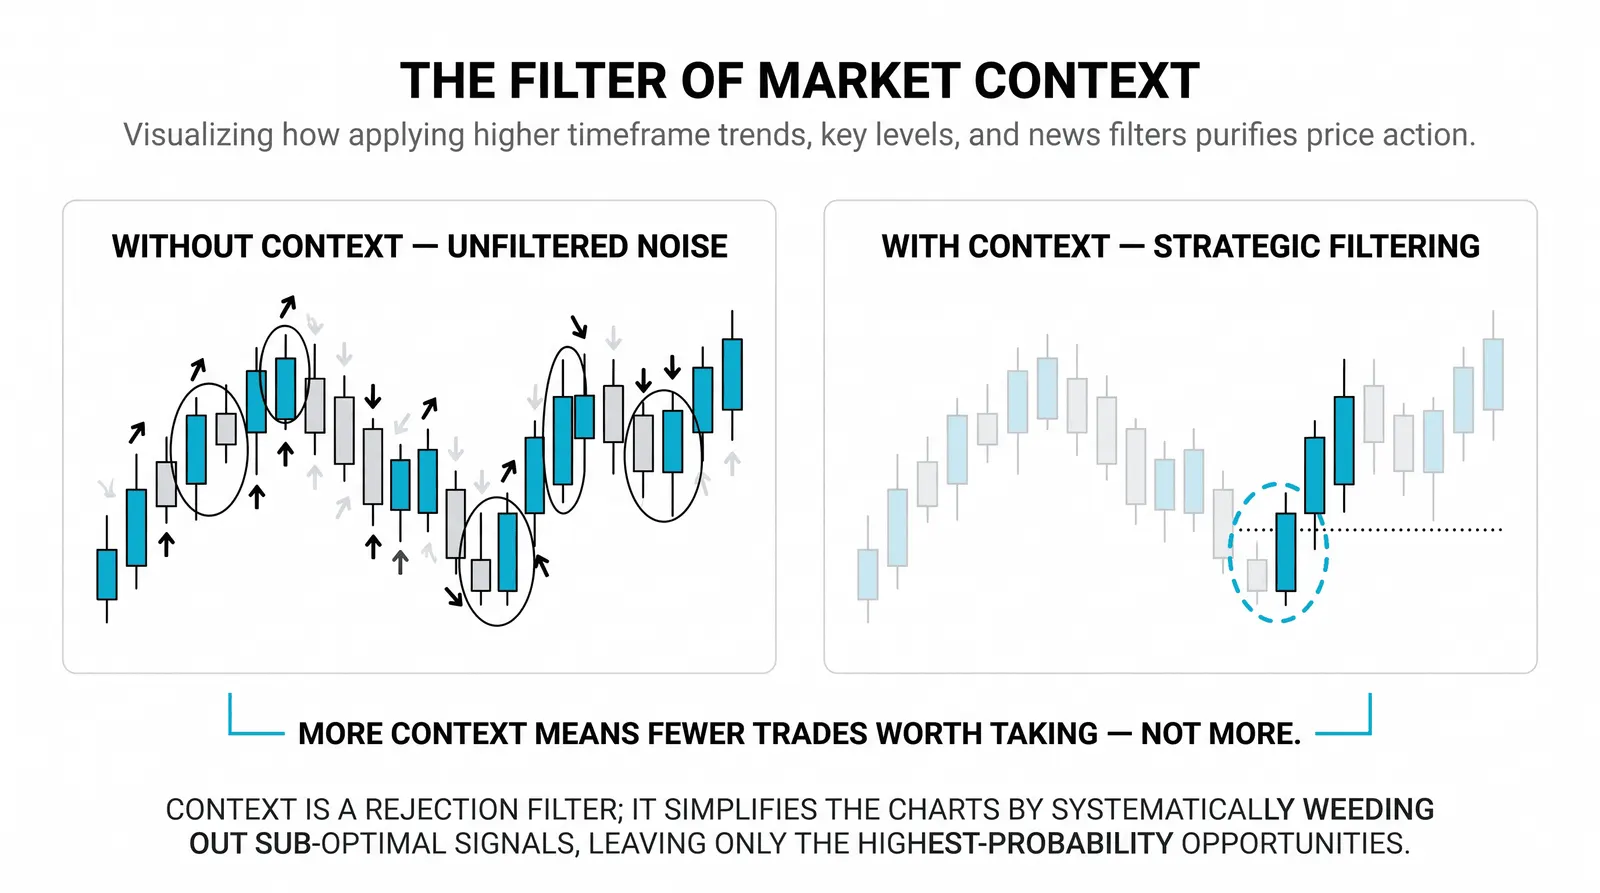
If the three layers disagree, the trade is weaker than it looks. If they line up, an ordinary signal can be a good trade.
One Signal, With and Without Context
The table below shows how the reading of three common signals flips depending on surroundings.
| Signal | Read without context | Read with context |
|---|---|---|
| Breakout above resistance | Buy, price is moving up | Strong after a long base; suspect after a steep vertical run |
| Hammer candle | Bullish reversal, buy | Meaningful at support after a decline; noise in the middle of a range |
| Moving-average cross | Trend has changed | Useful in trending markets; whipsaws constantly in a sideways range |
None of the signals in the left column are wrong. They are just incomplete. The right column is where the actual decision lives. Context is a core habit of technical analysis, not an optional extra.
What Skipping Context Costs You
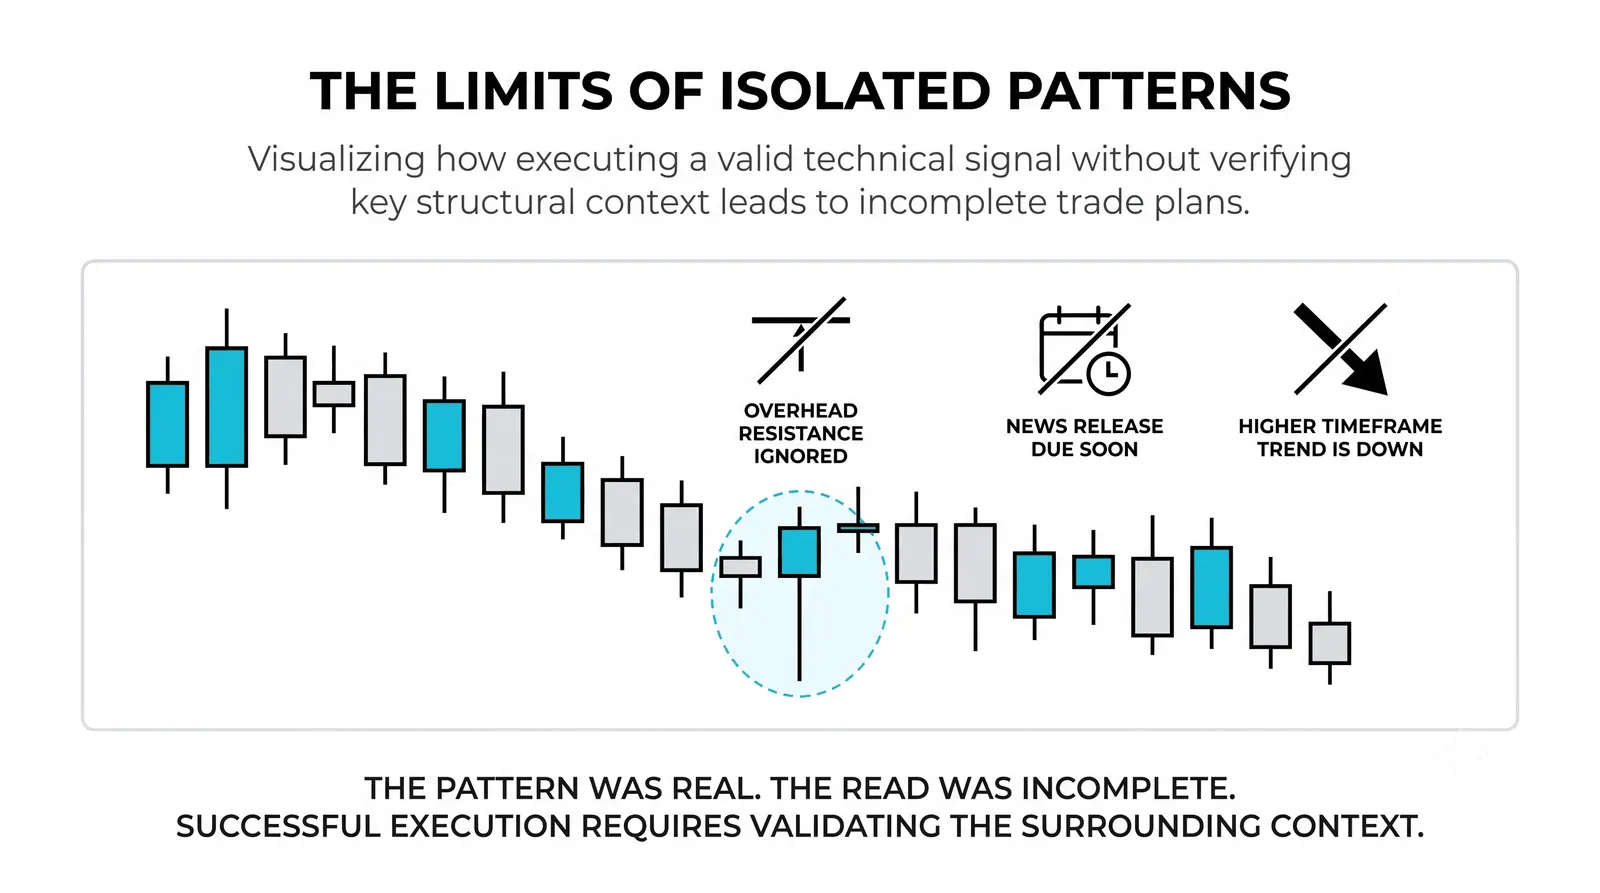
Skipping context does not always lose money immediately. That is what makes it dangerous. You win a few context-free trades, build confidence, then hand it all back in one bad week.
The three classic costs:
- False breakouts. You buy the break above 100 after a vertical run, and price collapses back into the range within days. The breakout was real. The context said it was late.
- Selling strength into a trend. You short a "bearish" candle on the hourly chart while the daily chart is in a clean uptrend. You are stepping in front of the larger move for a scalp-sized reason.
- Buying exhaustion. You enter on a strong green candle after price has already run 40 percent. You are not buying strength. You are buying the exit liquidity for someone earlier than you.
Every one of these trades looked fine on the signal alone. All of them were avoidable with sixty seconds of zooming out.
Questions About Context
How much context is enough?
Enough means you can answer three questions before entering: what is the bigger timeframe doing, where is price relative to obvious levels, and what happened right before this signal. If you can answer those in plain words, you have enough. If you find yourself adding more indicators instead, you are stalling, not adding context.
Which timeframe counts as context?
The timeframe one or two steps above your trading chart counts as context. If you trade the 15-minute chart, the hourly and daily are your context. If you trade the daily, the weekly is your context. Going higher than that adds little for most trades.
Does context matter in fundamental analysis too?
Yes, context matters just as much in fundamental analysis. A strong earnings report means one thing when the stock is cheap and ignored, and another when it is expensive and crowded. The number is the signal. Valuation, expectations, and positioning are the context.
How do I train context reading?
Train it by reviewing old charts with the right side covered. Scroll back, hide the future, and describe the trend, the location, and the recent behavior out loud before revealing what happened next. Do this for twenty charts a week and your eye for context will improve faster than any indicator will take you.
Next, practice the zoom-out habit on your own watchlist: for each chart, write one sentence on the bigger timeframe trend and one on location before you look at any entry signal. Once that feels automatic, study how support and resistance levels form, because levels are the backbone of location.