Earnings Reports Explained
An earnings report is a public company's official quarterly scorecard, released four times a year, stating how much money it made and lost. Every listed company must publish one, and the market treats each release as a scheduled test. Prices often move more in the minutes around a report than in entire quiet weeks. If you trade stocks at all, you need to understand what these reports contain and why the reaction matters more than the numbers themselves. Where this fits in the bigger picture of the stock market is worth a minute before the details.

What an Earnings Report Actually Contains
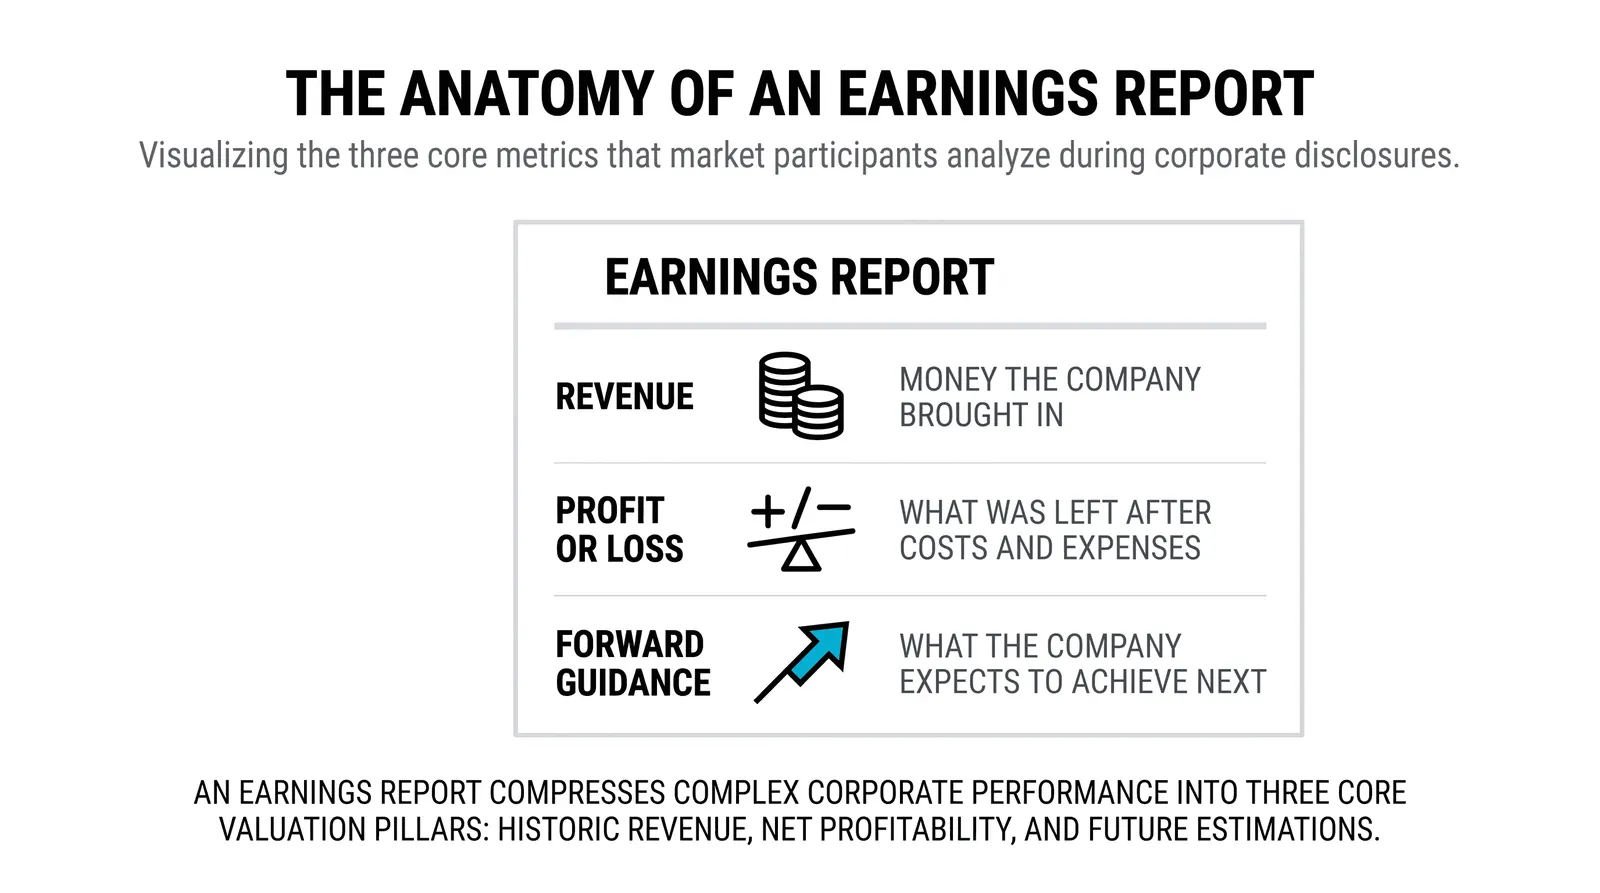
Reports are long documents, but traders focus on three numbers. You can ignore the rest at first.
Revenue is the total money the company brought in during the quarter. It shows whether the business is growing, shrinking, or flat. Revenue alone says nothing about profitability, but a shrinking top line is hard to spin.
Earnings per share (EPS) is the profit divided by the number of shares. This is the headline number. When people say a company "beat earnings," they almost always mean EPS came in above what analysts predicted.
Guidance is management's own forecast for the next quarter or year. This one surprises beginners. The market often cares more about what the company says is coming than about what just happened. A strong quarter paired with weak guidance can sink a stock.
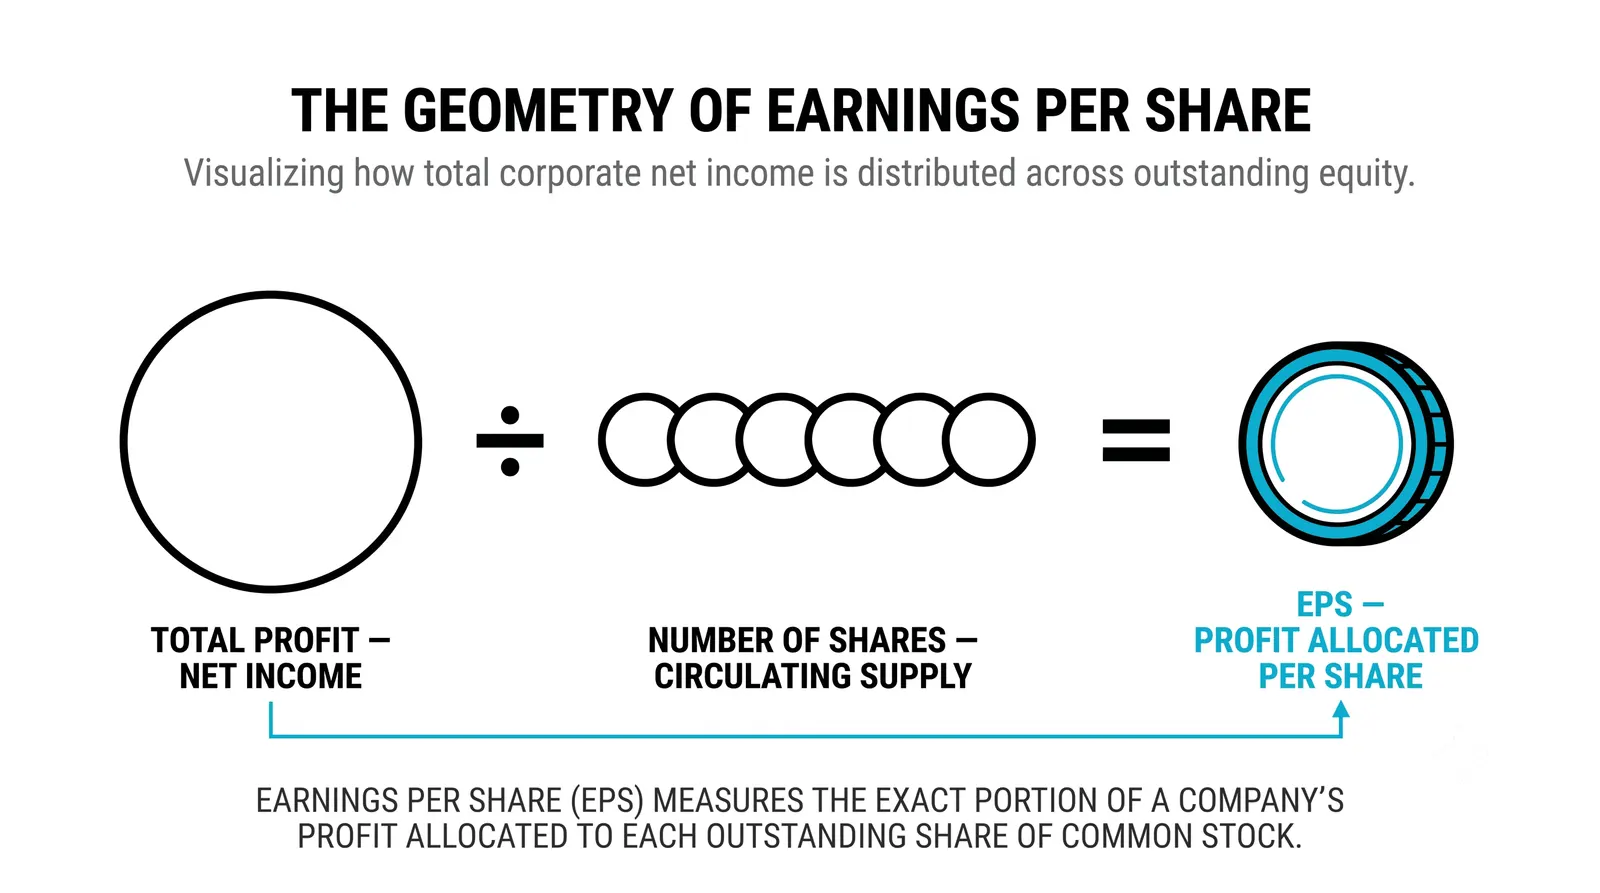
Think of the report like a school report card: revenue is attendance, EPS is the grade, and guidance is the teacher's note about next term. Parents react to the note as much as the grade.
The Report vs. the Expectation
Most beginners miss this step. The market does not react to the numbers. It reacts to the gap between the numbers and what was expected, which is the bridge between reports and fundamental analysis.
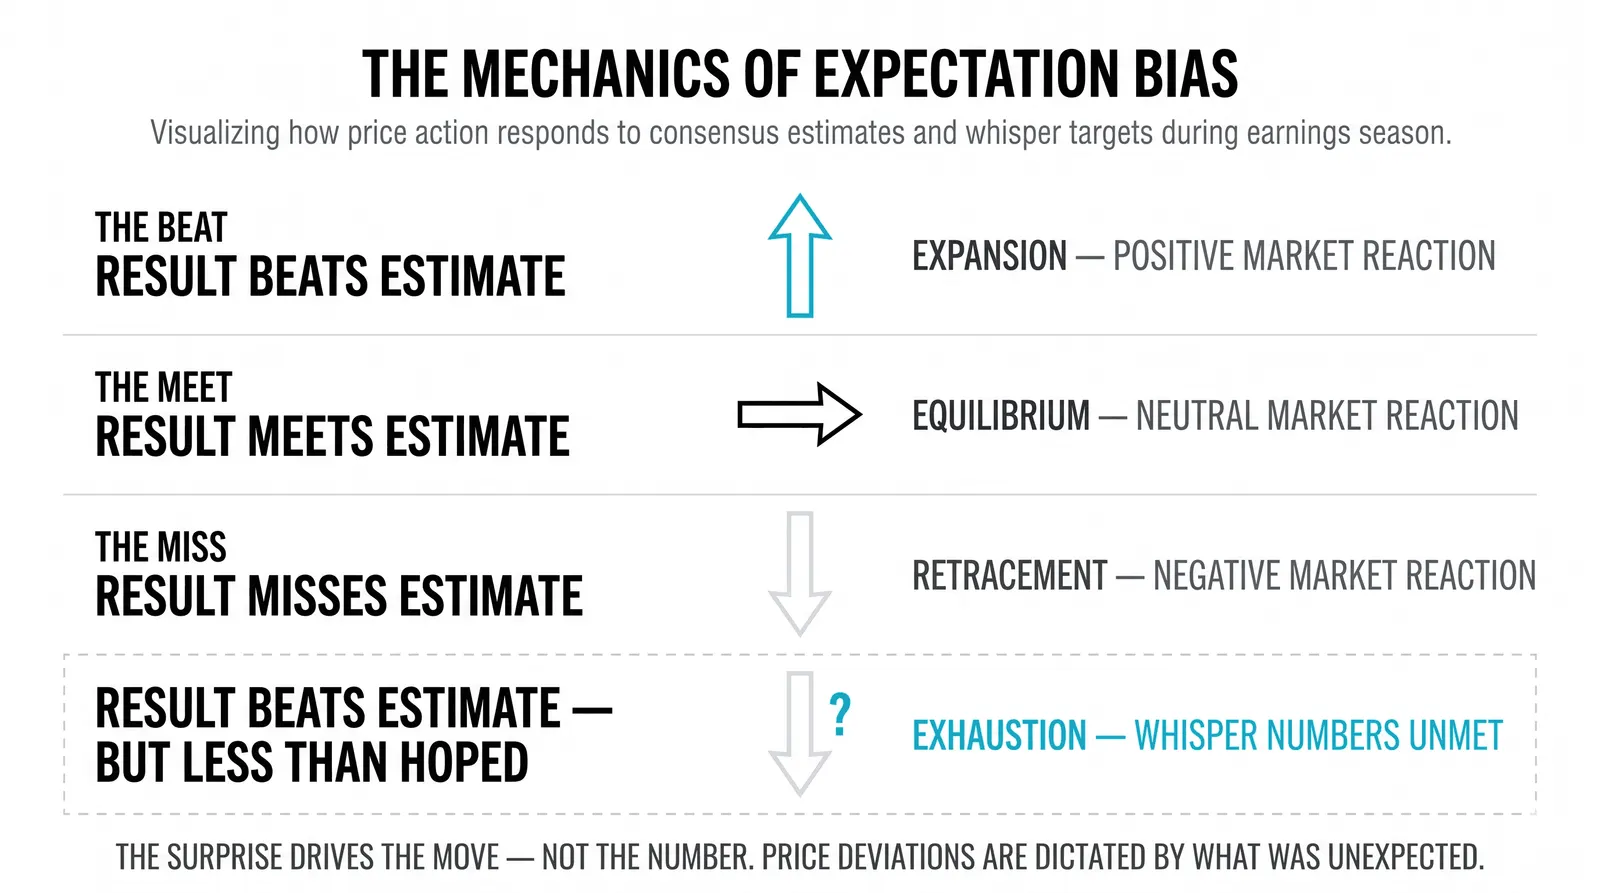
Before every report, analysts publish estimates. Traders position themselves around those estimates for weeks. By the time the report drops, the expected number is already baked into the price. The report itself only adds new information where it differs from the consensus.
That is why a company can post record profits and watch its stock fall. The profits were good, but not as good as the crowd had priced in.
A Worked Example With Round Numbers
Imagine a hypothetical company, call it Company A, trading at $50 per share. Analysts expect EPS of $1.00 for the quarter.
The report comes out: EPS of $1.20. A 20% beat. You might assume the stock jumps. But suppose large funds had quietly positioned for $1.30 based on strong industry data. Against that private expectation, $1.20 is a disappointment. The stock gaps down to $47 at the open.
Now flip it. Same company, same $1.00 estimate, but the company reports $0.95, a miss. However, management raises guidance sharply for the next two quarters. The stock dips for five minutes, then rallies 6% as traders reprice the future.
Neither outcome is strange. Both happen every earnings season. The lesson: you cannot predict the reaction from the headline number alone.
Why the Reaction Is the Part Traders Watch
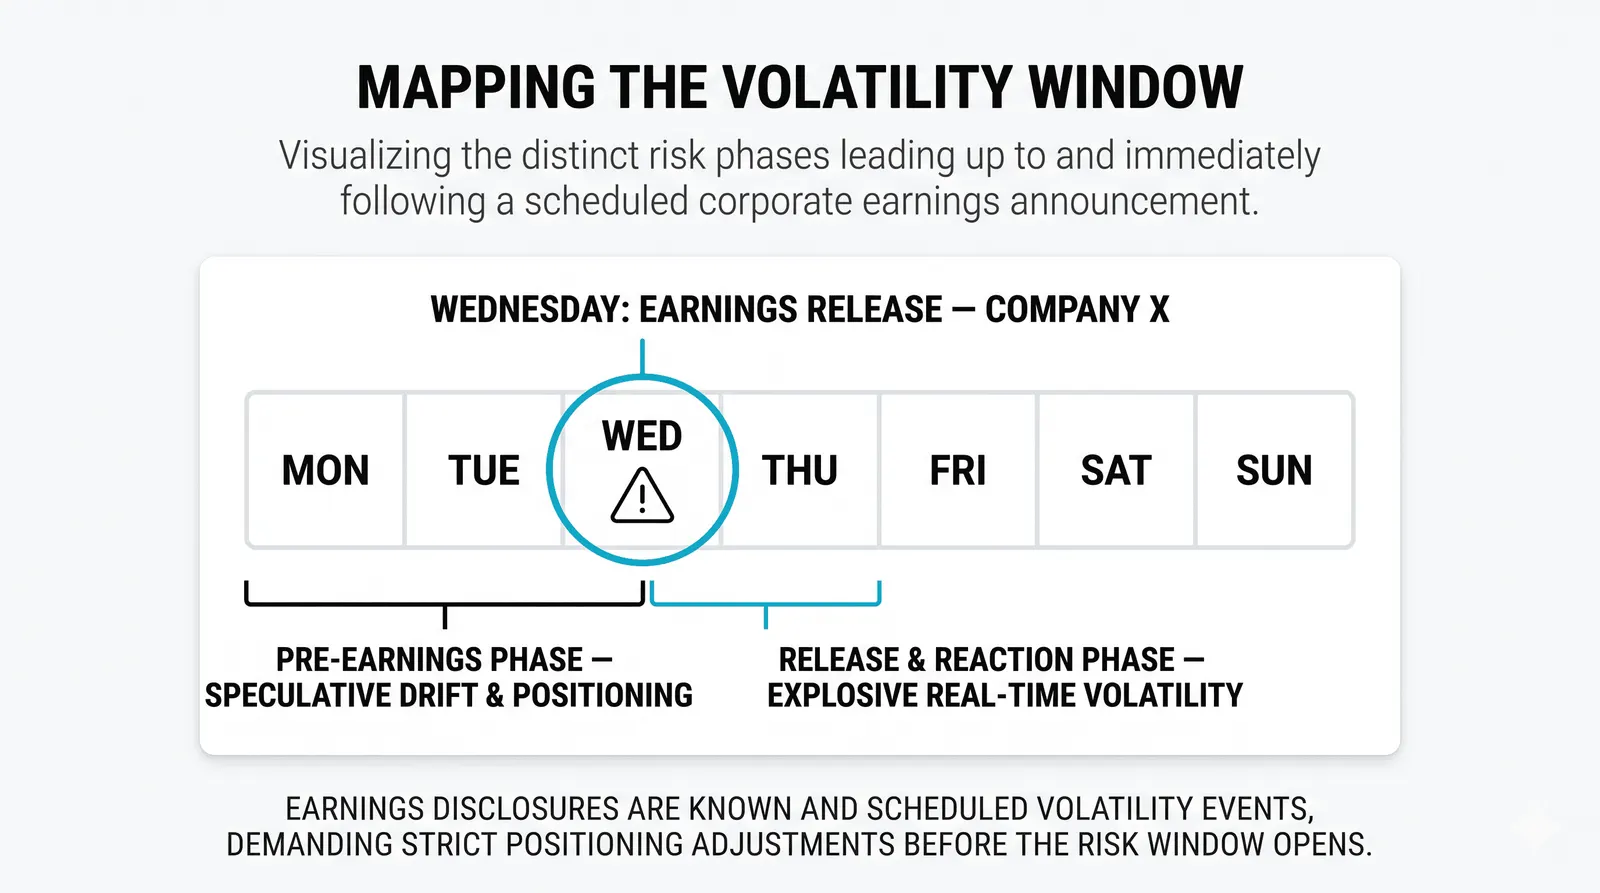
Earnings releases are the most chaotic scheduled events in the stock market. Expect speed, not order.
- Gaps. Most reports drop before the open or after the close. The stock opens far from its last price, and stop losses placed in the gap fill at terrible levels.
- Fast moves. In the first minutes, price can swing several percent in both directions as algorithms digest the numbers and humans digest the guidance.
- Options noise. Implied volatility inflates before the report and collapses right after. Option buyers can pick the correct direction and still lose money.
- Fake moves. The initial spike often reverses once the conference call starts and management answers questions.
Beginners should treat earnings windows as hazardous conditions. Spreads widen, slippage grows, and your usual setups stop behaving. The pattern repeats every earnings season. Many experienced traders simply stand aside for the first 15 to 30 minutes, or avoid holding through reports entirely.
There is no rule that says you must trade the event. Watching a few reports live, without money at risk, teaches you more than any article.
Beat, Meet, or Miss: Typical First Reactions
The table below shows the textbook pattern. Memorize the caveat, not the pattern: direction still surprises constantly, because expectations and guidance can override the headline result.
| Result vs. Estimate | Meaning | Typical Immediate Reaction |
|---|---|---|
| Beat | EPS above analyst consensus | Price gaps up or rallies, unless expectations were even higher or guidance disappoints |
| Meet | EPS roughly in line with consensus | Muted move; guidance and the conference call decide direction |
| Miss | EPS below analyst consensus | Price gaps down or sells off, unless guidance or a one-time factor softens the blow |
Notice how every row contains an escape hatch. That is the honest picture. The table describes tendencies, not rules, and trading earnings as if they were rules is how accounts shrink.
Questions About Earnings Reports
When do earnings reports come out?
Most companies report within a few weeks after each quarter ends, so the busiest windows are roughly mid-January, mid-April, mid-July, and mid-October. Each company announces its exact date in advance, and any broker platform or financial calendar will show it. Reports land either before the market opens or after it closes, rarely during regular hours.
Do I have to trade earnings?
No. Nothing requires you to hold or trade through a report, and many consistent traders deliberately avoid it. If you hold a position into a report, accept that you are exposed to a gap you cannot control. Reducing size or closing before the print is a legitimate decision, not a missed opportunity.
What is guidance?
Guidance is the company's own forecast of future revenue or profit, usually for the next quarter or full year. Management gives it during the report or the follow-up call. Because stock prices reflect the future, a guidance change often moves the stock more than the quarter's actual results.
Why does a stock fall on good news?
Because the good news was already expected, or something else in the report was bad. If the market priced in a bigger beat, a merely good result is a disappointment. Weak guidance, shrinking margins, or cautious comments on the call can also outweigh a strong headline number. Price reacts to the full picture relative to expectations, never to one number in isolation.
Next, pull up the last four reports for one stock you follow and compare the EPS estimate, the actual result, and the opening move the next day. That small exercise will teach you the gap between numbers and reactions faster than any definition, and it shows you the gap between numbers and reactions, which no definition can teach.