What Is Technical Analysis
Technical analysis is the study of past price and volume to judge what is likely to happen next, in probabilities rather than certainties. It does not predict the future. It organizes the past into a set of if/then statements about the future. That distinction matters more than any indicator you will ever learn.
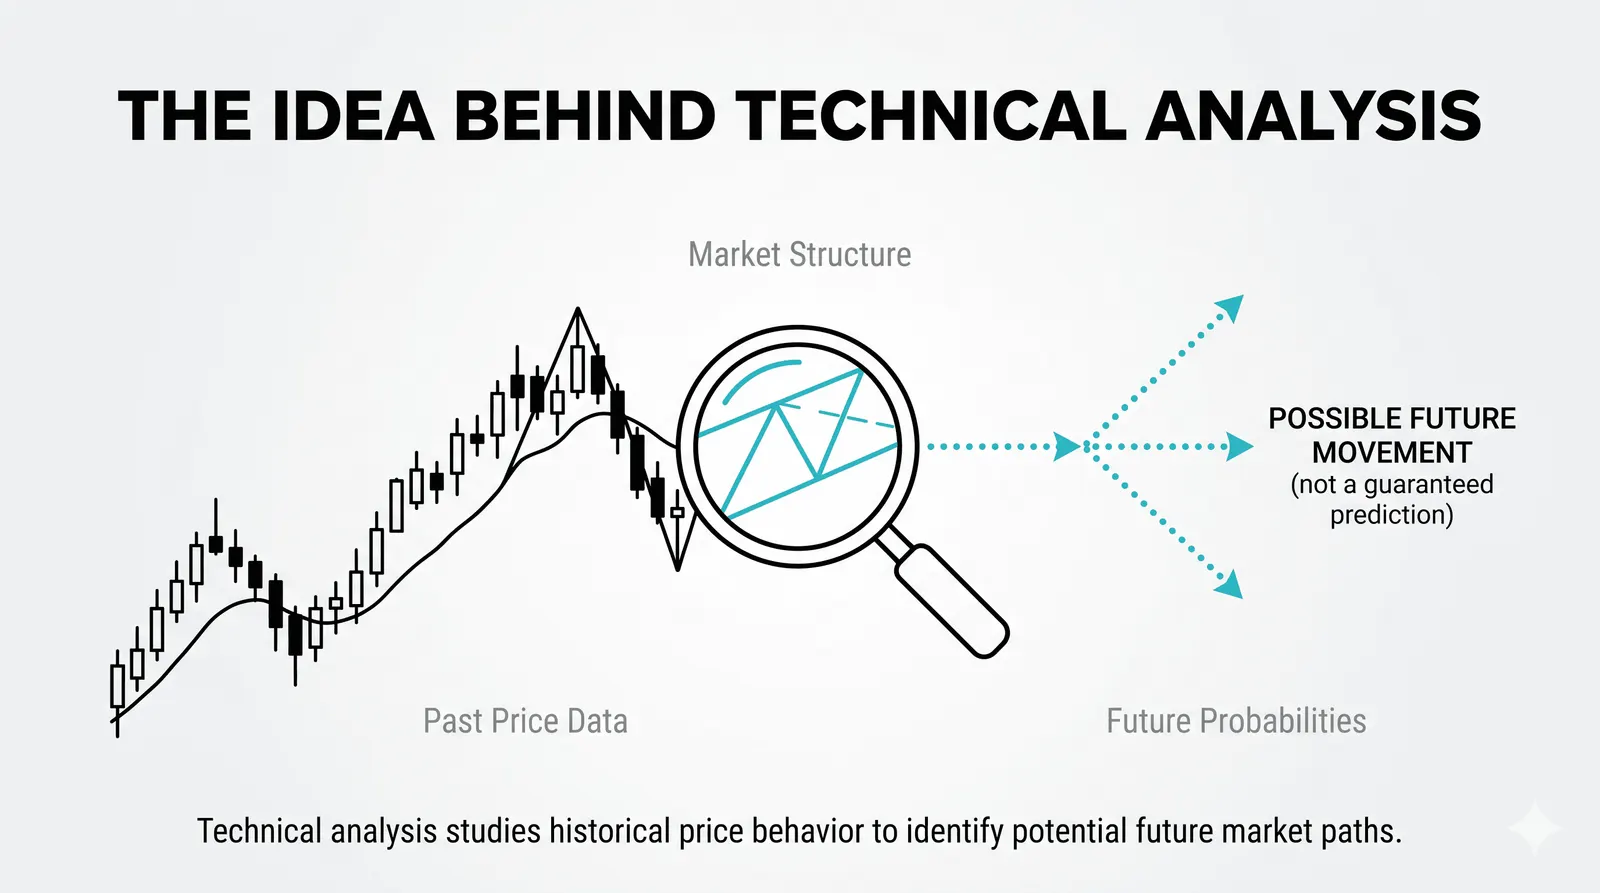
Think of it like reading a poker table. You cannot see the other players' cards, but their bets, pauses, and patterns tell you something about the odds. Price and volume are the market's bets. Technical analysis is the skill of reading them.
The One Assumption Behind Everything
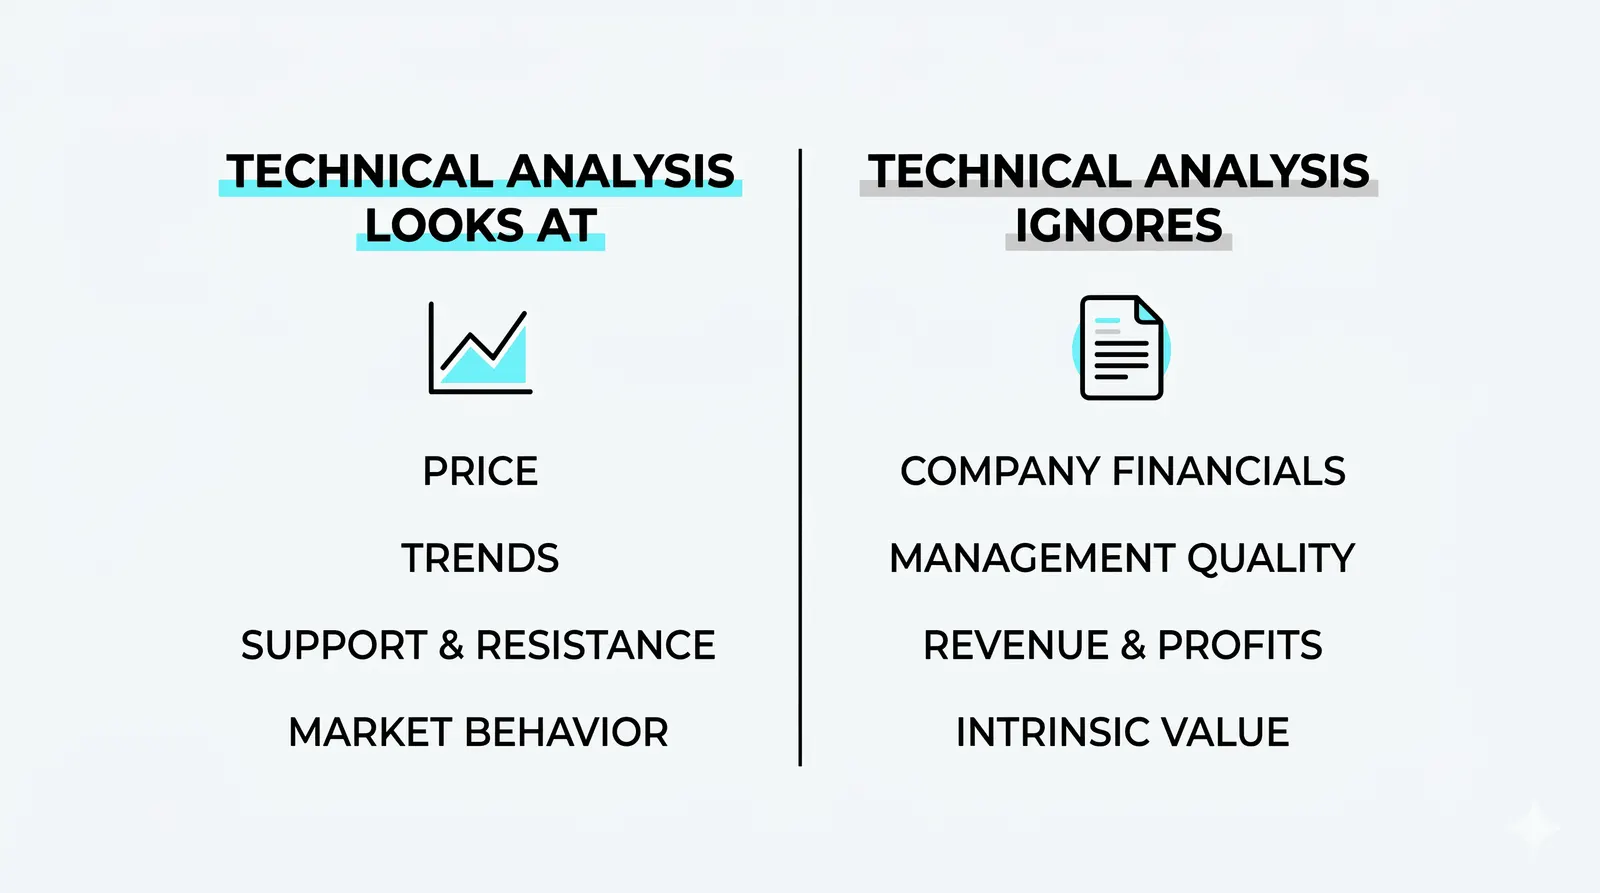
All technical analysis rests on a single idea: everything known about a market is already reflected in its price and volume. Earnings, news, fear, insider knowledge, macro data. If it matters, someone has already acted on it, and that action shows up on the chart.
This is why technicians often ignore the news itself. They are not saying news does not matter. They are saying the market's reaction to news matters more than the news. A great earnings report that fails to lift a stock tells you more than the report does.
You do not have to fully believe this assumption to use the tools. You only need to accept that price and volume contain real information about supply, demand, and crowd behavior. That much is hard to dispute.
The Toolbox, Family by Family
New traders often drown in indicators because they treat the toolbox as a pile. It is actually a few families, each answering a different question.
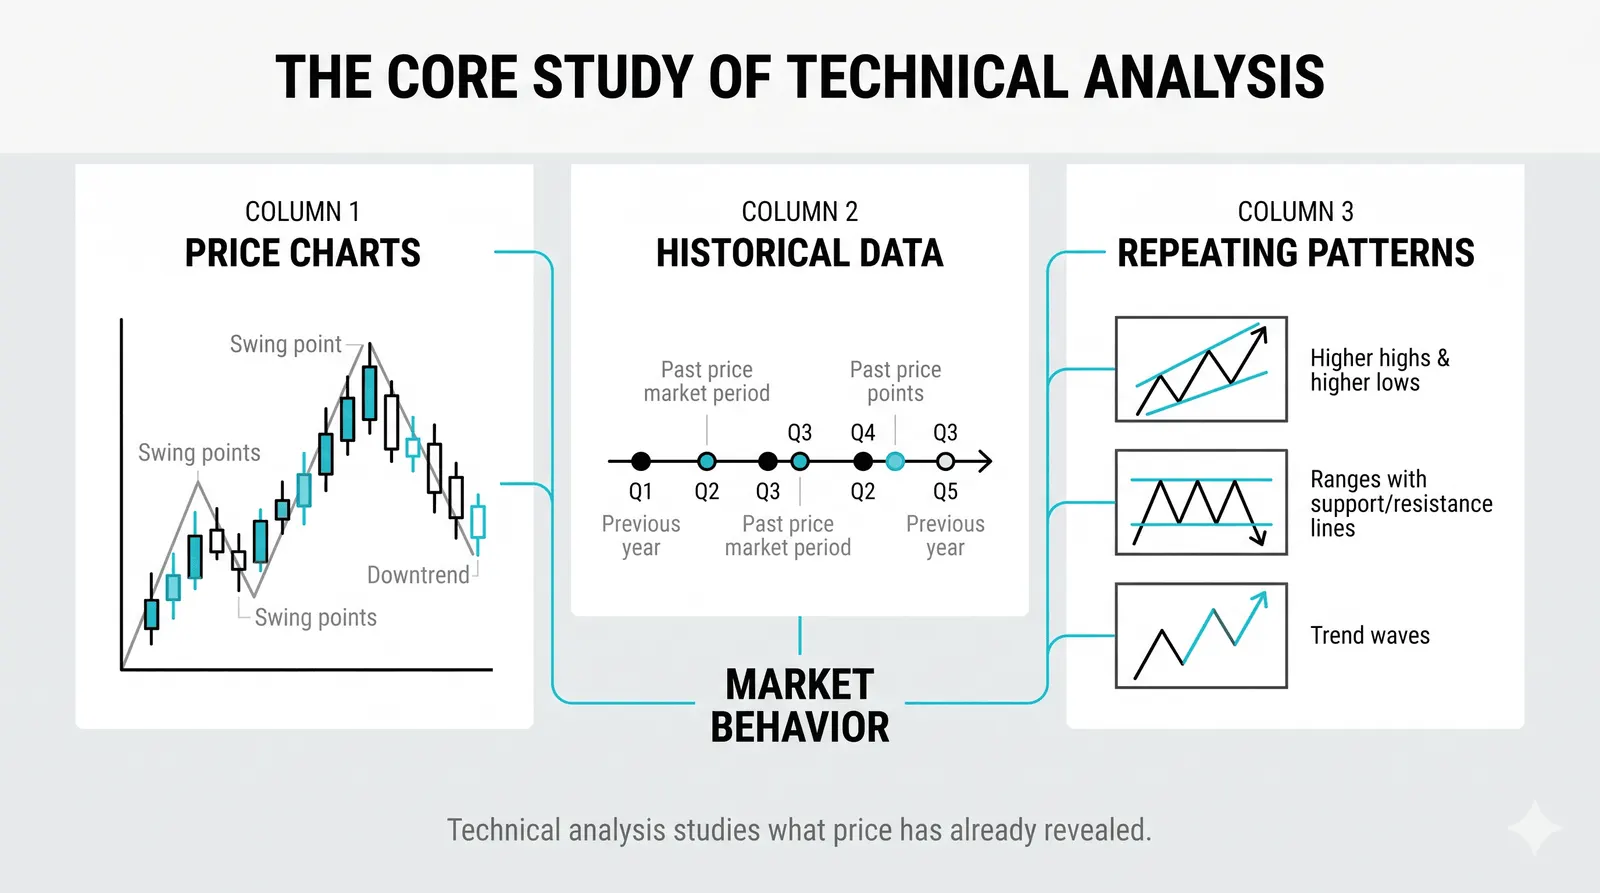
- Charts and structure. Candlesticks, bar charts, swing highs and lows. This is the raw material. Structure answers: is the market trending, ranging, or turning?
- Levels. Support, resistance, prior highs and lows, round numbers. Levels answer: where is price likely to meet buying or selling interest?
- Patterns. Triangles, flags, head and shoulders, double tops. Patterns answer: how is the crowd positioned, and where is the tension building?
- Indicators. Moving averages, RSI, MACD, and hundreds more. Indicators answer: what does a smoothed or transformed view of price show that raw price hides?
- Volume. How many shares or contracts changed hands, and when. Volume answers: how much conviction sits behind a move?
Most blown accounts come from stacking five indicators that all measure the same thing. Pick one tool per family. Learn it deeply before adding another. The chart family alone has several flavors; chart types covers the main ones.
What a Technical Read Actually Looks Like
Here is a worked example with round numbers. A stock trades near 100. That level has held twice in the past three months: price dropped to 100, buyers stepped in, and it bounced both times.
Now price drifts down toward 100 again. But this time the pullbacks are getting smaller, and each bounce off 100 is weaker than the last. Volume on the bounces is shrinking. The steps down are getting shorter, like a ball losing energy.
A beginner says: "100 is support, it will hold." A technician says something different:
- If price reaches 100 and buyers show up with strong volume, the level likely holds a third time, and a long trade with a stop below 100 has a clear logic.
- If price slices through 100 on heavy volume, the level has failed, and the next area of interest might be 92, the prior swing low.
- If price chops around 100 with no volume, there is no trade. Waiting is a position too.
Notice the framing. If/then, never will/won't. The technician is not forecasting. They are pre-planning responses to a small set of scenarios, each with a defined risk. One paragraph, and the craft's core is on the table.
Technical vs Fundamental Analysis
These two approaches get argued about like rival religions, but they simply answer different questions. Fundamental analysis asks what something is worth. Technical analysis asks what people are doing about it right now.
| Technical Analysis | Fundamental Analysis | |
|---|---|---|
| Core question | What is price likely to do next? | What is this asset actually worth? |
| Inputs | Price, volume, market structure | Earnings, cash flow, industry, economy |
| Typical horizon | Minutes to months | Months to decades |
| Typical user | Traders, short-term speculators | Investors, analysts, allocators |
| Main weakness | Patterns fail; past behavior is not law | Cheap can stay cheap for years |
Plenty of professionals use both. Fundamentals to decide what to own, technicals to decide when to buy it. The two are complements, not enemies. See what fundamental analysis is for the other side of the table, and why combining both gives an edge.
Where It Breaks: Honest Failure Modes
Breakouts fail constantly. A price pushes above resistance, triggers a wave of buy orders, then reverses and traps everyone who chased it. This happens so often it has a name: the false breakout. Any method built on breakouts must assume a large share of them will fail.
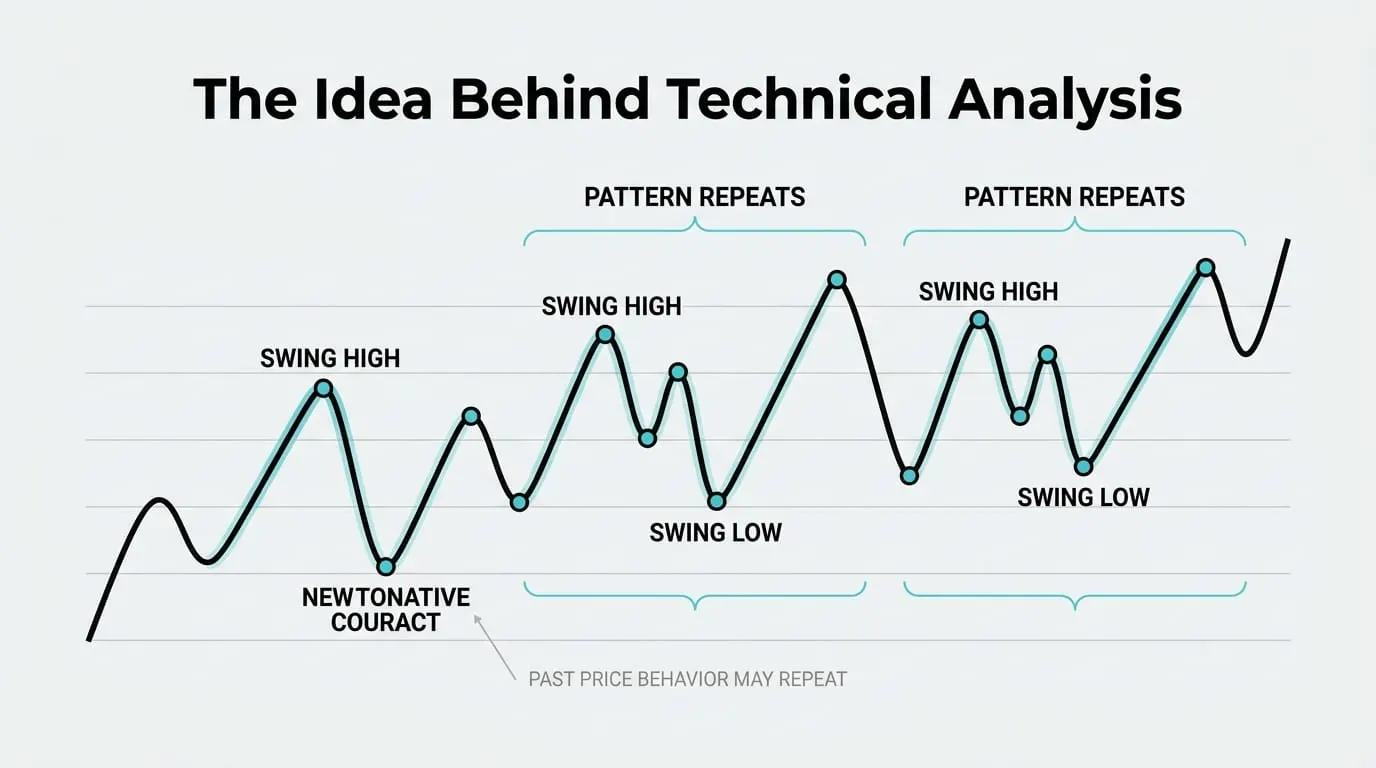
Patterns are tendencies, not laws. A head and shoulders does not cause a decline. It describes a crowd that is gradually losing conviction, and sometimes that crowd regains it. Treat every pattern as a slight tilt in the odds, nothing more.
Indicators lag by construction. A moving average crossover tells you what already happened, smoothed. It can keep you on the right side of a trend, but it will never get you in at the turn.
And there is a deeper problem: once enough people watch the same levels, the levels change behavior. Support at 100 works partly because everyone sees it. When everyone sees it, some traders front-run it, and others hunt the stops below it. The tool reshapes the thing it measures.
None of this makes technical analysis useless. It makes it a probabilistic discipline. Your edge, if you have one, comes from risk management and consistency, not from finding a pattern that always works. No such pattern exists.
Questions About Technical Analysis
Is technical analysis scientific?
Not in the laboratory sense. It is closer to statistical habit-reading: certain price behaviors have recurred often enough to carry a small, measurable edge in some markets. The honest way to use it is to treat levels and patterns as odds, not laws. Anyone claiming a setup works 90% of the time is selling something.
Can technical analysis be fully automated?
Parts of it can. Scanning for patterns, measuring volume, and executing at defined levels are all programmable, and quantitative funds do exactly this. The hard part to automate is judgment: knowing when a level matters, when market context has changed, and when a textbook pattern should be ignored. That judgment is where human traders still earn their keep.
Do I need technical analysis if I only invest long term?
You need less of it, but not none. Even a buy-and-hold investor benefits from reading basic structure, because entries and add-points still affect returns. Buying a great company at a stretched price after a vertical run is a technical mistake, even if the fundamental thesis is right.
Which should I learn first, technical or fundamental?
Neither comes first, because they answer different questions. If you plan to trade actively, start with technical analysis, since timing and risk definition are your daily problems. If you plan to invest for years, start with fundamentals and add basic chart reading later. Match the tool to the question you are actually asking.
Next, pick one market and one timeframe, mark the obvious support and resistance levels on its chart each week, and track how price behaves at them for a month. That journal is the foundation for the next topic: support and resistance in depth.