How to Draw Fibonacci Retracement Correctly
Most traders who draw fibonacci retracement get the tool onto the chart in seconds and get it wrong in the same seconds. To draw a fibonacci retracement correctly, confirm the completed swing with the marking rules, anchor the tool from the swing low to the swing high in an uptrend, verify the lines against the structure the chart already shows, and only then treat those lines as prices worth watching.

The procedure matters more than the tool. Fibonacci retracement is the order of operations in arithmetic: doing the steps out of sequence still produces an answer, just not the correct one. An unconfirmed swing, a reversed anchor, or lines that float in empty space all produce numbers on the screen, and every one of those numbers is noise dressed as measurement.
The setup lesson covered the tool's anchors, frames, and ratio set in general. This lesson walks the retracement's own drawing procedure end to end, because the retracement is the tool most traders reach for first and most often draw wrong.
The Procedure, In Order
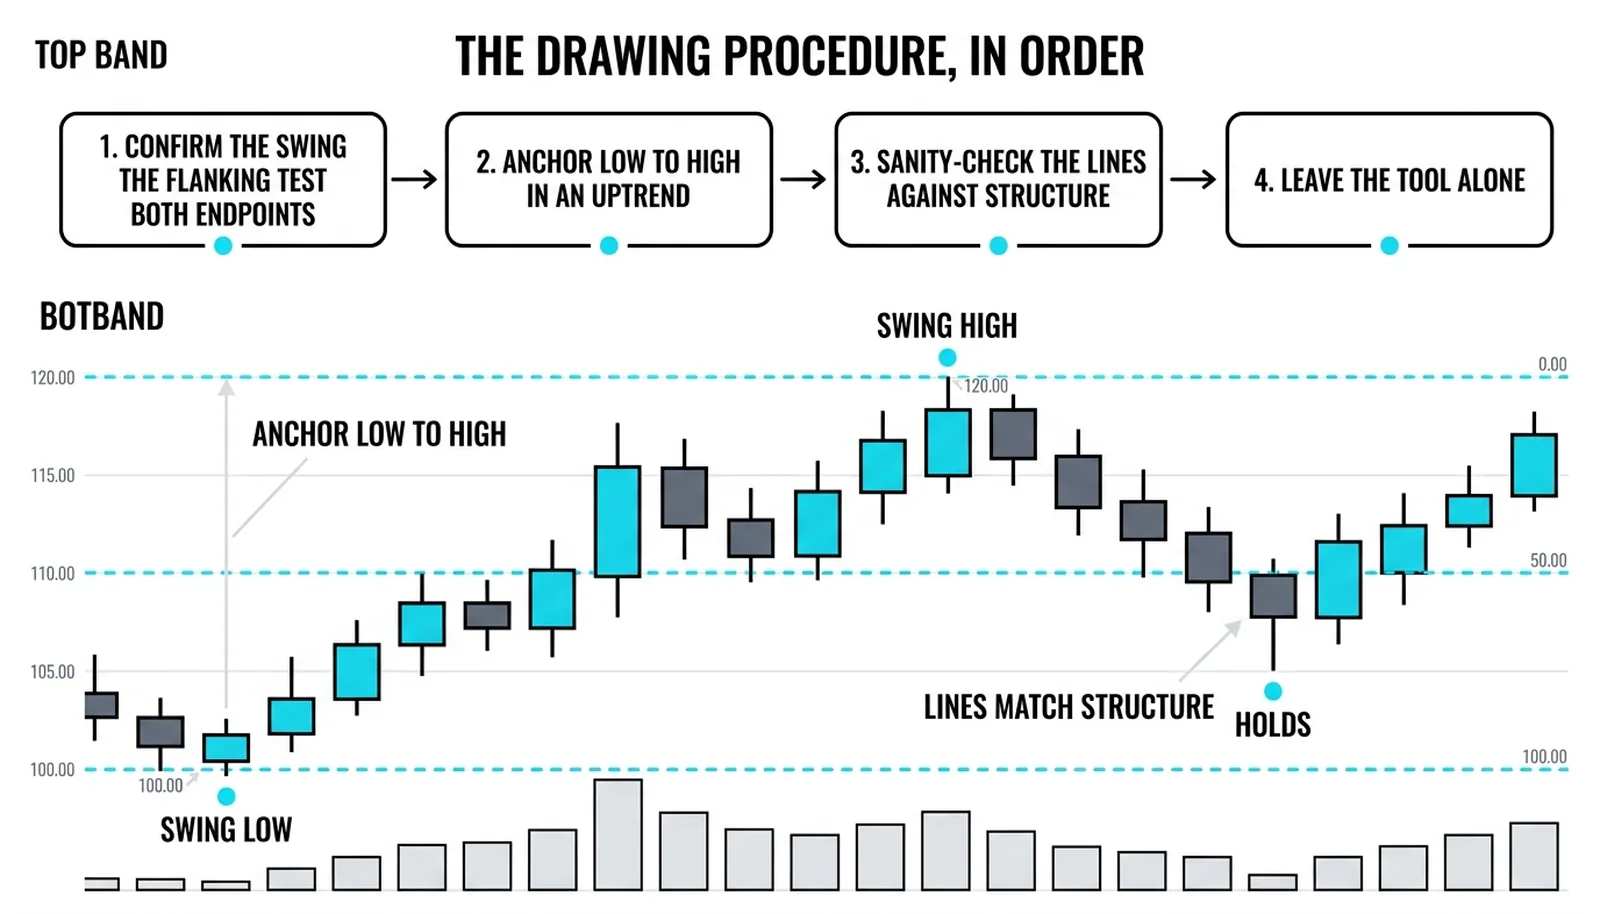
Step one: confirm the swing. The swing must be complete per the flanking test, with both endpoints marked, before the tool comes out. A retracement drawn from an extreme that is still forming will redraw itself as the extreme moves, and every line you trusted shifts under you. A tool drawn from an unconfirmed extreme redraws itself in regret.
Step two: anchor the direction. In an uptrend, the retracement runs from the swing low to the swing high, so the lines project below the high where the pullback will actually travel. In a downtrend, it runs from the swing high to the swing low. Reversing the convention measures the wrong leg or nothing at all. The direction convention is the difference between measuring the pullback and measuring nothing.
Step three: run the sanity check. The lines must land where structure agrees. The 50 percent line near a round number, a level overlapping prior congestion, the golden area sitting on a prior swing point: these are confirmations that the swing you picked is the swing the market is watching. A tool whose lines float in featureless space is anchored on the wrong swing, no matter how official the anchor points looked.
Step four: leave it alone. A retracement drawn on a confirmed swing measures a completed leg. That measurement does not change because the next few bars wiggled. Re-anchoring on every minor fluctuation turns a fixed measurement into a moving opinion. The map becomes a mood ring.
The Sanity Check That Separates Correct From Lucky
Anyone can anchor two points and produce lines. The check is what makes the output meaningful.
Start with round numbers. Markets respect round numbers because orders cluster there for reasons that have nothing to do with Fibonacci. When a retracement line lands within a few ticks of a round number, two independent reasons to watch that price now overlap. That overlap is the signal.
Then check congestion. Prior sideways trading left behind zones where many participants transacted. A retracement line that cuts through an old congestion shelf is measuring a pullback into a price where the market already showed interest. That is a level with two separate confirmations.
Then check prior swings. A golden-area line that overlaps an earlier swing high or low means the correction is retracing into a price the market already treated as significant. Three independent reasons, one price. That is the line that deserves attention.
Now invert it. When none of the lines coincide with anything on the chart, the drawing is telling you something: the swing you measured is not the swing other participants are measuring. The fault is not in the ratio set. The fault is in the anchor choice, and the correct response is to find the swing the structure actually respects.
Drawing Is the Question, Reaction Is the Answer
The cluster method's working habit frames the whole procedure: the retracement is drawn to find where the correction should end, the drawing is the question, and the reaction at the lines is the answer. The lines propose prices. Price itself confirms or rejects the proposal.
This framing buys patience. A trader who treats the drawing as the answer enters at the first line touched. A trader who treats the drawing as the question waits for the stall, the turn, the evidence that buyers or sellers actually showed up at the measured price. The procedure's real product is confidence about which lines deserve attention, not a promise that any of them will hold.
The re-anchoring trap sits at the opposite pole. A trader who keeps moving the anchors to fit each new bar is not measuring anything. Each redraw erases the previous measurement and replaces it with hope. The correct response to a broken level is to accept that the correction went deeper than the measured lines and to look for the next structural reference, not to drag the tool until the lines cover the price again.
One discipline, applied twice: confirm before drawing, and hold after drawing.
The Lines That Landed on Structure
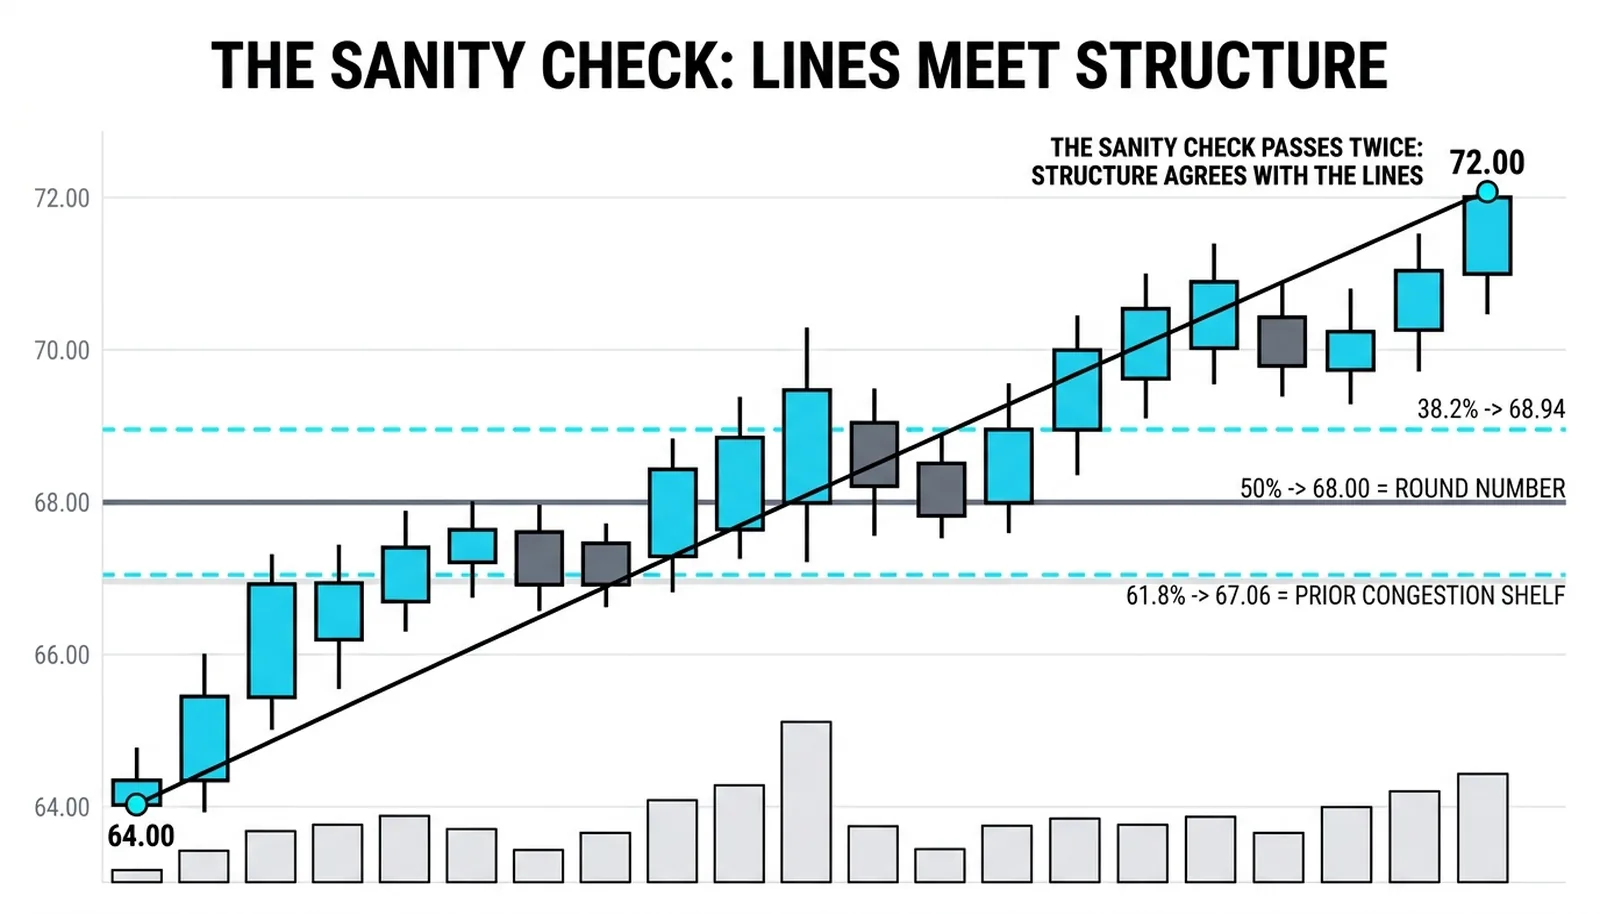
Consider a hypothetical leg of 8.00 points, running from 64.00 to 72.00. Drawn correctly from the swing low to the swing high, the retracement lines sit at 68.94, 68.00, and 67.06.
The sanity check passes twice. The 68.00 line is a round number, and the 67.06 line overlaps a prior congestion shelf where price spent time on the way up. Two of the three lines carry independent structural support.
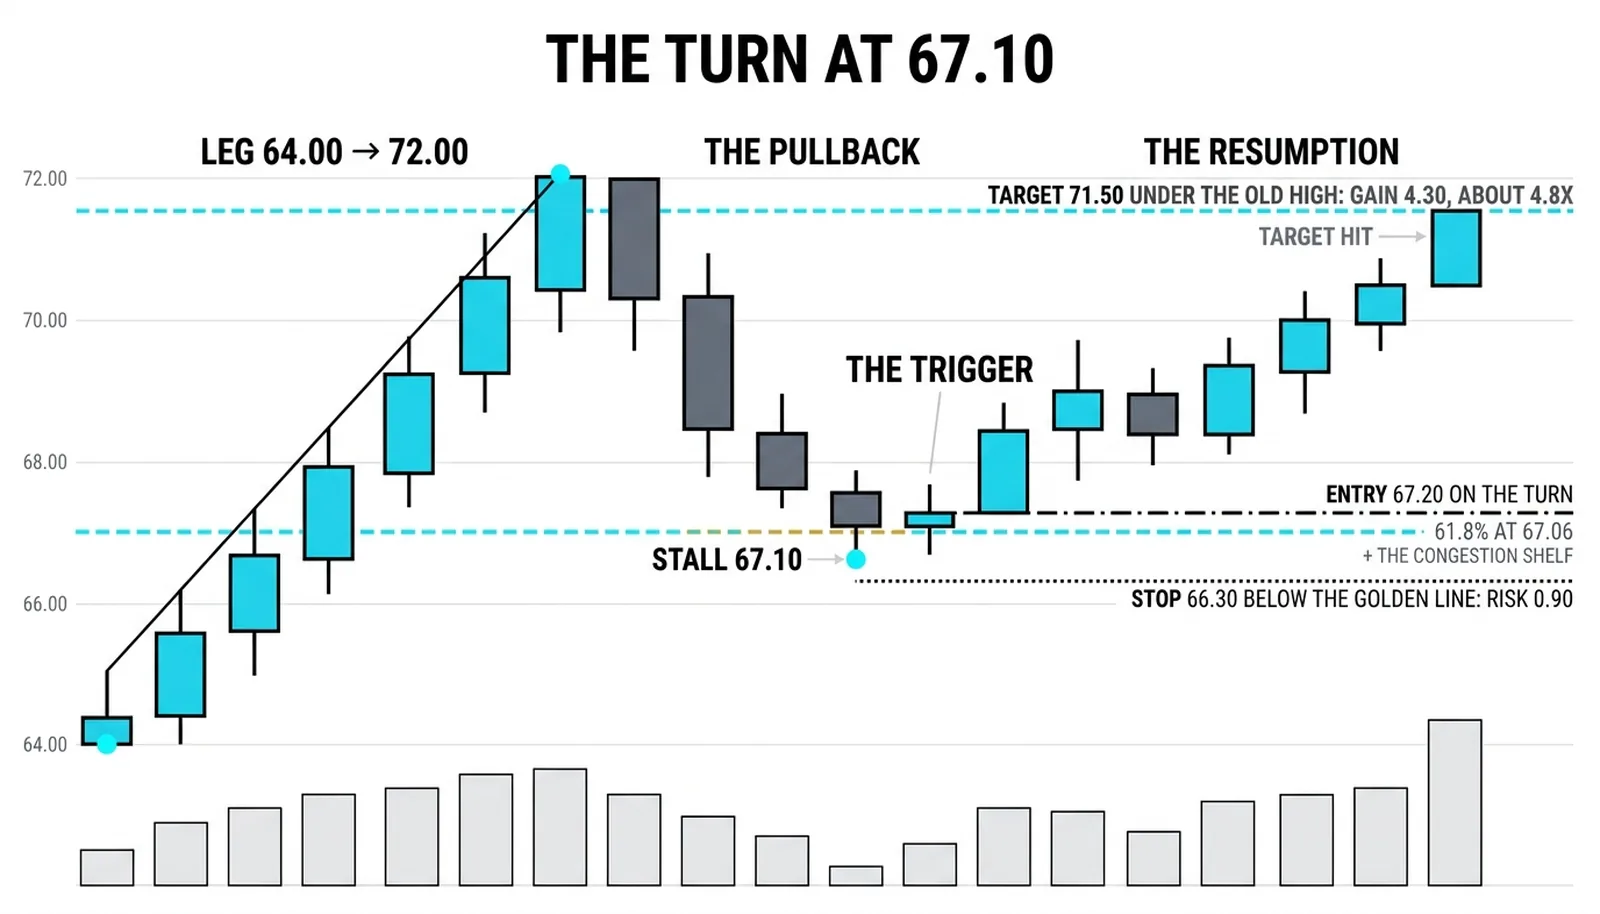
Price pulls back through 68.94 without pausing. It stalls at 67.10, between the 61.8 percent line and the round number, and turns. The long entry is taken at 67.20 on the turn. The stop sits at 66.30, below the golden-area line, a risk of 0.90. The first target is 71.50, just under the old high, a gain of 4.30, roughly 4.8 times the risk.
The drawing contributed location and nothing else. The turn itself still had to happen. A correctly drawn tool on a leg nobody is watching produces nothing.
The failed version ran in parallel. An impatient trader had anchored on a minor internal wiggle instead of the confirmed swing low. That trader's lines sat in empty space, and the pullback sliced through the unanchored line without slowing. The trader watched price blow past the level, lost confidence in the tool, and missed the turn that the correctly drawn levels had framed. Same market, same pullback, same ratios. The only difference was the procedure.
| Step | Action | Check | Failure It Prevents |
|---|---|---|---|
| Confirm the swing | Apply the flanking test and mark both endpoints | The extreme is complete, not still forming | Lines that redraw as the extreme moves |
| Anchor the direction | Low to high in an uptrend, high to low in a downtrend | Lines project into the pullback's path | Measuring the wrong leg or nothing at all |
| Run the sanity check | Compare lines against round numbers, congestion, prior swings | At least one line overlaps existing structure | Trusting lines floating in featureless space |
| Leave it alone | Hold the anchors once the swing is confirmed | The measurement stays fixed across later bars | Re-anchoring until the tool reflects opinion |
Drawing Questions, Answered
How do you draw a fibonacci retracement correctly?
Confirm the completed swing with the flanking test, anchor from swing low to swing high in an uptrend, verify the lines against existing structure, and then leave the drawing alone. Each step exists to prevent a specific failure, and skipping any one of them produces lines that look official and mean nothing.
Do you draw from high to low or low to high?
Match the anchor order to the trend direction: low to high in an uptrend, high to low in a downtrend. The goal is for the retracement lines to project into the path of the coming pullback, and the reversed convention measures the wrong leg.
Which swing should the retracement measure?
Measure the completed leg whose correction you intend to trade, confirmed by the flanking test at both ends. The sanity check tells you whether you picked the swing the market is watching: if the lines coincide with round numbers, congestion, or prior swings, the choice was right.
Why do my retracement lines not line up with anything?
Because the anchors sit on the wrong swing, almost always a minor internal wiggle instead of the dominant leg. When the lines float in featureless space, redraw from the larger confirmed swing rather than trusting the current placement.
Once the drawing procedure is reliable, the next question is what the deeper ratios mean when a correction blows past the golden area entirely, which is where extension levels take over the measurement.