Fibonacci Time Zones
Fibonacci time zones are vertical lines drawn into the future from a swing point at counted intervals of bars: one, two, three, five, eight, thirteen, twenty-one, and onward, and the lines schedule the market's check-in points long before any of them arrive. The tool makes one claim and one claim only: that the market's turning points tend to cluster near bars the sequence counts out in advance. It says nothing about price, nothing about direction, and nothing about how far a turn will travel once it starts. That narrowness is the tool's strength. A trader who knows what a line cannot say reads it without expecting more than a scheduled window.

Think of streetlamps spaced out from the first post at set intervals, every next lamp's position fixed the day the street was laid out, and the walker passes near each one without always standing under it. The schedule exists before the walk begins, and the walk decides what happens at each lamp.
The previous lesson moved the ratios off the price axis and onto the horizontal one, and defined the window as a span of bars where a response is due. This lesson draws the tool itself: the vertical lines, the counted intervals, and the tolerance rule that keeps a near-miss from being scored as a miss.
Vertical Lines on a Count
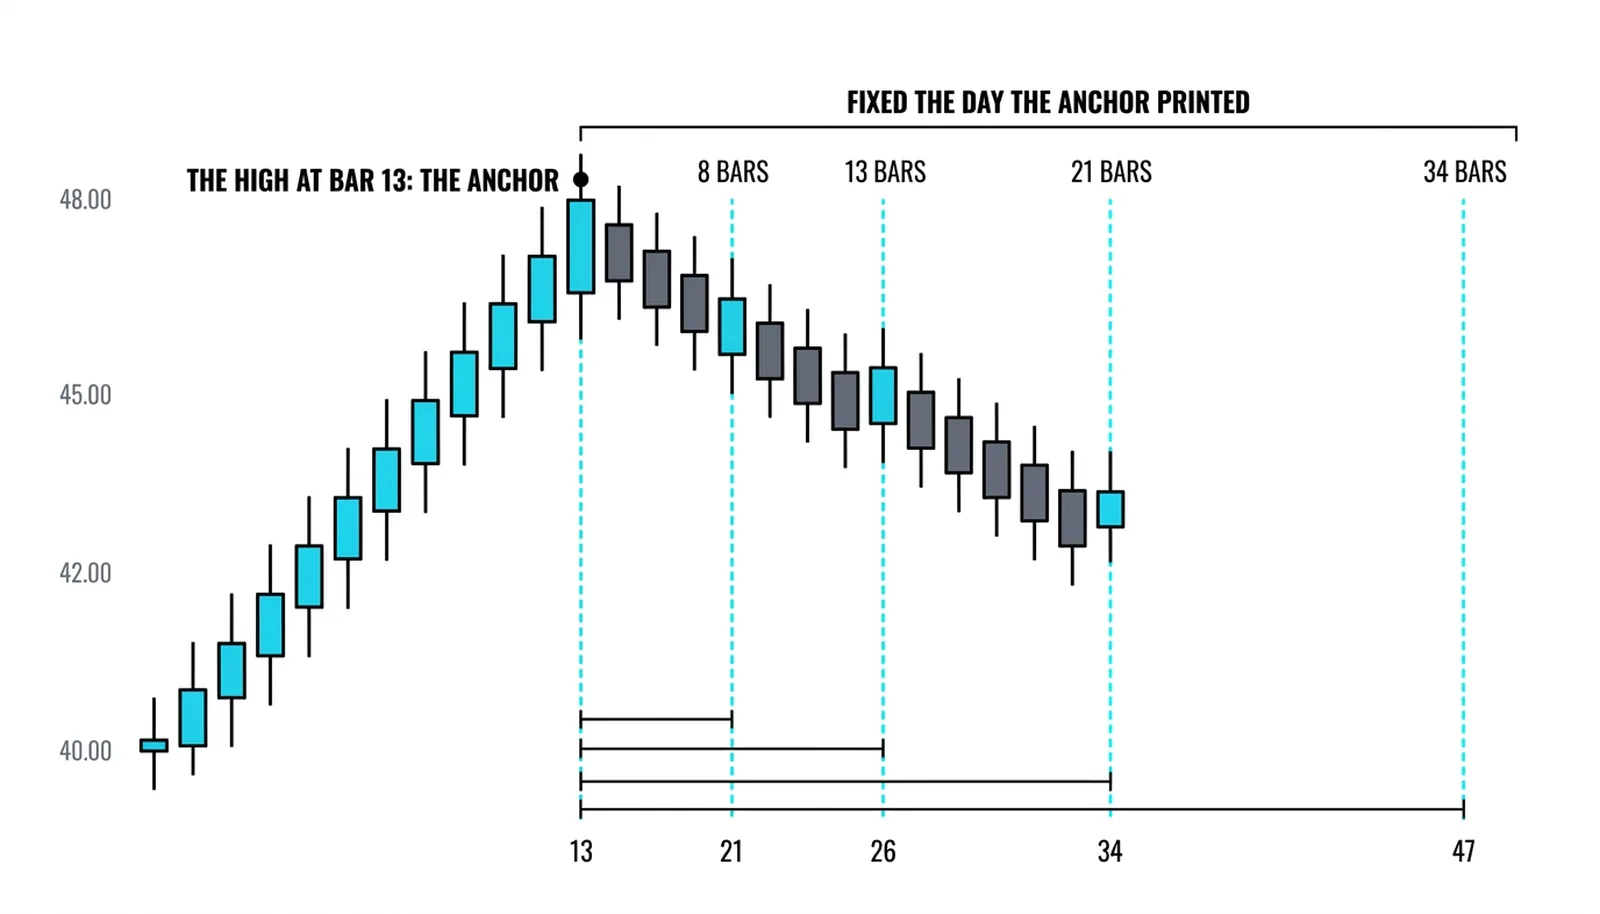
The zones are not retracements of a leg's size. They are the fibonacci count of bars itself, laid out forward from a chosen swing high or low: the first lines one, two, and three bars out, then five, eight, thirteen, twenty-one, and thirty-four as the count compounds. Each line is vertical, a bar on the calendar with no price attached. The intervals widen by construction, so the early lines crowd together and the later ones stand far apart. A chart with the full sequence drawn looks dense on the left and sparse on the right, and that shape is the sequence's mark.
The starting swing matters the way the anchor mattered to the price work. The count begins at a confirmed high or low, a bar the market actually turned on, not an arbitrary candle picked because it sits conveniently. A swing confirmed by lower highs after a top, or higher lows after a bottom, gives the count a real event to count from. A swing chosen carelessly schedules appointments from a day nothing happened, and the lines inherit the error.
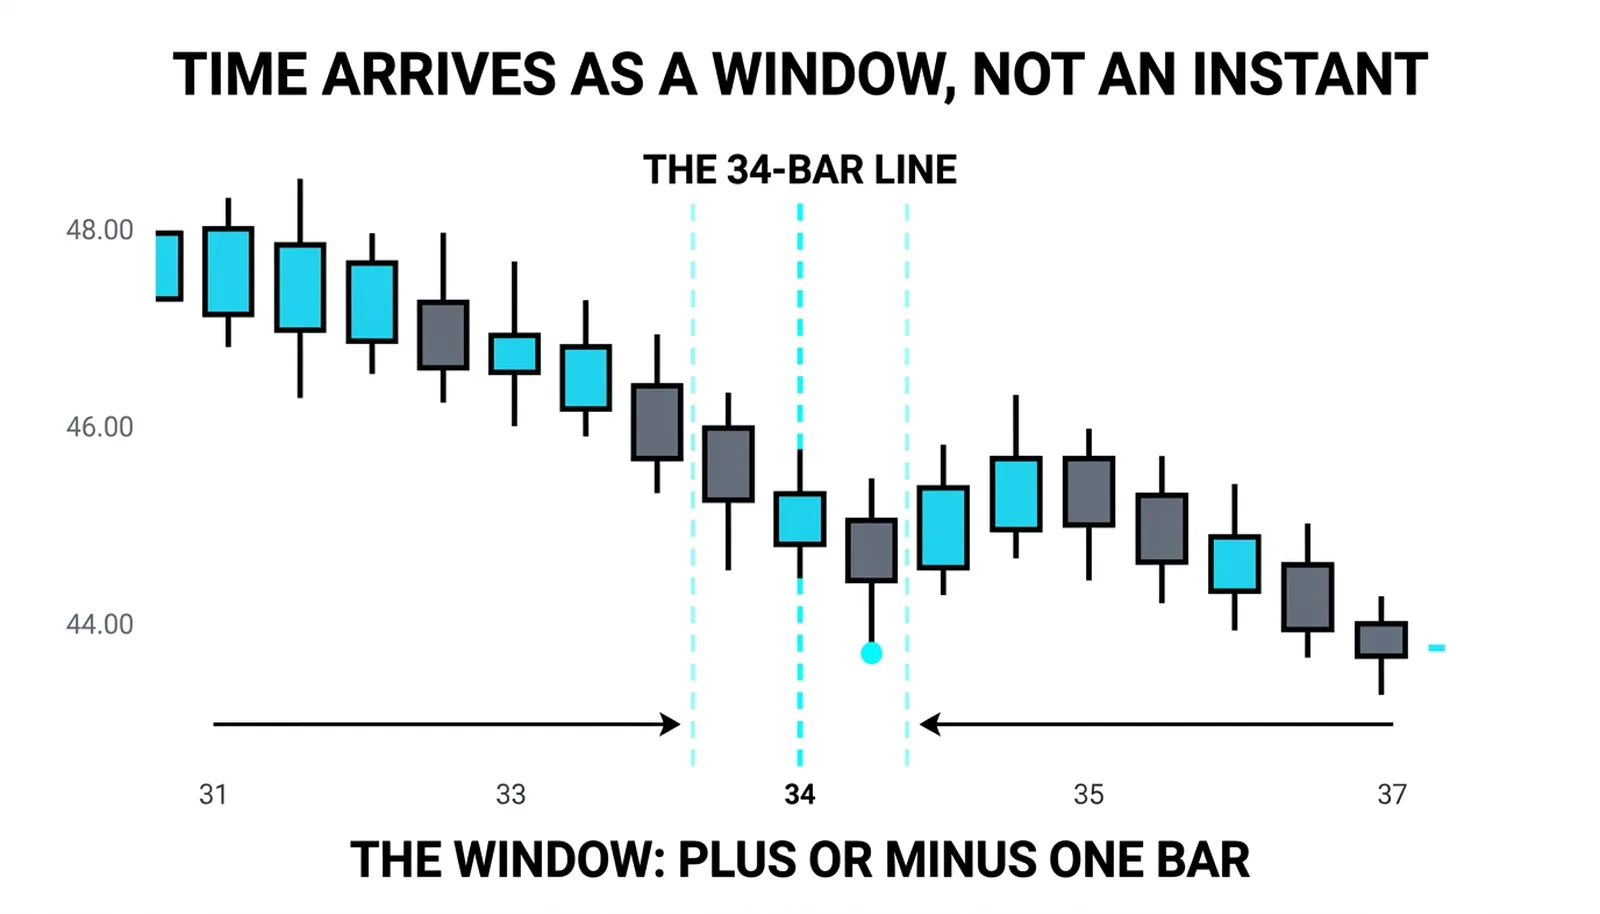
Fibonacci cluster practice projects time between two points, low to low or high to high, and watches each projected window with a tolerance of plus or minus one bar. That two-point projection is a refinement worth knowing: instead of counting from one anchor, the cluster method measures the duration of a prior swing and projects that duration forward, letting the market's own rhythm set the spacing. The single-anchor count and the two-point projection answer the same question. When is the next response due?
The price action canon keeps the tool honest: a vertical line is a claim about timing, and timing claims act on the market only where they coincide with prices the crowd already defends. A zone arriving in empty space, far from any level buyers or sellers respect, is a date without a destination. The zones are read against the price lines, never alone.
The Tolerance of One Bar
The near-not-under rule is the tool's operating manual. The market answers near the lamp without standing under it. A turn that begins one bar before the zone or one bar after it counts as a kept appointment. A trader who demands the exact bar will discard valid signals constantly, because markets do not keep schedules to the bar. The tolerance is not an excuse for sloppy reading; it is the honest width of the tool's accuracy.
Reading the zones against the price lines is what separates a calendar from a signal. The checklist is short:
- The zone arrives, within one bar either side.
- Price sits at, or reaches, a level the chart already defends: a retracement line, a prior swing, a moving average the crowd watches.
- A reversal candle or a shift in short-term structure confirms the response.
All three, and the zone has done its job. The zone alone, with no price line and no response, is a date on a calendar and nothing more.
What disqualifies a starting swing deserves its own attention. Three things ruin an anchor:
- The swing was never confirmed; price made a marginal new high or low a bar later, and the count started from a bar that turned out to be noise.
- The swing belongs to a different degree of trend than the one being traded; a five-minute wiggle anchors a count being read on a daily chart.
- The swing sits inside a sideways drift where highs and lows mean little; counting from a bar inside a range schedules appointments for a market that has stopped traveling.
A bad anchor does not produce bad luck. It produces a schedule that was never valid.
The widening intervals are the tool's weak side, and the point is worth stating plainly. Late zones stand so far apart that a trend can grow old between two of them. The thirteen-bar zone and the twenty-one-bar zone are neighbors; the twenty-one and the thirty-four leave a gap where anything can happen. And a zone that arrives with nothing to turn is not a failed call, only one appointment the market declined. The tool schedules windows. It never guarantees a guest.
Trading the Arrival
The trade happens where the vertical schedule meets the horizontal level. The zone says when; the price line says where; the candle says whether. The entry waits for all three. The entry is taken on that close or on the next bar's open. The stop goes beyond the price line, on the far side of the level the trade is built on, so that a market which ignores both the schedule and the level exits the position quickly and cheaply.
The target is chosen from structure, not from hope: the prior swing extreme, the next level up, or a measured objective the chart already offers. The zone contributed the timing. It contributes nothing to the exit plan.
The failure mode repeats wherever zones are read alone: a market that has already spent its move meets the window extended and tired, with no pullback left to reverse, and the schedule never claimed to know where the market would be standing when the date arrived.
The discipline is a single question asked at every zone: is there something here to turn? A retracement into a defended level, yes. An exhausted market at the extreme, no.
The Twenty-One-Bar Zone
All numbers here are hypothetical, round, and invented for illustration.
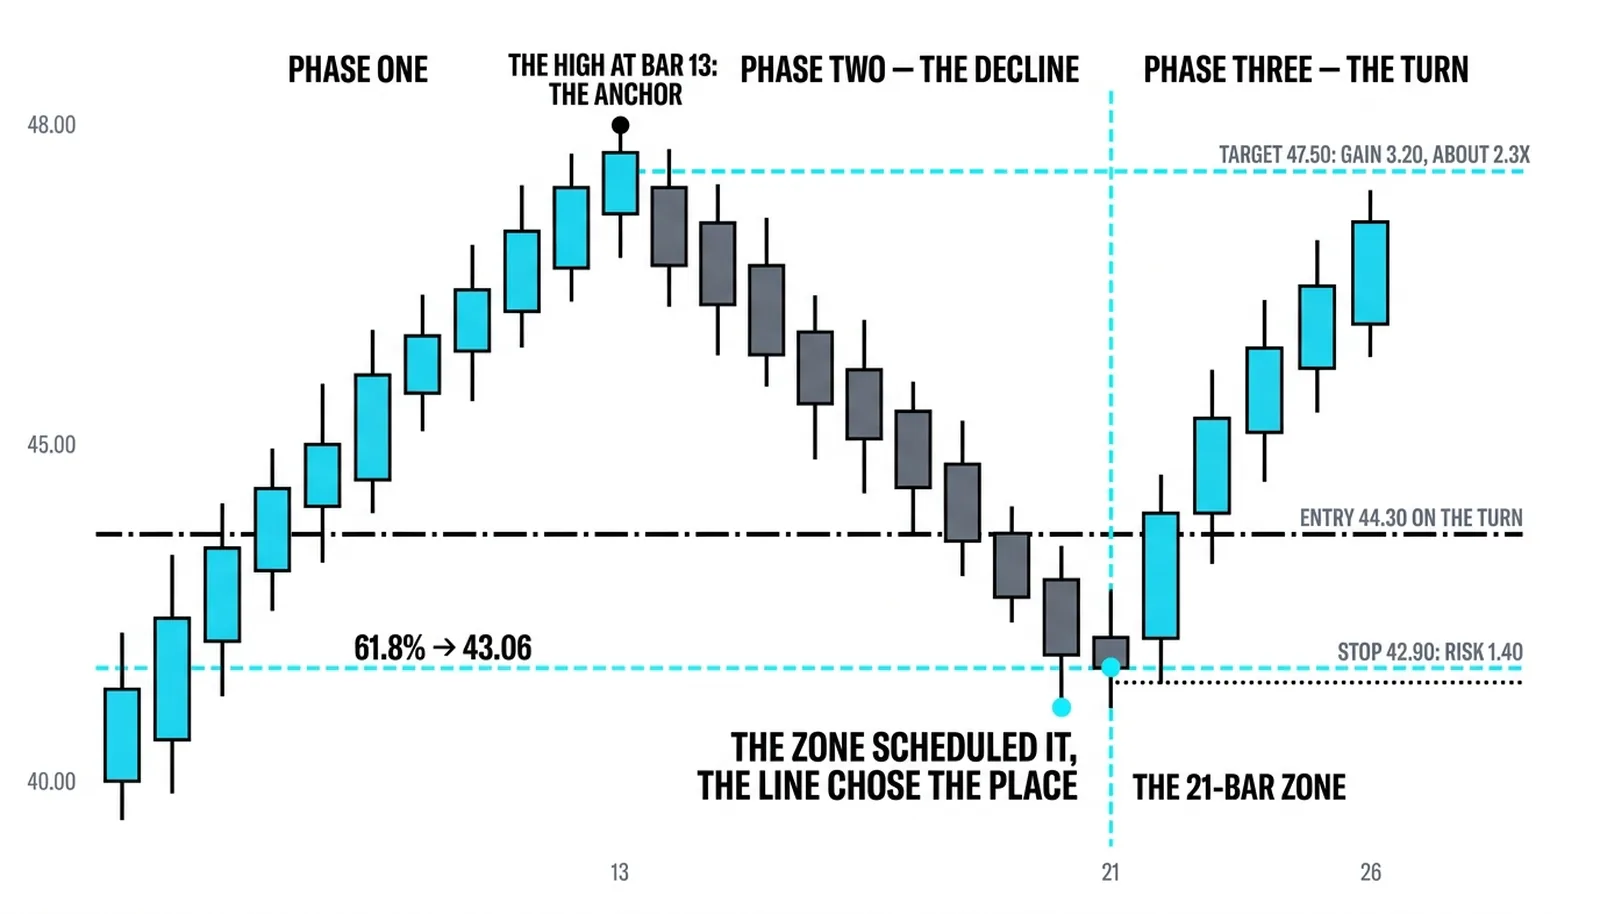
A leg runs 8.00 points, from 40.00 up to 48.00, and tops out thirteen bars off the low. The high is confirmed when the following bars print lower highs. From that confirmed high, the fibonacci count is drawn forward, and the zones that matter stand at twenty-one and thirty-four bars out.
The 61.8 percent retracement line of the leg sits at 43.06. That is the meeting place. Now the market walks toward the appointment.
The twenty-one-bar zone arrives. Price is at 43.20, nearly touching the retracement line, and the next candle reverses and closes at 44.20, back above the line with a strong body. The three conditions are met: the zone, the level, the response. The long is taken at 44.30 on the close. The stop goes at 42.90, just below the 43.06 line, risking 1.40 per unit. The first target is 47.50, just under the old high, for a gain of 3.20, about 2.3 times the risk.
The zone scheduled the appointment. The line chose the place. The candle confirmed the guest arrived.
The failed version keeps the two tools separate in the trader's mind. The thirty-four-bar zone arrives with the market already at 47.90, pressed against the old high after a long climb. The appointment is kept on schedule, and there is nothing left to turn. No retracement has happened, no level has been tested from above, no reversal candle appears. The trader who buys the zone because the zone arrived buys the top the schedule knew nothing about. Same tool, same chart, opposite outcome, and the difference was the question asked at the window.
| Zone | Bars It Counts | Price It Names | Tolerance It Allows |
|---|---|---|---|
| Thirteen-bar zone | 13 bars from the anchor | None; vertical only | Plus or minus one bar |
| Twenty-one-bar zone | 21 bars from the anchor | None; read against 43.06 | Plus or minus one bar |
| Thirty-four-bar zone | 34 bars from the anchor | None; arrived at 47.90 with nothing to turn | Plus or minus one bar |
| Two-point projection from cluster practice | Duration of a prior swing, projected forward | None; sets the window | Plus or minus one bar |
Time Zone Questions, Answered
What are fibonacci time zones?
They are vertical lines projected forward from a confirmed swing at fibonacci counts of bars: one, two, three, five, eight, thirteen, twenty-one, and beyond. Each line marks a window where the market has a statistically interesting chance of responding, and each carries no price information at all. The tool schedules; it does not predict direction or distance.
How do you draw fibonacci time zones?
Pick a confirmed swing high or low, one the market demonstrably turned on, and apply the count forward from that bar. Most charting platforms draw the full sequence automatically once the anchor is set. The craft is in the anchor: confirmed, on the timeframe being traded, and outside sideways drift. The two-point variant of the cluster method measures a prior swing's duration and projects that span forward instead.
Why do the intervals widen?
The fibonacci sequence grows by addition, each number the sum of the two before it, so the gaps between consecutive counts grow as the sequence runs. Early zones sit close together and late zones stand far apart. The practical consequence: the tool is densest and most useful in the bars right after the anchor, and thins out the further the count travels.
Do time zones work on every timeframe?
The count is timeframe-agnostic because it counts bars, and every timeframe has bars. What changes is reliability. Higher timeframes anchor on swings more traders can see, so the scheduled windows gather more attention and the responses tend to be cleaner. Very low timeframes count bars that fewer participants watch, and the zones there behave more like noise. Match the anchor to the timeframe being traded, and respect that the schedule is only as public as the chart it is drawn on.
The next lessons stay on the horizontal axis and widen the lens: cycles that repeat on their own rhythm, and the windows where several schedules arrive at once.