What Is a Fibonacci Retracement
A fibonacci retracement is the measurement of a counter-move as a fraction of the leg that came before it. The tool divides that prior leg into percentage lines, so the trader can see where the pullback sits and where it is likely to end. It turns a vague question, how far has price fallen back, into a set of exact prices.

Think of it as a dance step back before the next step forward, the partner returning some distance without ever leaving the dance. The earlier lessons built the ratios and the setup; this lesson puts them to their central use, measuring the pullback, which is the single most traded application of the whole toolkit. Everything else in the family orbits this one job.
The Correction Measured as a Fraction
Every trend travels in legs. There is the impulse, the push in the trend's direction, and the correction, the move back against it. A retracement is the correction expressed as a fraction, the pullback's depth measured against the leg that produced it.
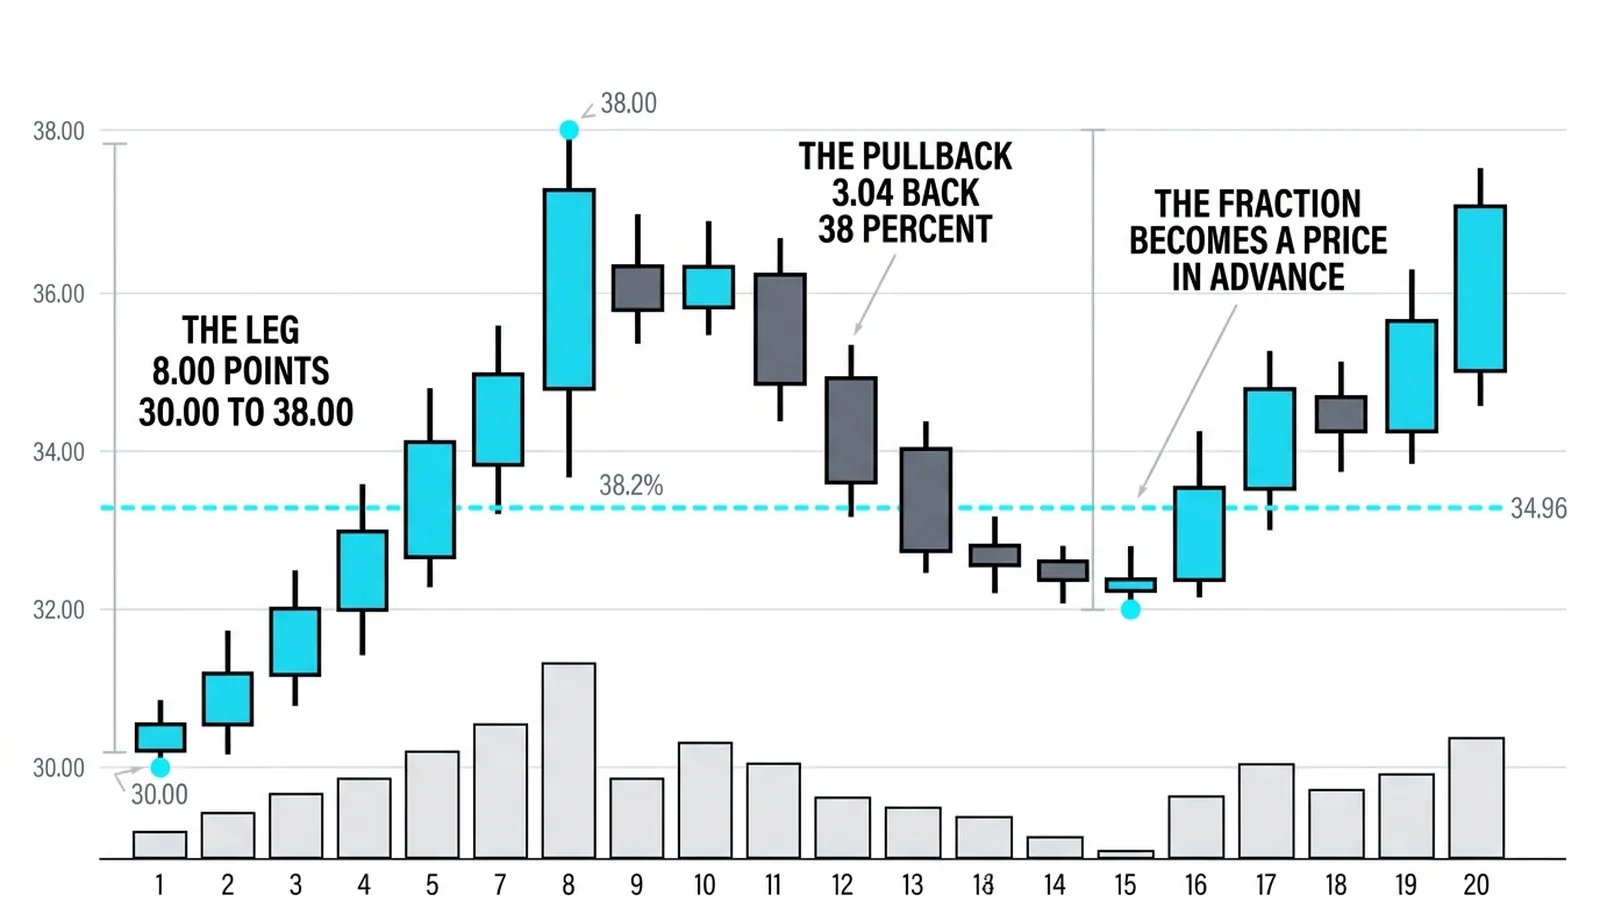
The mechanics are simple. In an uptrend the leg runs from the swing low to the swing high. The tool takes that vertical distance and divides it by the ratio family, 23.6, 38.2, 50, 61.8, 78.6 percent. The lines it draws below the high are the prices where the pullback may end.
The value is that the lines exist before the pullback happens. The moment a leg completes, the trader already holds a price map of every plausible stopping point. No waiting, no guessing, no adjectives like "a bit deep."
Depth is information. A shallow counter-move, one that stalls in the upper quarter of the leg, confirms a strong trend with eager buyers. A deep one, down past half the leg, questions the trend, because the sellers just proved they can reclaim serious ground. The lines grade the trend's health in real time.
The cluster method builds an entire methodology on this idea, treating the ratios as the framework for timing entries inside trends rather than as curiosities. The consistent finding across practitioners is that depth clusters. Pullbacks do not stop at random depths; they bunch around a small set of fractions, which is what makes the measurement worth taking.
Retracement Is Not Reversal
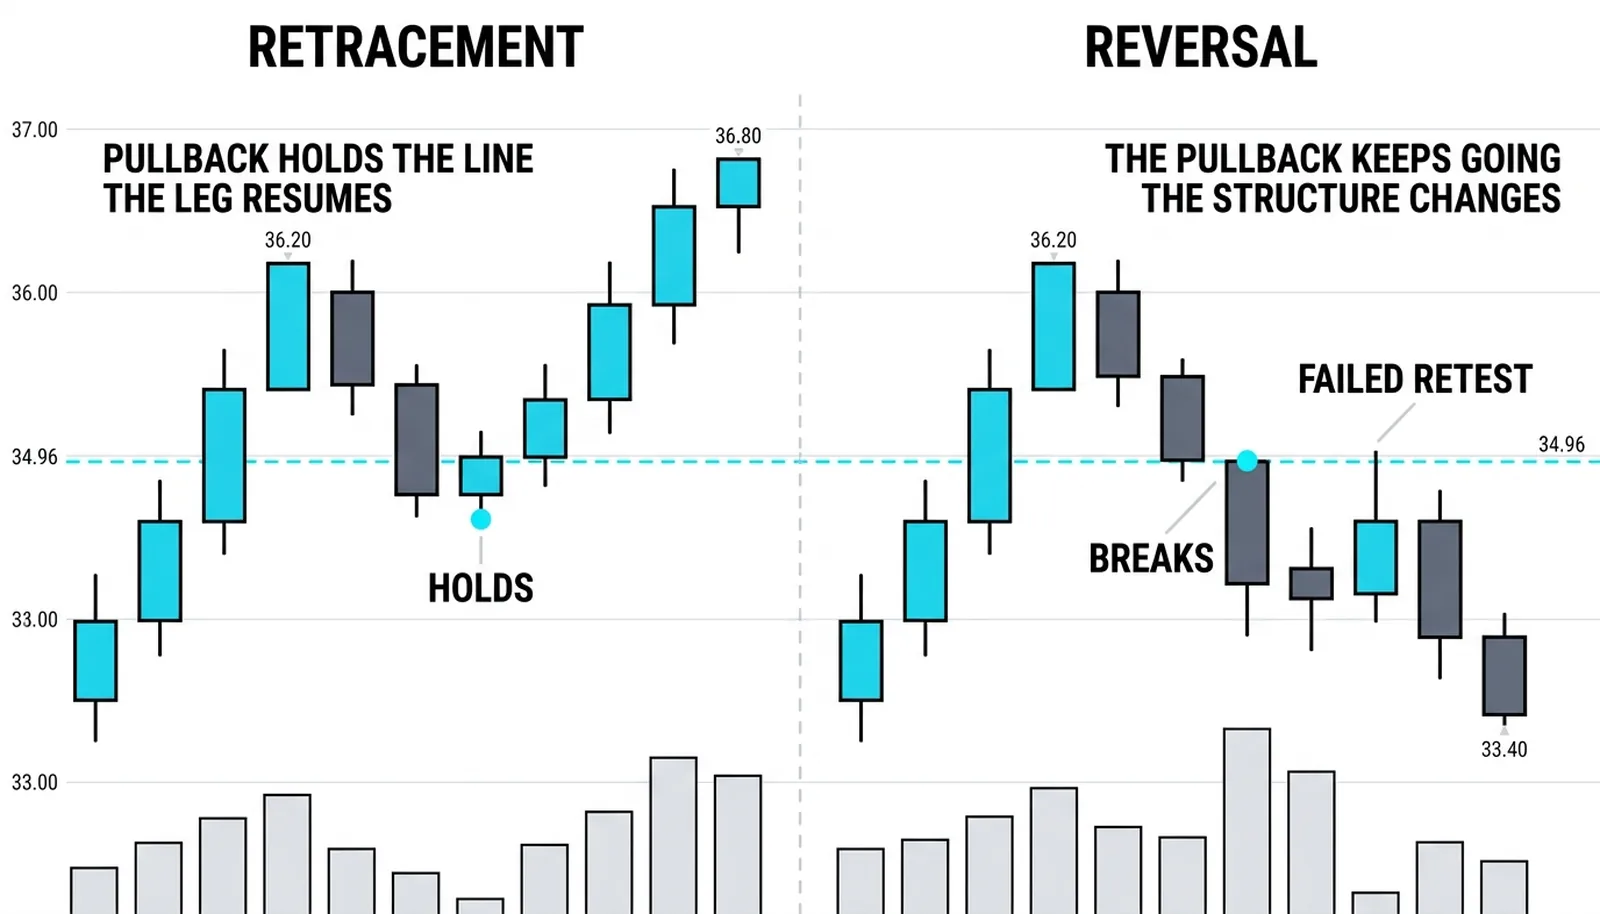
Here is the distinction the whole idea rests on. A retracement is the trend catching its footing while the structure of higher highs and higher lows stays intact. A reversal is the structure itself changing, the change of character the earlier lesson defined.
The price action canon frames the trader's core problem exactly this way: most pullbacks in a trend are opportunities within it, and the job is telling the pause from the end. The depth measurement is the tool for that telling. A pullback holding at 38.2 percent looks like a pause. A pullback slicing through 78.6 percent and taking out the leg's origin is no longer a pullback at all.
The structural test is mechanical. While the correction holds above the prior significant swing low, the uptrend's skeleton is unbroken, and the counter-move is a retracement by definition. The moment price breaks that low, the label changes, and so should the positioning.
What each reading means for the position:
- Shallow retracement, structure intact: the trend trade stays valid, and the pullback is a candidate entry or add.
- Deep retracement, structure intact: the trend survives but is weakened; size down or demand stronger proof of the turn.
- Structure broken: the retracement idea is dead for this leg; the trader stands aside or reassesses in the other direction.
Getting this wrong is expensive in both directions. Treating a reversal as a retracement means buying every step of a real decline. Treating every retracement as a reversal means exiting good trends at the first sigh of weakness.
Trading the Measured Pullback
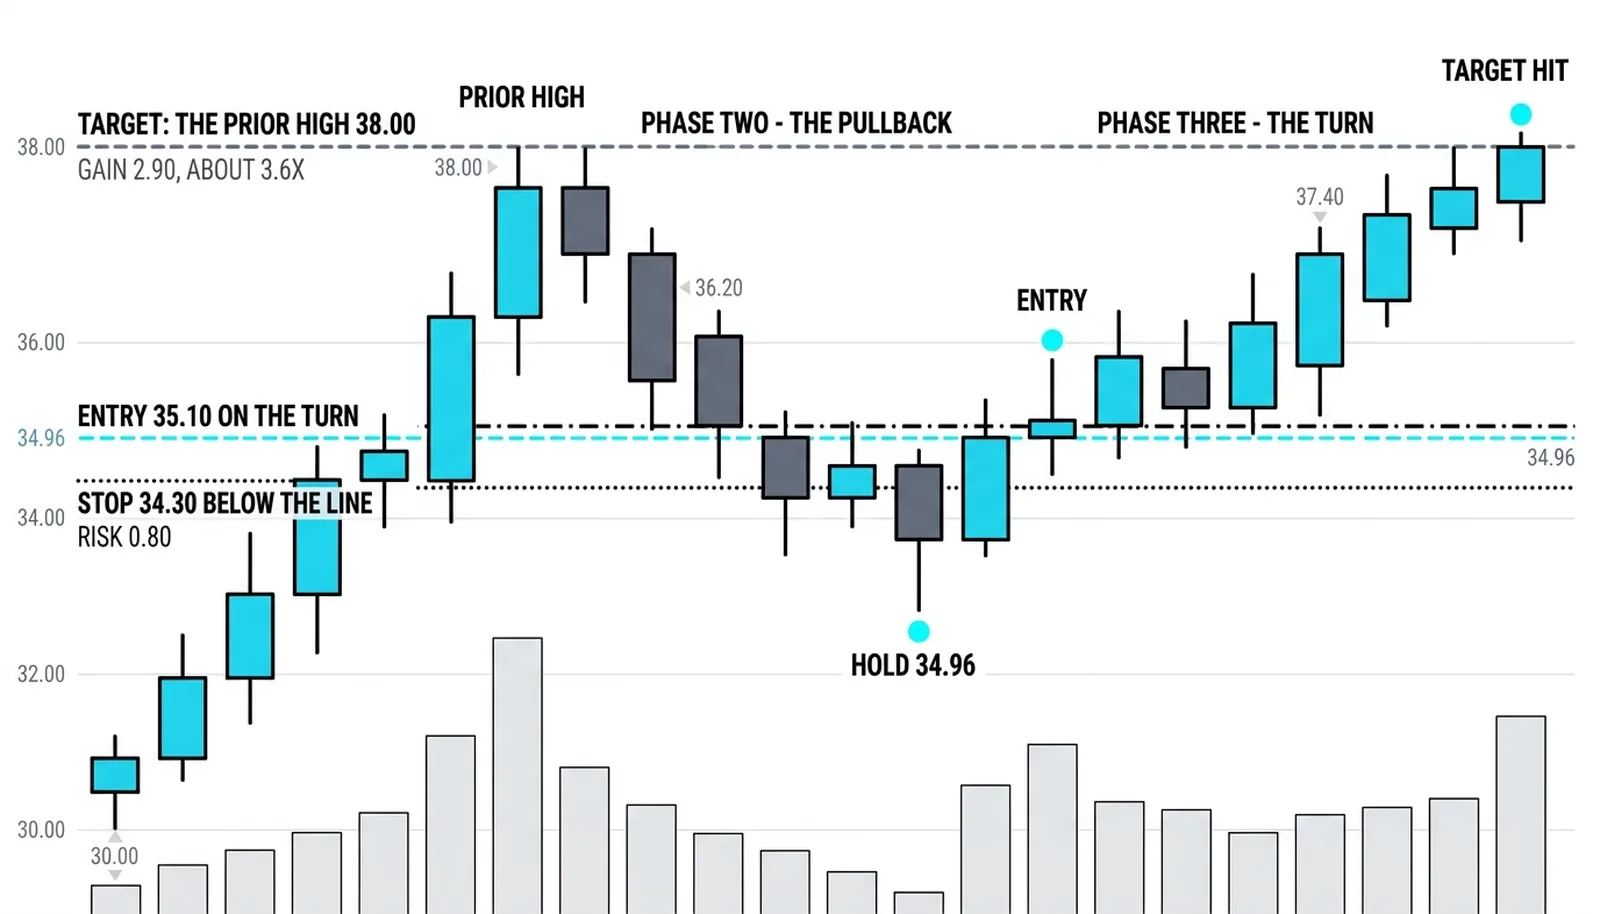
The trade has three working parts. The entry comes at the reaction, not at the line itself. The stop sits below the measured level. The target is the prior extreme, the high that started the pullback.
Entering at the reaction matters because the line alone is not a signal. The trader waits for price to reach the zone, stall, and show a turn, a rejection wick, a higher low on the smaller timeframe, a strong close back up. Then the long goes on, with the line as the reference for risk.
The stop belongs below the measured level, and this is not caution for its own sake. If price trades through the line and keeps going, the idea "the pullback ends here" has been falsified by the market itself. The stop is the definition of being wrong, written into the order.
Now the honesty, stated plainly. The retracement is a measurement, not a forecast. It says where the pullback is, not where it must stop. Most pullbacks end between the lines rather than on them, which is why the reaction matters more than the line and why the stop exists. A trader who treats the lines as guarantees will be right often enough to stay interested and wrong often enough to lose money.
The Hold at 34.96
A hypothetical illustration with round numbers. A leg runs 8.00 points, from 30.00 up to 38.00. The tool divides that leg and puts the 38.2 percent line at 34.96 and the 50 percent line at 34.00.
Price sags from the high, reaches 34.96, stalls, and prints a firm close back up. The reaction has arrived. The long is taken at 35.10 on the turn, the stop at 34.30 below the line, risking 0.80. The target is the prior high at 38.00, a gain of 2.90, about 3.6 times the risk.
The failed version teaches as much. Suppose price closes at 33.80, below the 50 percent line. The shallow read is dead. The trader holding the long was already out at 34.30 with a small, defined loss, and the deeper lines, 61.8 and 78.6 percent, take over the watch. Nothing about the failure was surprising, because the plan named its own exit in advance.
| Depth | Price | Story it tells | Response |
|---|---|---|---|
| 38.2% | 34.96 | Strong trend, shallow pause, buyers impatient | Prime entry zone on a confirmed turn |
| 50% | 34.00 | Normal correction, trend intact but tested | Entry only on a clear reaction |
| 61.8% | 33.05 | Deep pullback, trend health in question | Reduce size, demand stronger proof |
| Below 30.00 | Leg origin broken | Structure changed, no longer a retracement | Stand aside, reassess direction |
Retracement Questions, Answered
What is a fibonacci retracement?
A fibonacci retracement is the measurement of a counter-move as a fraction of the leg that came before it. The tool divides the prior leg into percentage lines so the trader can see where the pullback sits and where it is likely to end.
What does a retracement tell you?
It tells you how deep the counter-move has gone, and that depth grades the trend's health. Shallow pullbacks confirm strength, deep pullbacks question it, and the lines convert that judgment into specific prices.
Is a retracement the same as a reversal?
No. A retracement is a pause inside an intact trend, with the structure of higher highs and higher lows unbroken. A reversal is the structure itself changing, marked by the break of the prior significant swing point.
How deep do retracements usually go?
Most pullbacks in a functioning trend end somewhere between the 38.2 and 61.8 percent lines, and most end between the lines rather than exactly on them. That spread is why the trader waits for the reaction instead of placing blind orders at a single line.
With the pullback measured and the distinction from reversal in hand, the next lessons narrow the focus: the golden zone, the band where the deepest watched reactions cluster, and the drawing procedure that keeps every measurement honest from the first click.