What a Trend Really Is
What a trend really is, stripped of indicators and opinions, is a direction the market keeps choosing, defined by a sequence of swings. Not a feeling. Not a moving average. Not a headline. A trend is a repeating pattern in the highs and lows themselves, and the sequence, not the excitement of the move, is the definition.

Think of the market as an elevator with three buttons: up, down, and holding between floors. A trend is simply the button that keeps getting pressed.
That is the idea, and it is simpler than most beginners expect. The rest of this post is about applying that definition cleanly, because most confusion about trends comes from adding things to it that were never part of it.
The Definition Without Indicators
In an uptrend, each rally exceeds the last high, and each pullback holds above the last low. In a downtrend, each decline breaks below the last low, and each bounce stalls below the last high. That is the test in full.
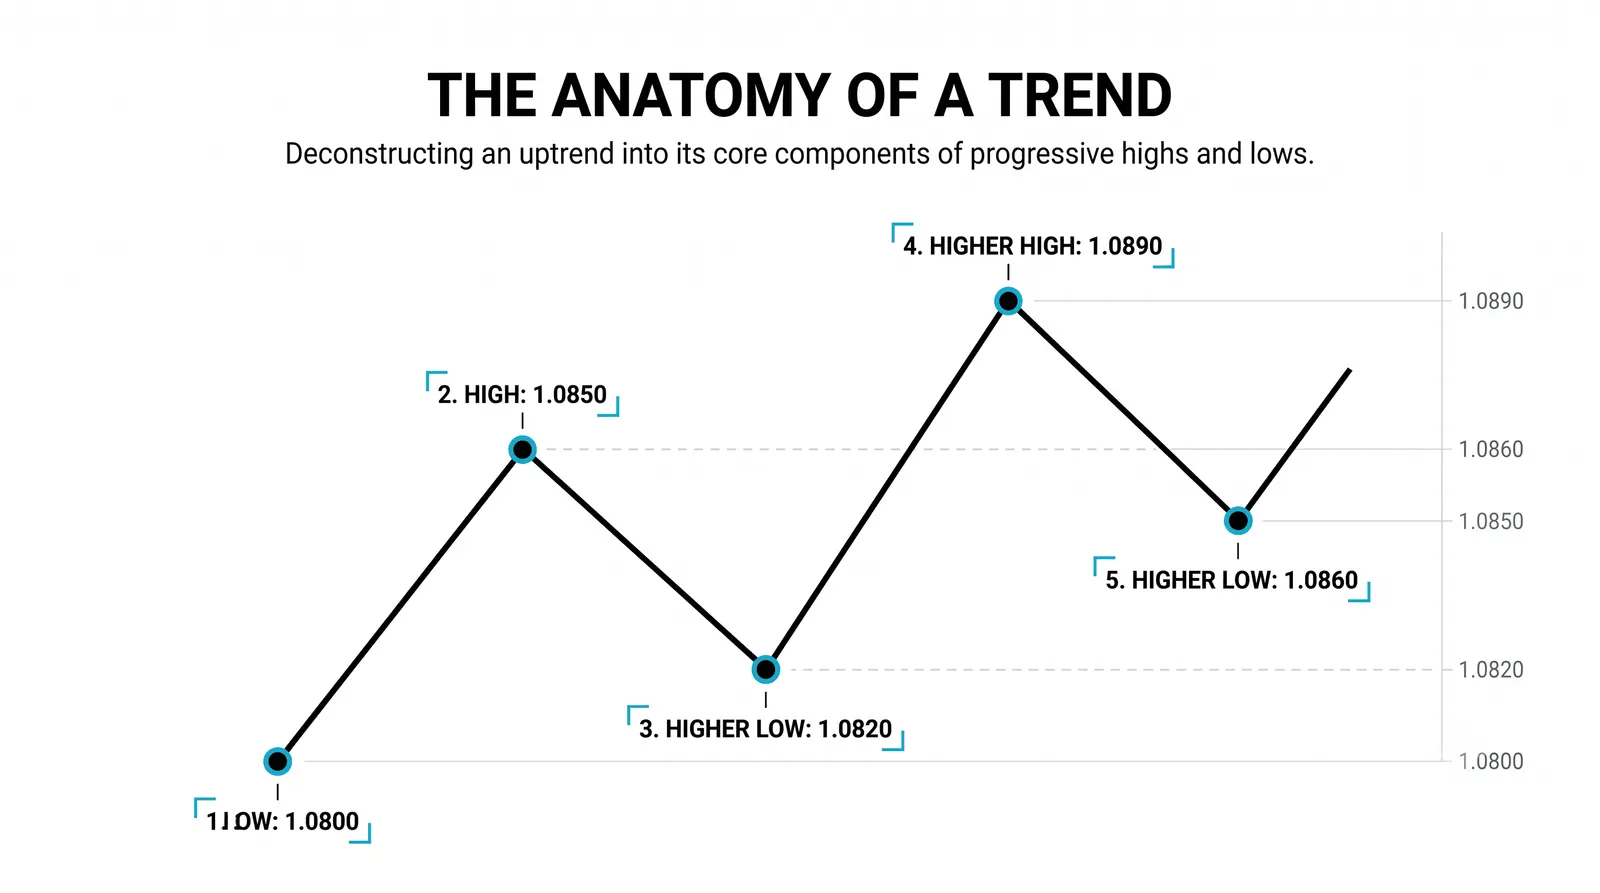
Notice what is missing. No RSI. No MACD. No trendlines drawn with a ruler. Those tools can help you see the sequence, but they are not the trend. The trend is the sequence itself, printed in the swing highs and swing lows of the chart.
You have already learned the vocabulary for this: higher highs and higher lows, lower highs and lower lows. That lesson taught you the mechanics of reading swings, and we will not repeat it here. What matters now is the bigger claim: the sequence is the definition, and everything else is commentary.
This matters practically. When two traders argue about whether a market is trending, they are usually arguing about indicators or opinions. If you reduce the question to the sequence, the argument usually dissolves. Either the highs and lows are stepping in one direction, or they are not.
How trends begin and how they die is a separate lesson with its own rules. For now, you only need to recognize the state that exists right now.
The Three States, Always Exactly One
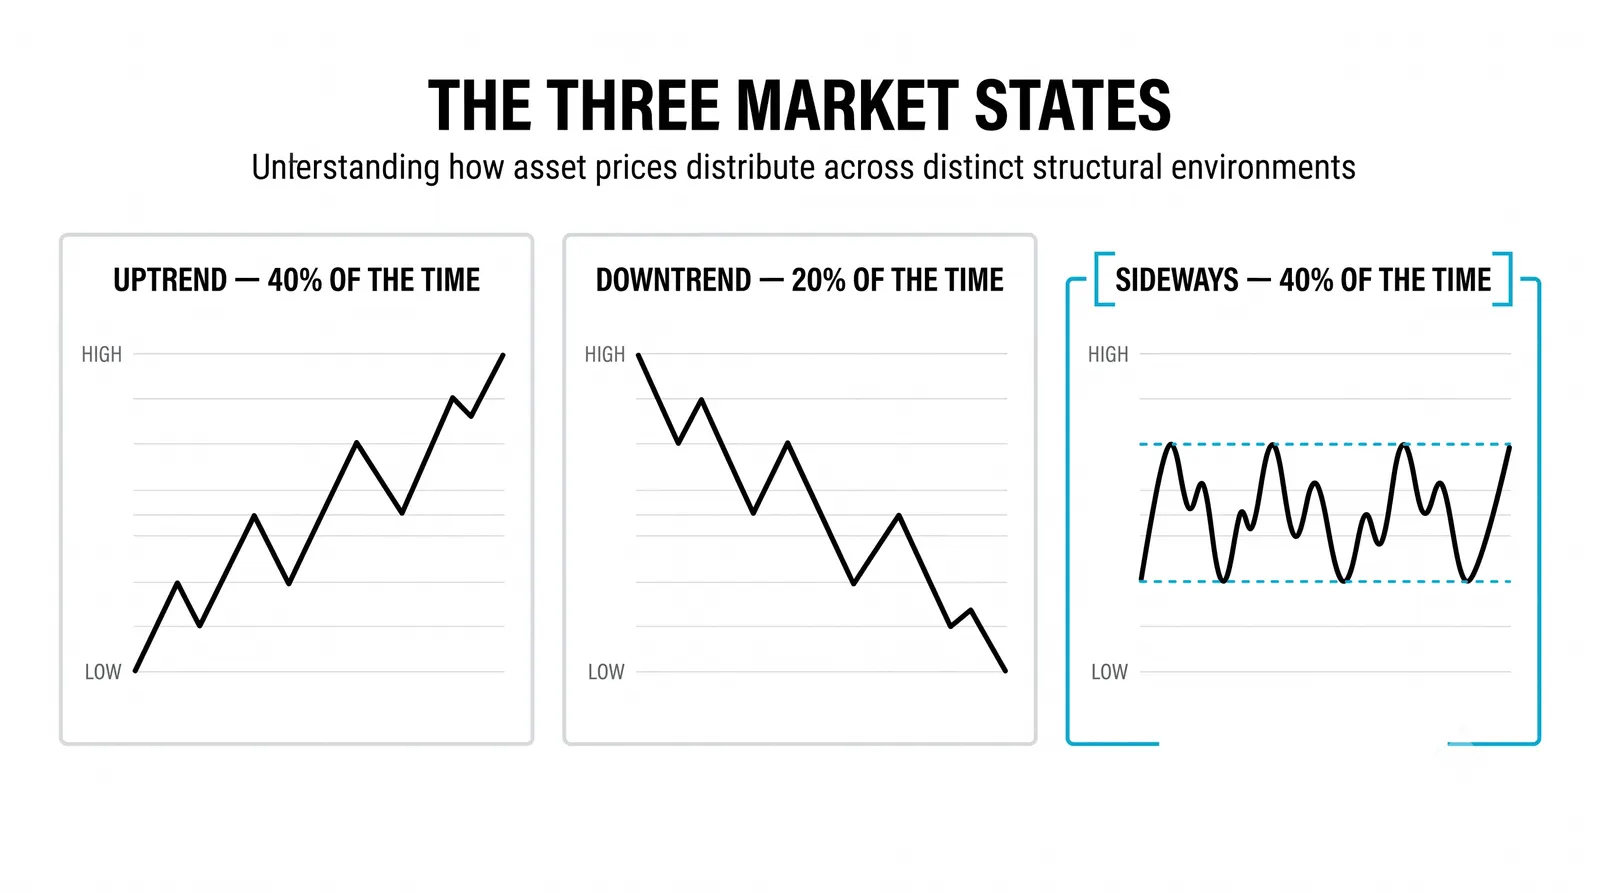
Every market, at every moment, on every timeframe, is in one of three states: an uptrend, a downtrend, or a range. There is no fourth option, and there is no "none of the above."
The third state is the one beginners forget. New traders learn uptrends and downtrends, then force every chart into one of those two boxes. But markets spend most of their time in ranges, moving sideways between a floor and a ceiling with no directional sequence at all.
A range is not the absence of information. It is a state with its own meaning: buyers and sellers are balanced, and neither side can produce a sequence of higher highs or lower lows. Treating a range as a broken trend leads to bad trades. Treating it as its own legitimate state leads to patience.
Make naming the state the first question of any analysis. Before you look for entries, before you measure risk, before you check a single indicator, ask: which of the three states is this chart in right now? If you cannot answer that in ten seconds, you are not ready to trade the chart.
Why the Feeling of Movement Lies
Speed feels like trend. It is not.
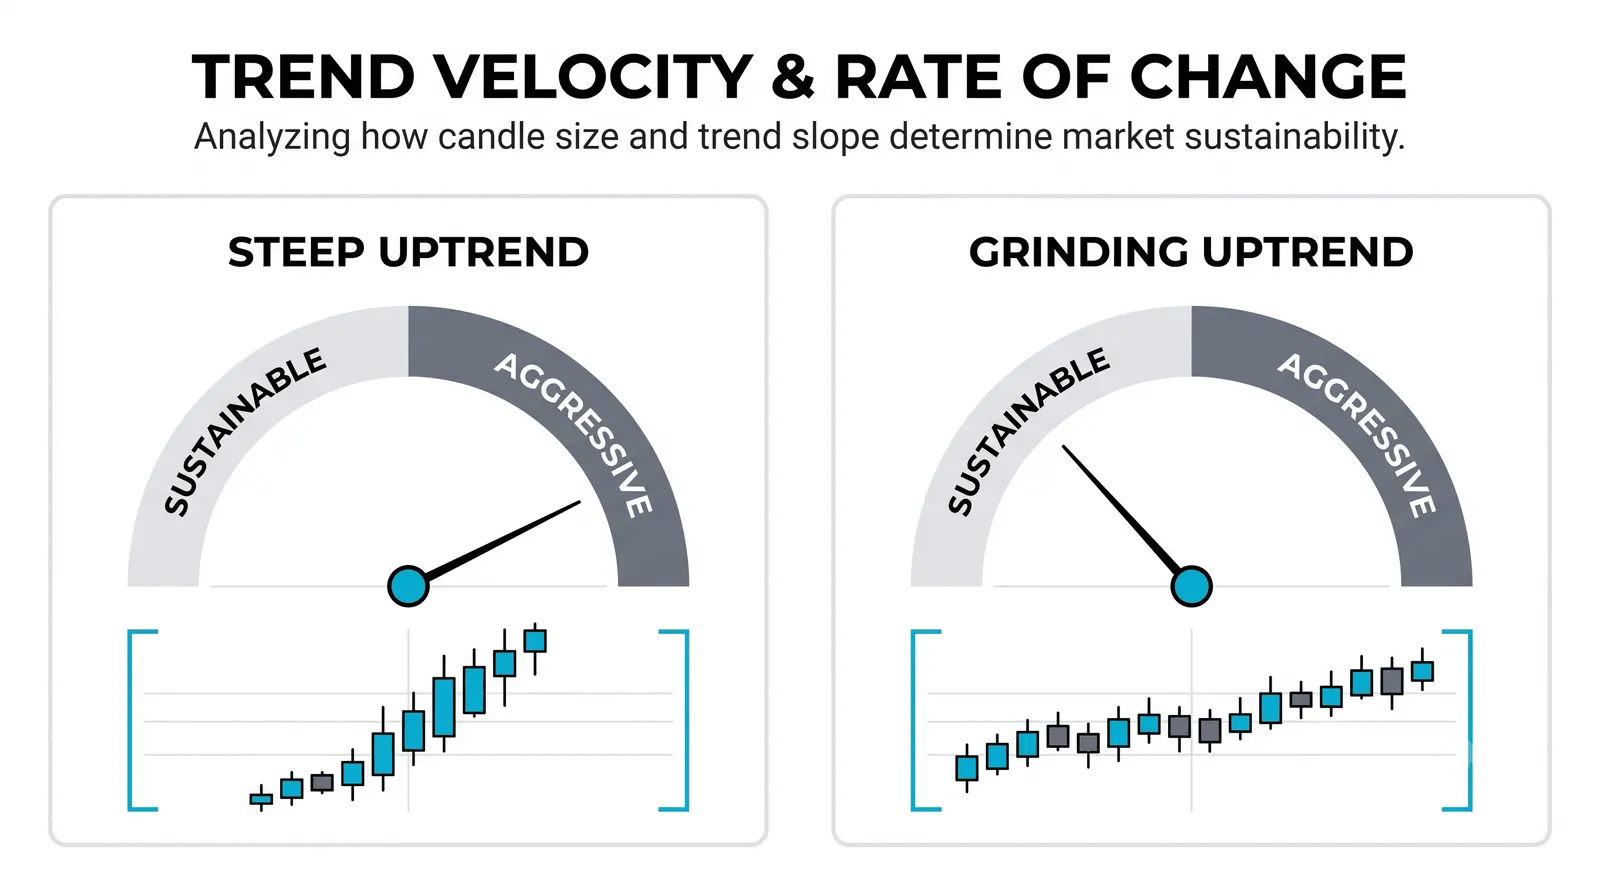
A fast, violent move inside a range is still a range. If price rips from the bottom of a sideways band to the top in two sessions, the adrenaline is real, but the sequence has not changed. The highs are still capped at the same ceiling. The lows are still floored at the same base. Excitement is not evidence.
The reverse is also true. A slow, grinding advance that takes three weeks to climb a few points can be a perfectly real uptrend, as long as each push exceeds the prior high and each dip holds above the prior low. Boredom is not evidence either.
This is where many beginners get hurt. They chase the fast move because it feels like a trend, and they abandon the slow move because it feels like nothing. The market charges for both mistakes. The sequence decides. Your pulse does not get a vote.
Train yourself to separate the two questions. "How fast is it moving?" is about volatility. "Which direction does the sequence point?" is about trend. They are different questions with different answers, and only one of them defines the state.
Trends Exist on Every Timeframe at Once
Here is a fact that unsettles beginners: the same chart can be in an uptrend on the weekly, a downtrend on the daily, and a range on the hourly, all at the same moment. None of those readings is wrong.
Each timeframe has its own sequence of swings. The weekly chart sees only the large swings, so its sequence can point up while the daily chart's smaller swings point down. They are different buttons pressed on different floors of the same building.
This means the question "what is the trend?" is incomplete. The honest question is "what is the trend on the timeframe I am trading?" A swing trader working off daily charts and a scalper working off five-minute charts can look at the same market and both be correct about its trend, because they are answering different questions.
The practical habit is to check at least two timeframes: the one you trade, and one higher. The higher one tells you the larger current you are swimming in or against. The lower one tells you the immediate state. Conflicts between them are normal, and recognizing the conflict is itself useful information.
One Stock, Three States
Consider a hypothetical stock, call it any ticker you like, and walk through ten months of its life. Round numbers, no indicators, just the sequence.
January to April: uptrend. The stock starts at 80. It rallies to 88, pulls back to 84, rallies to 92, pulls back to 88, then pushes to 96. Read the sequence: each rally exceeded the last high (88, then 92, then 96), and each pullback held above the last low (84, then 88). Higher highs, higher lows. The state is an uptrend, and it does not matter how fast or slow the climb felt.
April to July: range. From 96, the stock falls back to 92, rises to 95, dips to 93, rises to 96, dips to 92 again. For three months, price bounces between roughly 92 and 96. No rally exceeds the old high in a sustained way, and no decline breaks the floor. The sequence has stopped stepping. The state is a range, even though the swings inside it sometimes felt dramatic.
July to October: downtrend. The stock breaks below 92, slides to 88, bounces to 91, falls to 85, bounces to 88, then drops to 82. Now read the sequence again: each decline undercut the last low, and each bounce stalled below the last high. Lower lows, lower highs. The state is a downtrend.
Same ticker. Same company. Three different answers to "what is the trend," and each answer was true in its window. The stock did not have a trend. It had a sequence of states, and the only correct answer was always the current one.
Notice also that nothing here required a prediction. You did not need to know in April that a range was coming, or in July that a downtrend was starting. You only needed to name the state that existed, and update the name when the sequence changed.
Questions About Trends
Is a sideways market still a trend?
No. A sideways market is a range, which is its own state, distinct from an uptrend or a downtrend. Calling a range a trend is the most common beginner error, because it pushes you to take directional trades in a market that has chosen no direction. The range is a real state with real rules, and respecting it usually means trading it differently or standing aside.
Which timeframe defines the real trend?
None of them, and all of them. Each timeframe has its own sequence and therefore its own valid answer. The trend that matters to you is the one on the timeframe you are trading, checked against one timeframe higher for context. A "real trend" independent of timeframe does not exist.
Can I trade without knowing the trend?
You can place orders without knowing it, but you are trading blind. Naming the state is the first filter for every decision: whether to trade at all, which direction to favor, and where your idea is proven wrong. Skipping that step does not save time. It just hides the risk from you while the risk stays exactly where it was.
How is a trend different from momentum?
A trend is the direction of the sequence; momentum is the speed and force of the moves inside it. A trend can have strong momentum or weak momentum and still be the same trend, because the definition lives in the highs and lows, not in the pace. Momentum can warn you that a sequence is tiring, but momentum is not the definition of anything.
From here, the natural next step is learning how trends are born and how they die, because a definition tells you what state you are in, but not when the state is about to change. That transition, where one sequence breaks and another begins, is where the next lesson picks up.