Higher Highs and Higher Lows, Explained
Higher highs and higher lows are the definition of an uptrend: each pullback stops above the last low, each push exceeds the last high, and the trend stays intact exactly as long as that pattern holds. Strip away indicators, news, and opinion, and this sequence is what "uptrend" actually means on a chart. Everything else is commentary.

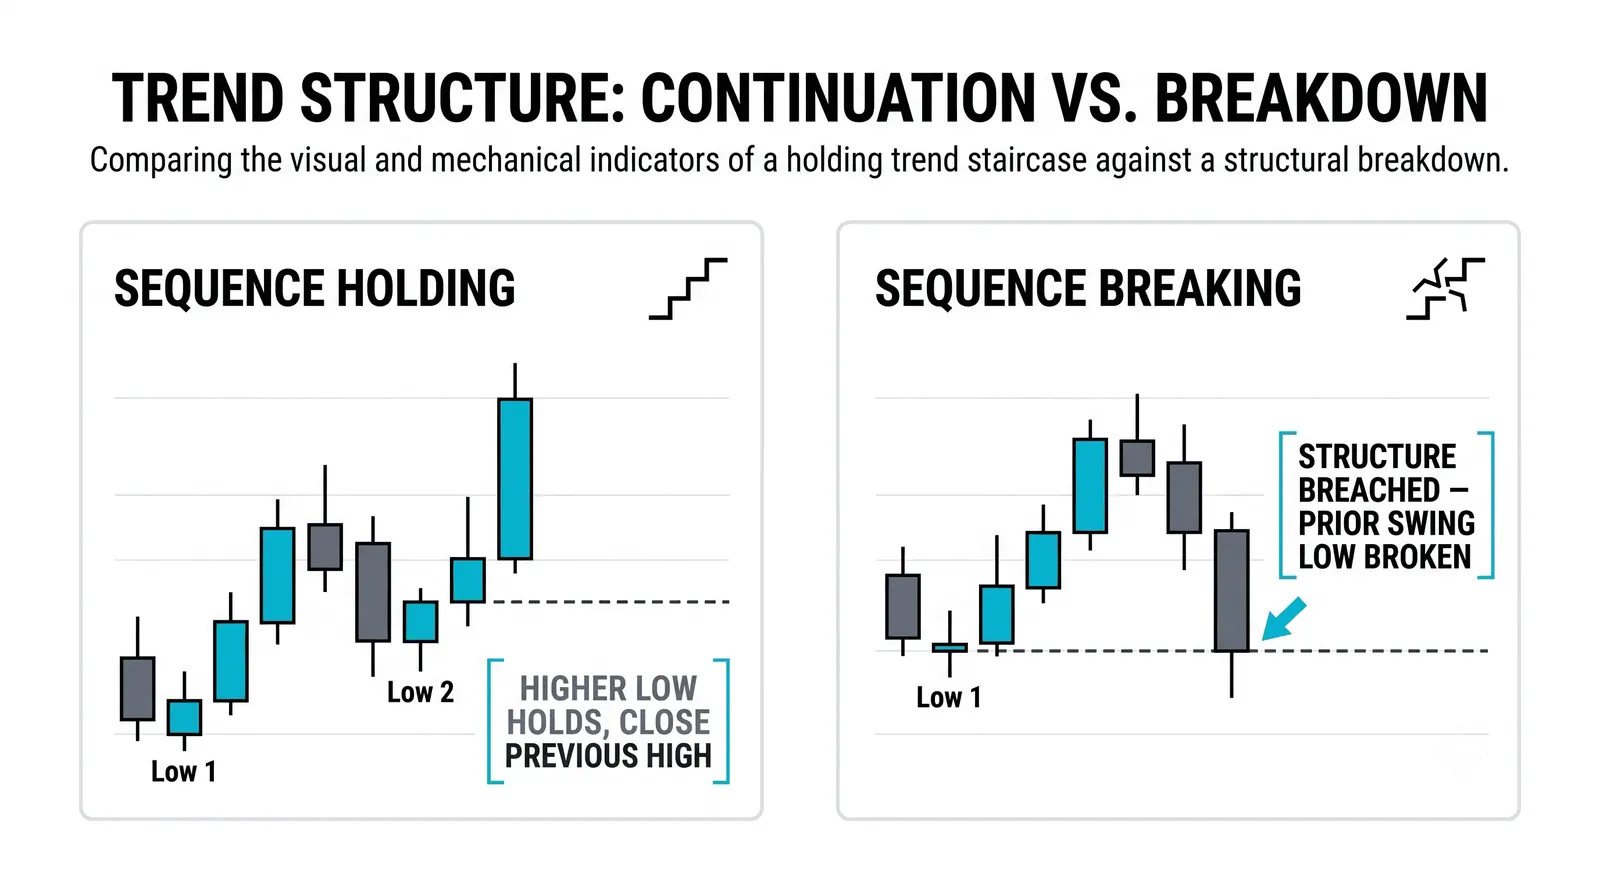
An uptrend reads like an auction where every serious bid must top the last one, and sellers keep accepting higher prices before they push back. Once you see it that way, reading structure becomes mechanical rather than mystical.
What Higher Highs and Higher Lows Actually Are
A high is a swing peak: the point where a rally stalls and price turns down. A low is a swing trough: the point where a decline stalls and price turns up. "Higher" simply means the new print sits above the previous print of the same type.
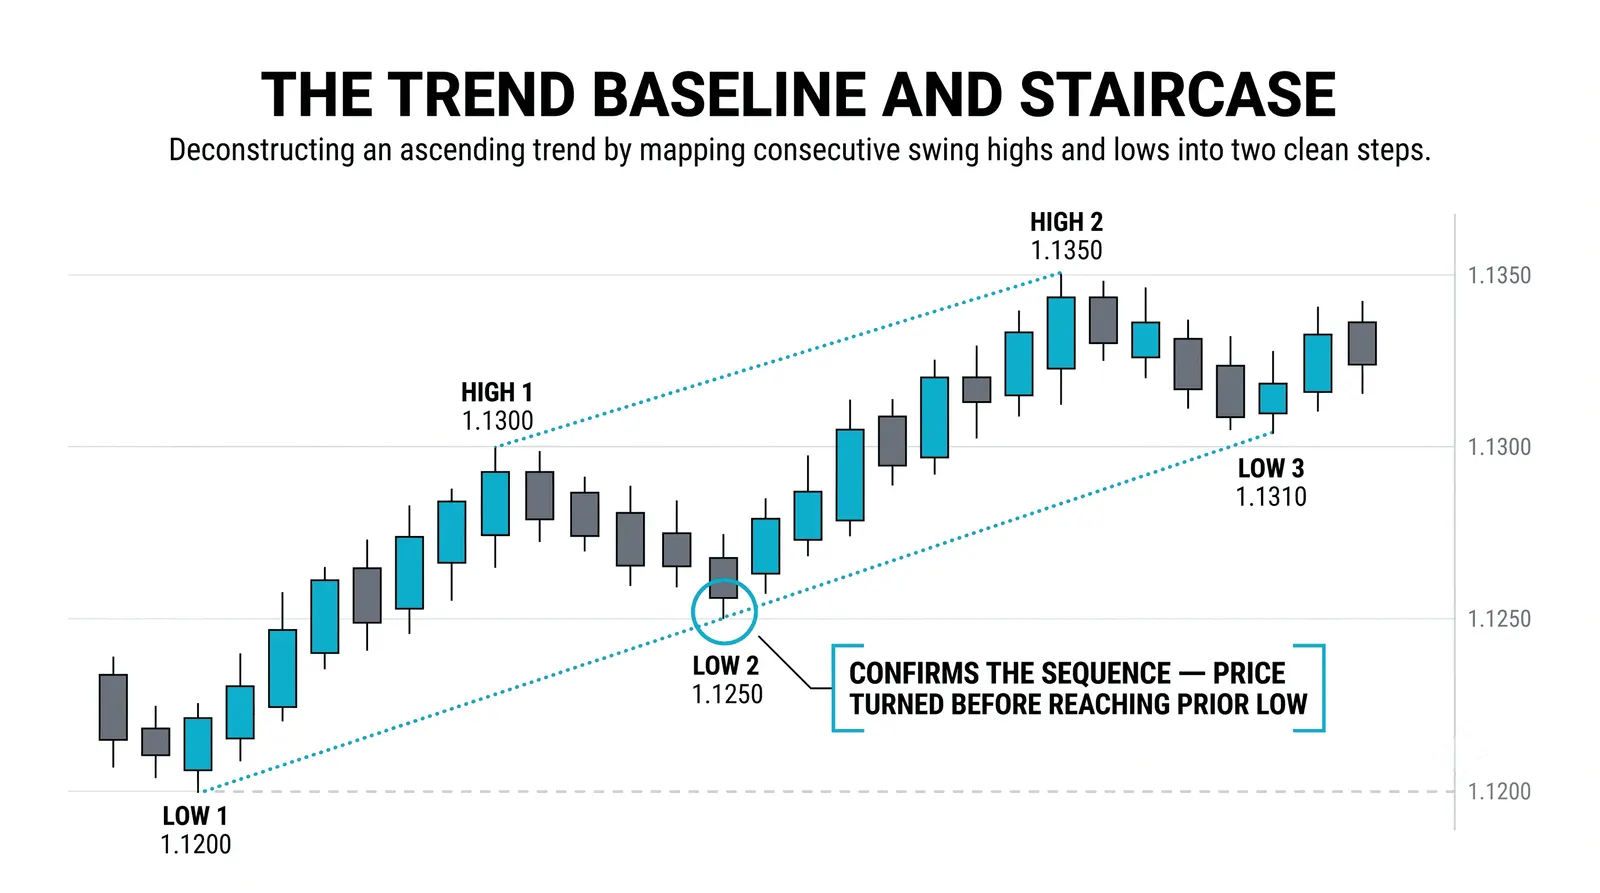
Take a concrete ladder. Price rallies to 104 and stalls. That 104 is a high. Price pulls back to 101 and buyers step in. That 101 is a low. Price rallies again to 106, exceeding 104, so 106 is a higher high. Price pulls back to 103, which holds above 101, so 103 is a higher low.
Four prints, two of each type, and the sequence already tells a story. The highs climbed from 104 to 106. The lows climbed from 101 to 103. Both sides of the ladder are rising, and that is the definition in action.
Notice what is not required. No indicator confirmation, no volume threshold, no moving average. The pattern is self-contained. Price either keeps printing higher highs and higher lows, or it does not.
Why the Sequence Defines the Trend, Not the Direction
Price moving up on any given day means little. Price can rise inside a downtrend for days at a time. What defines the trend is the order and spacing of the swings, not the direction of the latest candle.
Read each print as evidence. A higher low means buyers were willing to pay more than they paid last time, and they stepped in earlier, before price could revisit the old low. That is demand showing up sooner and stronger.
A higher high means sellers lost the fight one level earlier. Last time, they stopped the rally at 104. This time they could not hold it, and price traded through to 106 before they regained control. Supply is retreating.
Between the two, the lows carry the real information. Anyone can chase a rally. The pullback is where conviction gets tested, because that is where buyers must decide whether the asset is worth more than it was last week. A rising series of lows is a rising floor of accepted value.
Direction is a snapshot. Sequence is the film.
How Breaks of the Sequence Warn You
The first objective warning in any uptrend is a low that undercuts the prior low. Using the ladder above, if price falls through 101 after printing 106, the pattern has its first crack. Buyers did not step in earlier this time. They let the old floor go.
One broken low is caution, not a verdict. Trends sometimes make a single deep pullback, shake out weak holders, and resume. What you do is tighten your attention and wait for the next swing high.
If that next rally stalls below 106, you now have a lower high sitting on top of a lower low. The sequence has flipped. Both sides of the ladder are now descending, and the uptrend is over until a new sequence of higher highs and higher lows forms.
This gives you a clean two-stage framework. Broken low equals warning. Broken low plus lower high equals trend change. You never have to guess or argue with the chart. You wait for the prints.
The discipline cuts both ways. As long as the sequence holds, pullbacks are normal behavior inside an uptrend, not reasons to panic. Traders who exit every dip never hold anything long enough to benefit from the trend they correctly identified.
A Price Ladder From 100 to 106
Here is a hypothetical walk through a full sequence, swing by swing. Round numbers, no news, just structure.
100 to 104. Price rallies from 100 and stalls at 104. Sellers appear at 104 and push price down. You now have your first swing high. Nothing is proven yet; one high is just a high.
104 to 101. Price pulls back and finds buyers at 101. This is your first swing low. The pullback gave back three points, which is normal. What you watch now is where the next rally goes.
101 to 106. Price rallies through 104 and reaches 106 before stalling. This is the moment the uptrend is born. The rally exceeded the prior high, so 106 is a higher high. Buyers were strong enough to absorb every seller who stopped price at 104 last time.
106 to 103. Price pulls back and holds at 103. This is the most informative print in the whole sequence. Buyers stepped in two points above the old low at 101. They paid more, earlier, without being forced to. The low at 103 confirms the higher low, and the uptrend is now defined: 101 to 103 on the lows, 104 to 106 on the highs.
What comes next. If price rallies past 106, the sequence extends and the trend continues. If price instead falls through 103, you have your warning. If it then fails to reclaim 106 on the next rally, the trend is done. Every outcome has a pre-defined meaning, which is the point of reading structure this way.
Common Misreads
Real charts are messy. Textbook ladders with perfectly spaced swings exist mostly in textbooks. On live charts you will see minor lows nested inside major swings, and treating every wiggle as structural will exhaust you.
A one-hour chart of a daily uptrend will show dozens of small highs and lows. Most of them are noise relative to the larger sequence. If you count every minor dip as a broken low, you will call the trend dead ten times before it actually ends.
The timeframe decides which lows count. A swing low on the daily chart is a structural point. A swing low on a five-minute chart during the same period is usually just intraday traffic. Pick the timeframe that matches your holding period and read the sequence there.
Another common error is demanding perfection. A higher low that comes in a fraction above the prior low still counts. A higher high that clears the old high by a tick still counts. Structure is about the order of prints, not the elegance of the spacing.
Finally, do not confuse a pause with a break. Price can drift sideways for weeks, printing roughly equal highs and lows, without breaking the sequence. That is consolidation, not reversal. The warning only triggers when a prior low actually gives way.
A Short Checklist for an Intact Uptrend
Before you treat any market as trending up, run through this list:
- Identify the last two swing lows. The recent one must sit above the earlier one.
- Identify the last two swing highs. The recent one must sit above the earlier one.
- Confirm the timeframe. The swings you are reading should match your intended holding period.
- Mark the most recent higher low. That level is your line. A break below it is the first warning.
- Mark the most recent higher high. A rally that fails below it, after a broken low, confirms the trend change.
- Ignore minor swings inside the major ones. Only structural prints count.
If all six checks pass, the uptrend is intact and pullbacks are opportunities to study, not threats. If the first check fails, you no longer have an uptrend to trade, and the honest move is to stand aside or reassess.
Questions About Higher Highs and Higher Lows
Do higher highs matter more than higher lows?
No, and if anything the lows matter more. Higher lows show buyers accepting higher prices on pullbacks, which is where conviction gets tested. Higher highs are the visible result, but the rising lows are the foundation the result stands on.
What if price makes a higher high but a flat low?
That is a warning sign, not a clean uptrend. A flat low means buyers did not step in any earlier than last time, so demand is not strengthening even though price pushed to a new high. Treat the trend as intact but weakening, and watch the next pullback closely.
Which timeframe should I read the sequence on?
Read it on the timeframe that matches your intended holding period. A swing trader holding for weeks reads the daily chart; a day trader reads the hourly. Reading a lower timeframe than your holding period produces false alarms, and reading a higher one leaves you blind to real changes.
How many swings make a trend?
Two of each is the minimum: two higher lows and two higher highs. One higher high alone proves nothing, because a single push can be a random spike. Once the second higher low prints after the second higher high, you have a defined sequence with levels you can trade against.
Once this sequence reading becomes habit, the next skill is applying it across timeframes at once: the daily trend giving context, the hourly giving entries. That is where structure reading turns into actual trade planning.