What Keeps an Uptrend Alive
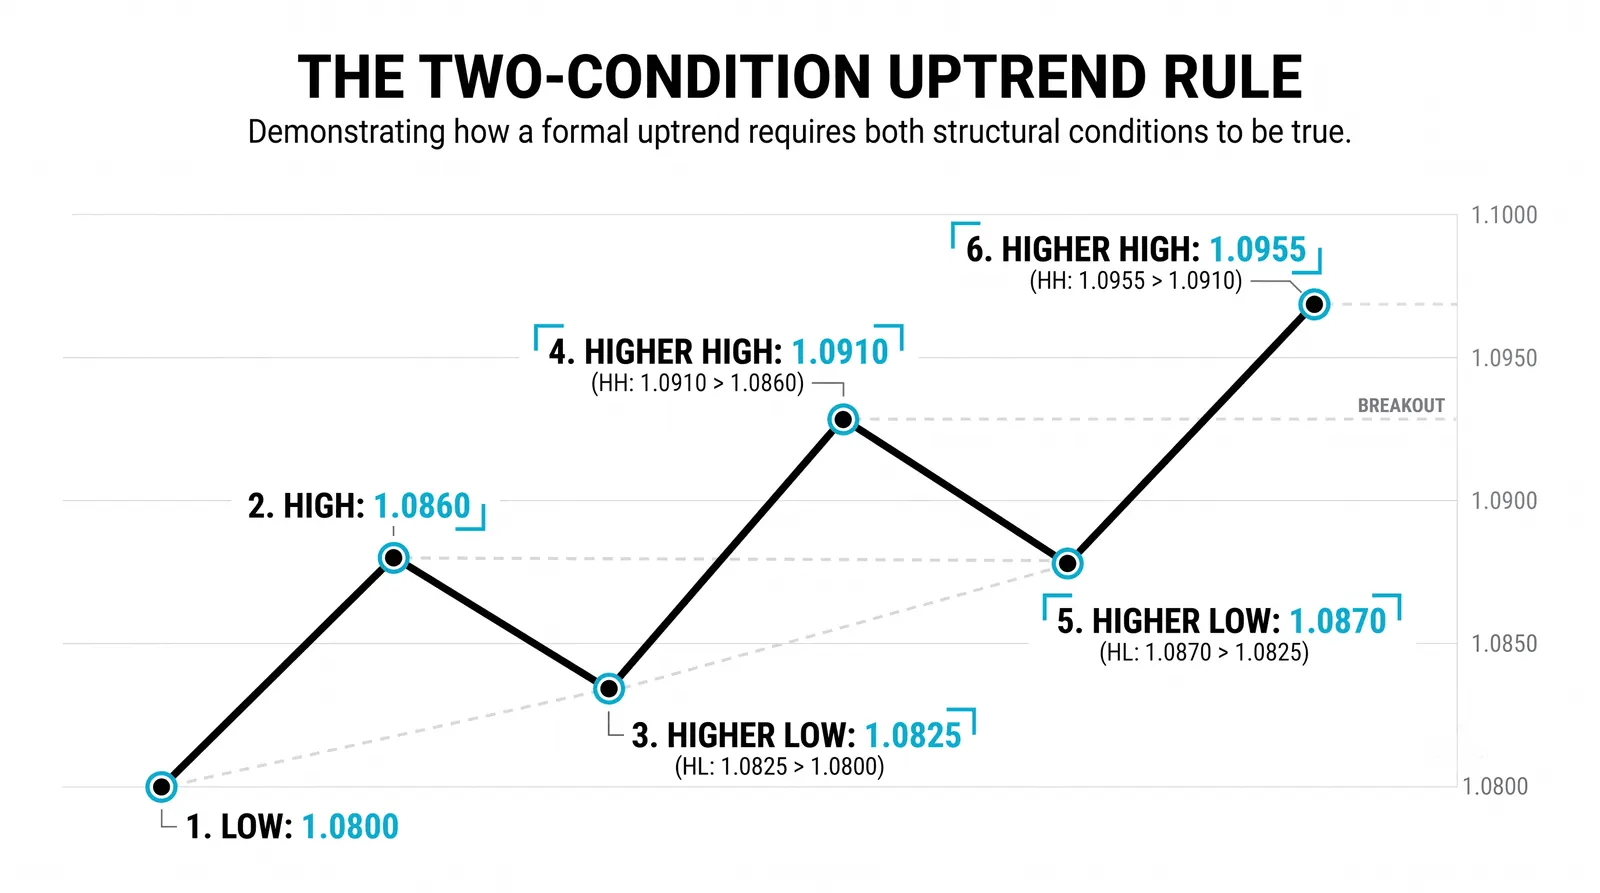
An uptrend stays alive as long as each rally prints a higher high and each pullback prints a higher low. The moment that rhythm stops, the uptrend is on notice, long before any indicator catches up. You already know what higher highs and higher lows are, so this lesson is about the rules around them: what keeps the structure valid, what healthy looks like, what tired looks like, and the exact prints that end it.

Think of it like hammering a nail: strike, small pause, strike. The rhythm itself is the proof the work is going forward.
The Two Phases Inside Every Uptrend
Every uptrend is built from two alternating phases. Impulse legs carry the move upward. Corrective pullbacks give it room to breathe.
Impulses are decisive. Price covers ground quickly, candles close near their highs, and dips get bought within the session. Buyers are in a hurry and sellers are scarce.
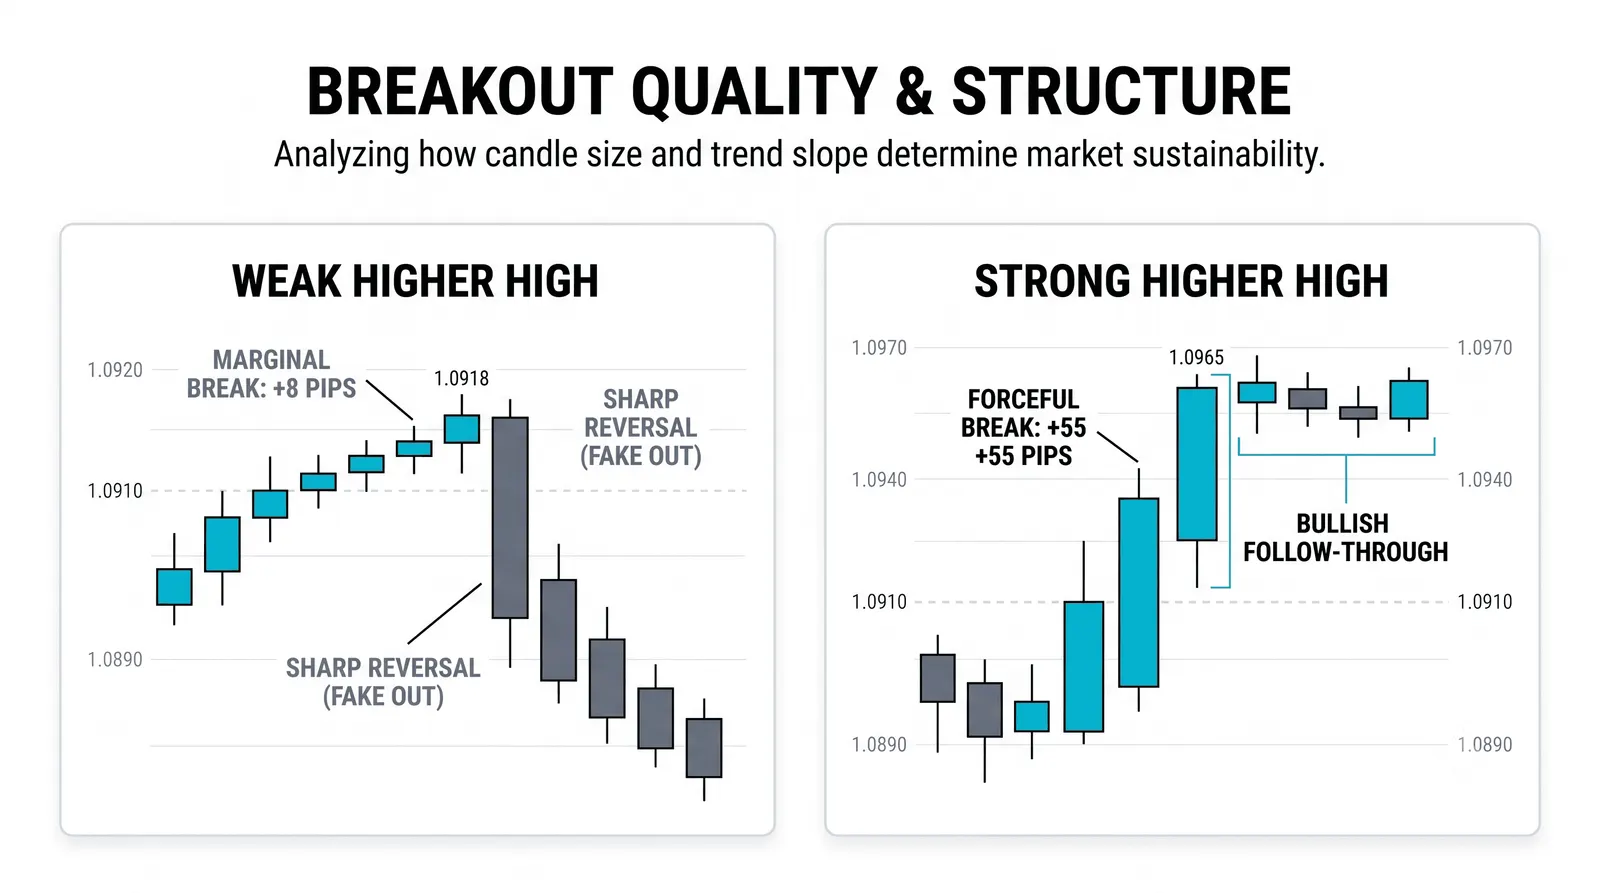
Corrections are the opposite temperament. They are slower, messier, and full of overlap. Price drifts sideways to down, candles get smaller, and the move feels like it is going nowhere. That messiness is normal. A correction is profit-taking and hesitation, not a reversal, as long as it respects the rules below.
Learn to read the character of each phase, and what that character is telling you. A pullback that looks like an impulse in reverse, fast and aggressive, is telling you something has changed.
The Rules That Keep It Valid
An uptrend is valid while three conditions hold:
- Each swing high is higher than the previous swing high.
- Each swing low is higher than the previous swing low.
- Every correction holds above the prior swing low.
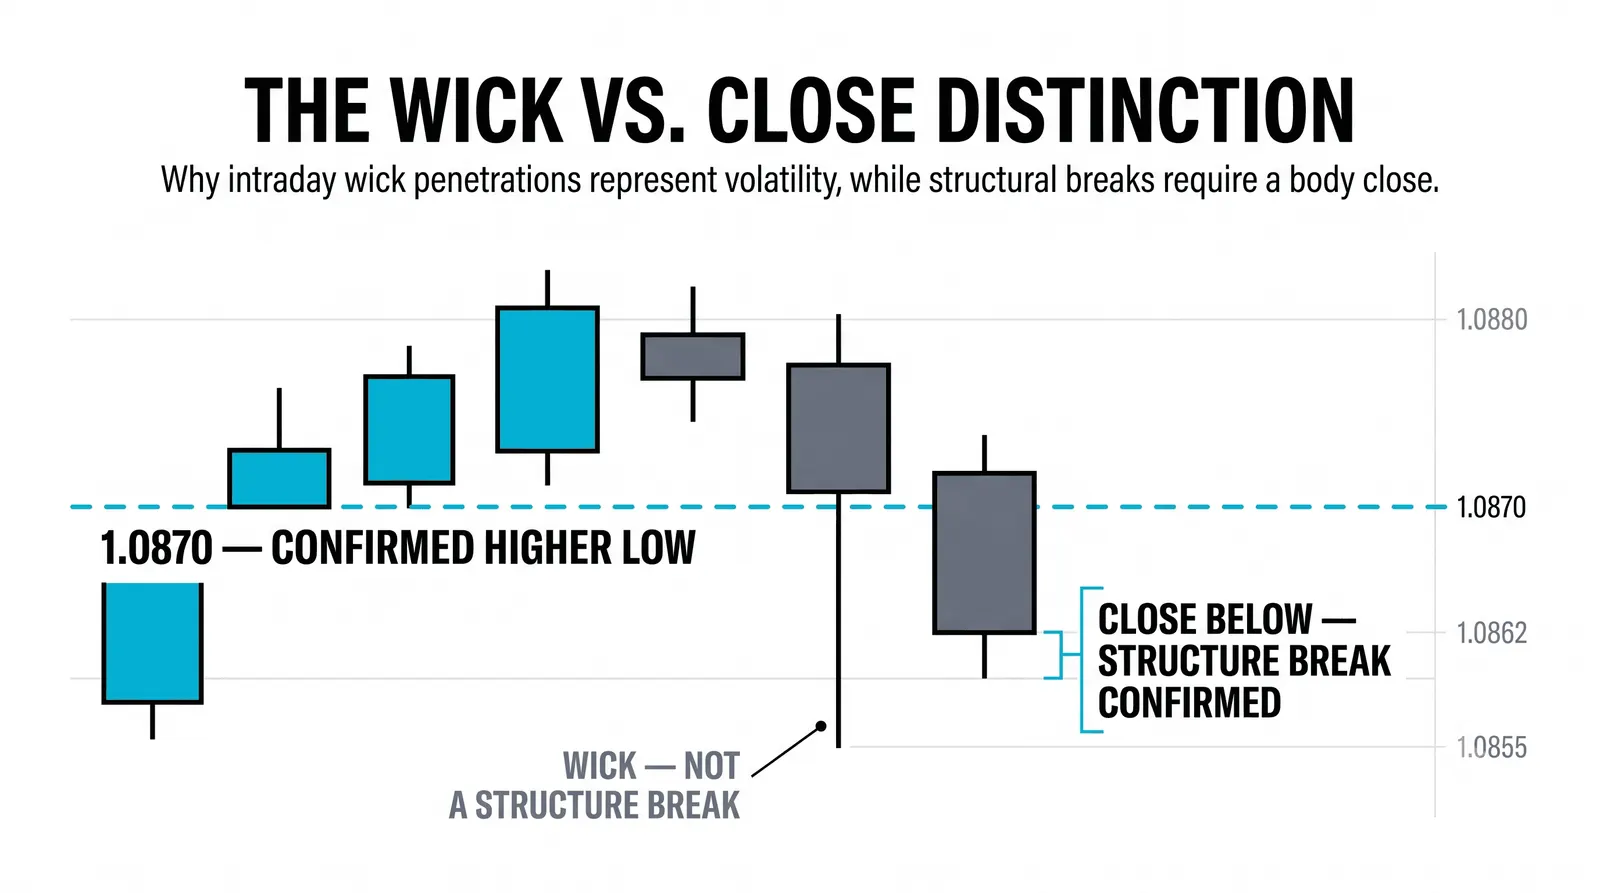
The third rule is the one traders break most often. A pullback can be deep, ugly, and slow, and the uptrend survives all of it. What it cannot survive is a close through the last higher low. That close is the first formal warning. It does not prove the trend is over, but it means the structure that defined the trend has been violated, and your job shifts from looking for longs to watching what happens next.
One intraday poke below the level that snaps back is noise. A close below it is information.
What a Healthy Uptrend Looks Like
Healthy uptrends are boring in a specific way: they repeat themselves.
Corrections last roughly the same length as each other. If the first two pullbacks took four to six sessions, the third one taking five is fine. Rhythm matters more than exact counts.
Volume and participation stay steady. Rallies come on decent activity, pullbacks come on lighter activity. That pattern says buyers are committed and sellers are not.
Pullbacks end near old levels. A correction that stalls right around the prior breakout or an old swing high is showing you that former resistance is doing its new job as support. That is the market confirming its own structure.
What a Tired Uptrend Looks Like
Trends rarely die in one candle. They wear out first, and the wear is visible if you know where to look.
Impulse legs get shorter. The first rally covered twelve points, the next eight, the latest four. Buyers are still winning, but by less each time.
Corrections get deeper and choppier. Pullbacks that used to give back a third of the prior rally now give back half or more, and they take longer doing it.
Rallies need more effort for less distance. Bigger volume, wider candles, more days, and a smaller net gain. Effort without result is one of the oldest warnings in tape reading.
None of these signs ends the uptrend by itself. They tell you to tighten your standards, not to short. The trend is guilty only when the structure breaks.
How an Uptrend Ends
The end comes as a sequence, and the order of the prints matters.
First, price closes below the last higher low. That is the warning. Second, the next rally fails to make a new high, printing a lower high. Third, price rolls over and takes out the low again, printing another lower low. At that point the sequence has flipped: lower highs and lower lows, which is a downtrend by definition.
The top is a process, not a candle. Traders who wait for the full sequence avoid shorting healthy pullbacks. Traders who act on the first warning protect profits early. Both are defensible. What is not defensible is ignoring the prints because you like the story.
One Uptrend, Five Swings
Here is a hypothetical stock with clean round numbers. Walk each leg and label it.
Swing 1: Price rallies from 40 to 46. Impulse. Six points, presumably fast and decisive.
Swing 2: Price pulls back to 43.50. Correction. It gives back 2.50 of the 6-point rally, holds well above the 40 starting point, and prints the first higher low.
Swing 3: Price rallies to 52. Impulse. A new higher high, six points above the old high at 46. Structure confirmed.
Swing 4: Price pulls back to 48. Correction. It holds above the prior swing low at 43.50 and, notably, above the old high at 46. Old resistance acting as support. Second higher low printed.
Swing 5: Price rallies to 57. Impulse. Third higher high. The uptrend is fully valid: highs at 46, 52, 57 and lows at 43.50, 48.
Now the levels that matter going forward. A close below 48 puts the last higher low at risk. That is the formal warning, and it means you stop buying pullbacks until the structure re-proves itself. A close below 43.50 breaks the structure outright, because price has now traded under two successive swing lows and the higher-low sequence is dead.
Notice what you did not need for any of this: an oscillator, a moving average cross, or a headline. Five swings and two price levels told you the trend's status and exactly where you would be wrong.
Uptrend Health Checklist
| What to Check | Healthy Sign | Warning Sign |
|---|---|---|
| Swing rhythm | Corrections last roughly the same length each time | Pullbacks stretch longer with each cycle |
| Depth of pullbacks | Corrections give back a third to half of the prior rally | Corrections retrace most of the prior rally |
| Speed of rallies | New highs come quickly and with little overlap | Rallies grind, overlap, and need more days for less distance |
| Behavior at old highs | Old resistance holds as support on pullbacks | Price slices back through old highs without pausing |
Questions About Uptrend Structure
How many swings make it a real uptrend?
Two higher highs and two higher lows are the minimum. One higher high and one higher low is just a bounce off a low; it proves nothing yet. By the second full cycle you have a rhythm you can measure future swings against.
Does an uptrend need a specific angle?
No. Steep trends and shallow trends are both valid if the swing sequence holds. Steep trends tend to correct violently and shallow trends tend to die quietly, but the rules for both are identical: higher highs, higher lows, corrections above the prior swing low.
Can a pullback go below the old low and survive?
An intraday dip below that closes back above can survive, especially on a stop-run that reverses hard. A close below the prior swing low is different. Treat that as the warning it is, and demand a new higher high before trusting the trend again.
When should I stop looking for longs?
Stop the moment price closes below the last higher low. That single print does not confirm a downtrend, but it removes your reason to buy pullbacks, because the pattern you were buying no longer exists. Resume only after the market prints a new higher low and a higher high, or after a clear downtrend gives you a different trade entirely.
Once you can grade an uptrend's health from its swings alone, the next skill is reading that same structure across two timeframes at once, so the pullback you are buying on one chart is not the breakdown on another.