What Are Harmonic Patterns and How They Work
Harmonic patterns are fibonacci ratios grouped into named shapes, where each point in the shape must sit at its assigned ratio or the shape is void. The retracement and extension lessons taught the single lines; this lesson is the bridge into the named shapes, how individual ratios become patterns and what the naming tradition owes to fibonacci.

Think of letters combining into words: each letter means little on its own, and the meaning arrives only when the sequence is exact, one wrong letter and the word becomes another word. A pullback to 38.2 percent is a letter. A pullback to 38.2 percent followed by a rally to a specific extension and a final point on a measured ratio is a word. The shape only exists when every point obeys its gate.
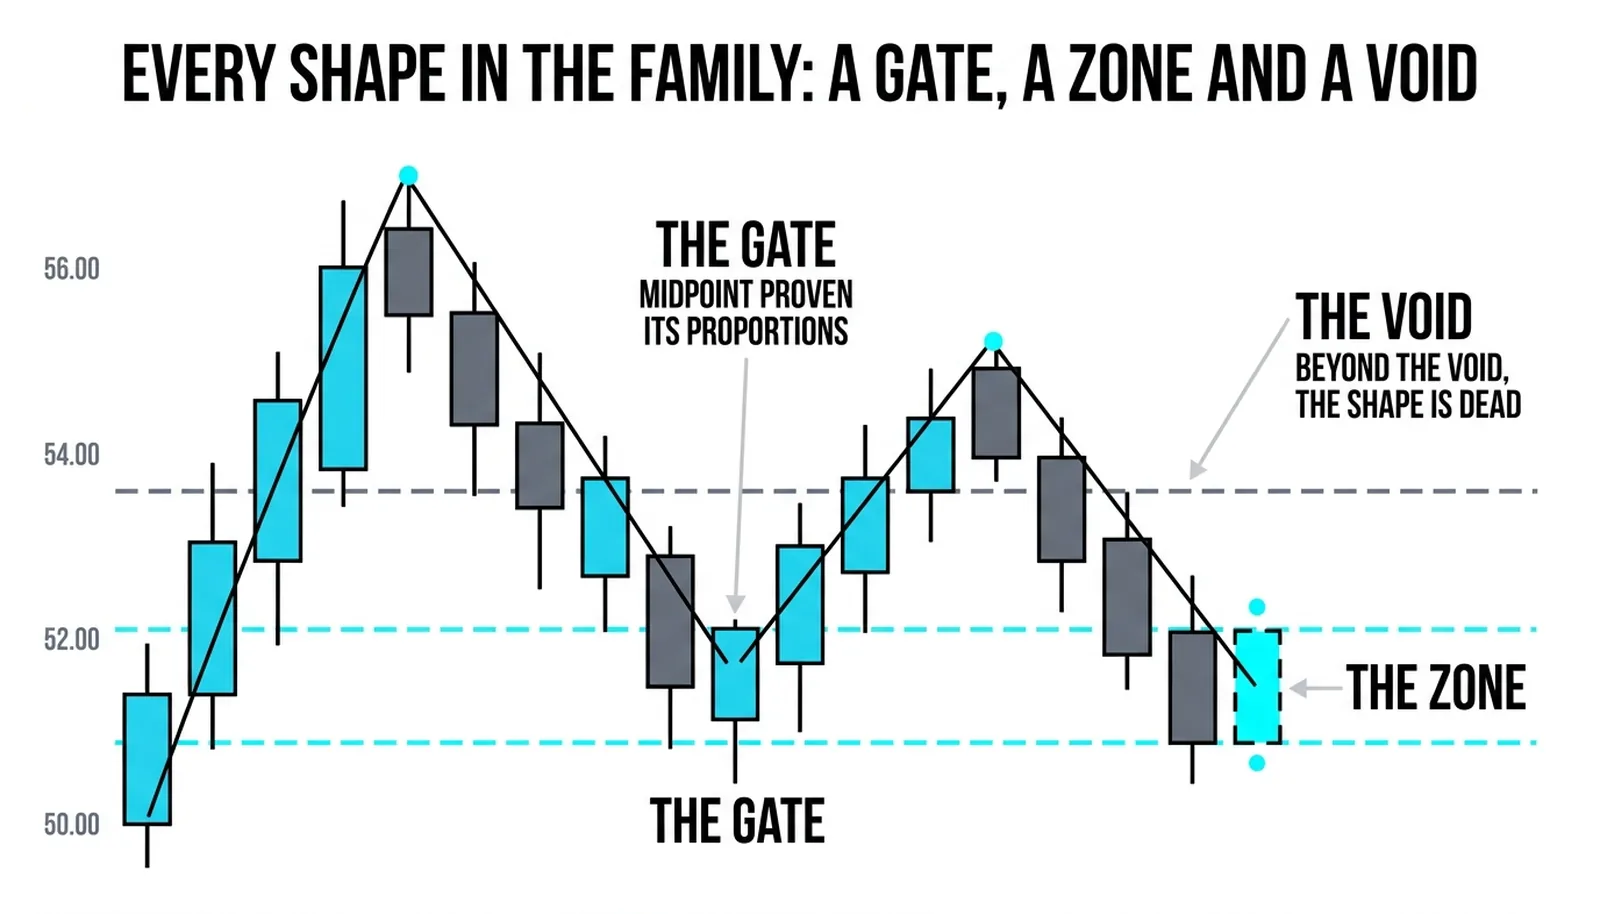
The Shared Anatomy
Every pattern in the family is built from the same parts: an initial leg, a pullback, a correction, and a final point that lands on a measured ratio. The labels change from pattern to pattern, but the skeleton does not. Learn the skeleton once and every member of the family is a variation you already understand.
The anatomy has three working parts, and each has a job:
- The gate. The pullback depth that admits the pattern. If the first retracement runs past its assigned ratio, the drawing is disqualified before it begins.
- The zone. The measured price area where the final point must land. This is where the trade happens, built from overlapping fibonacci lines.
- The void. The price that kills the drawing. A close beyond it means the pattern is finished and any position built on it is wrong.
The gates and zones are all fibonacci retracements and extensions of the same legs. That is why the family carries the name harmonic: the ratios repeat across the structure the way a note repeats across an octave, the same proportion heard at different scales. A 38.2 percent retracement of the whole swing and a 61.8 percent retracement of the final leg are the same mathematics applied twice.
This repetition is the practical strength of the approach. Two independent measurements of two different legs agreeing on one price area is real information. The name attached to the shape adds nothing to that.
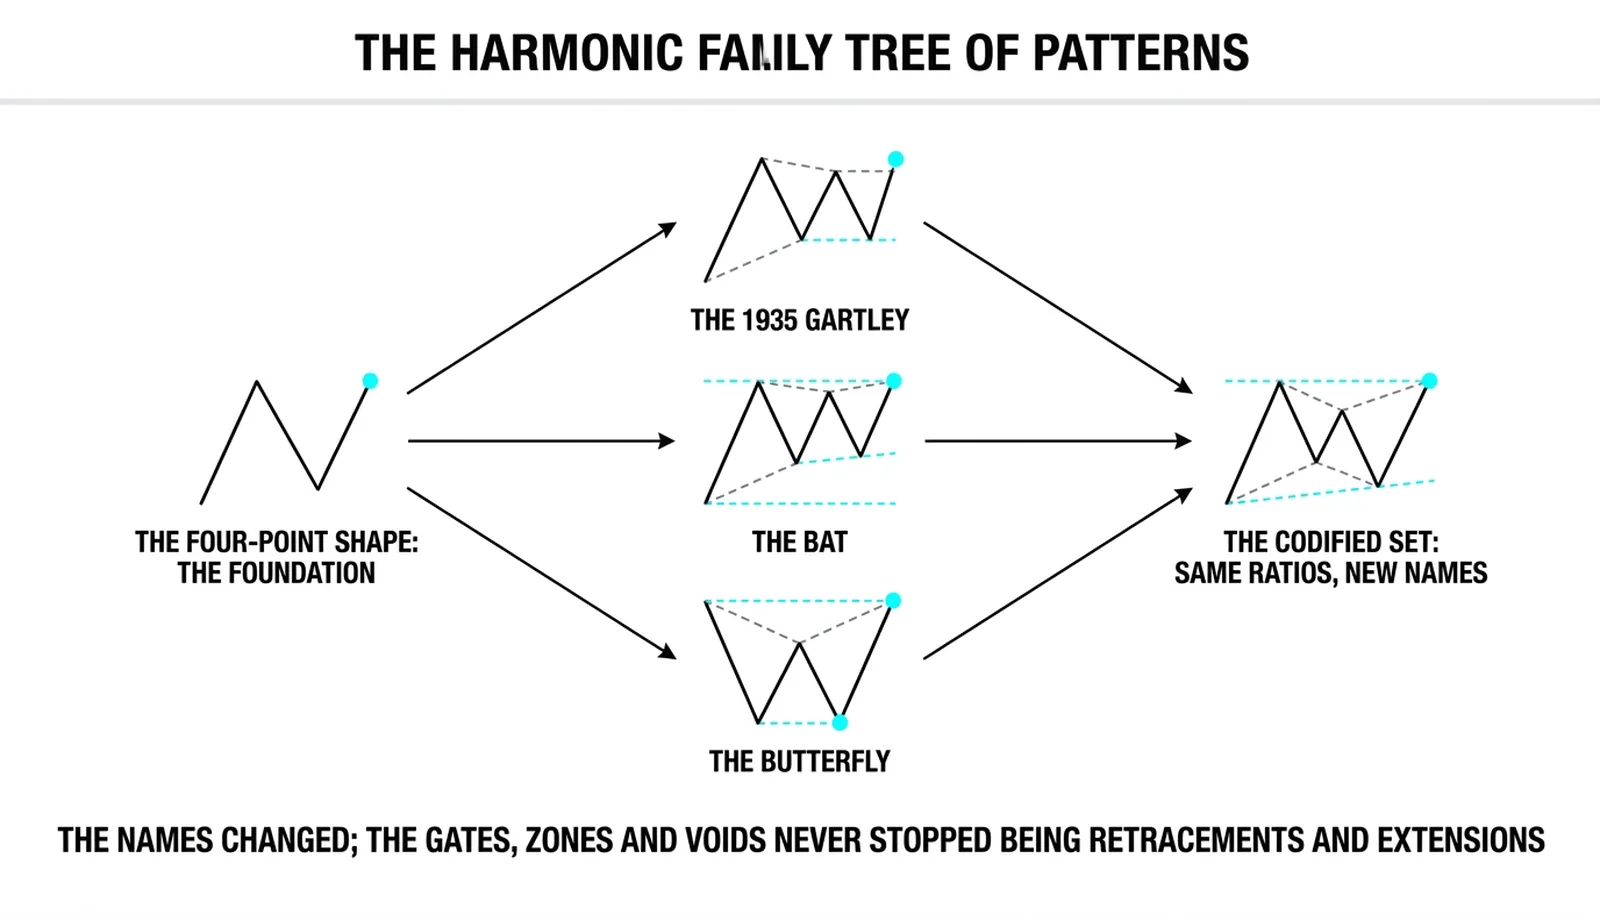
The Naming Tradition
The family tree runs from the simplest four-point shape through H.M. The pattern's original 1935 drawing to the codified set harmonic trading doctrine organized decades later: the bat, the butterfly, the crab, and the rest. The pattern's original description published the measured structure in a work on stock market profits, and harmonic trading doctrine later assigned precise fibonacci ratios to each point and gave the variants their names. Every pattern since is a refinement of that lineage.
The simplest ancestor is the four-point shape: an impulse leg, a pullback, a second leg, and a final reversal point. Add tighter ratio requirements and the shape earns a name. Loosen one gate and it becomes a different named relative. The entire canon is one skeleton wearing different tolerances.
Now the honesty, stated plainly. The shapes were named by practitioners, not discovered in academic literature. The vocabulary sounds older and more established than the evidence base is. There is no peer-reviewed proof that a bat outperforms an unnamed two-ratio cluster at the same prices. The value lives in the gates and zones, which are disciplined fibonacci work, and not in the lore wrapped around them.
This matters because traders routinely pass on clean setups that fail to match a named template, and take weak setups because the template matched. That is backwards. A zone built from two independent measured lines is valid whether or not it earns a name. A named shape with a sloppy gate is invalid no matter how famous the name.
The Zone at 104.72
Here is a plain two-ratio cluster with no named shape attached. All numbers are hypothetical and invented for illustration.
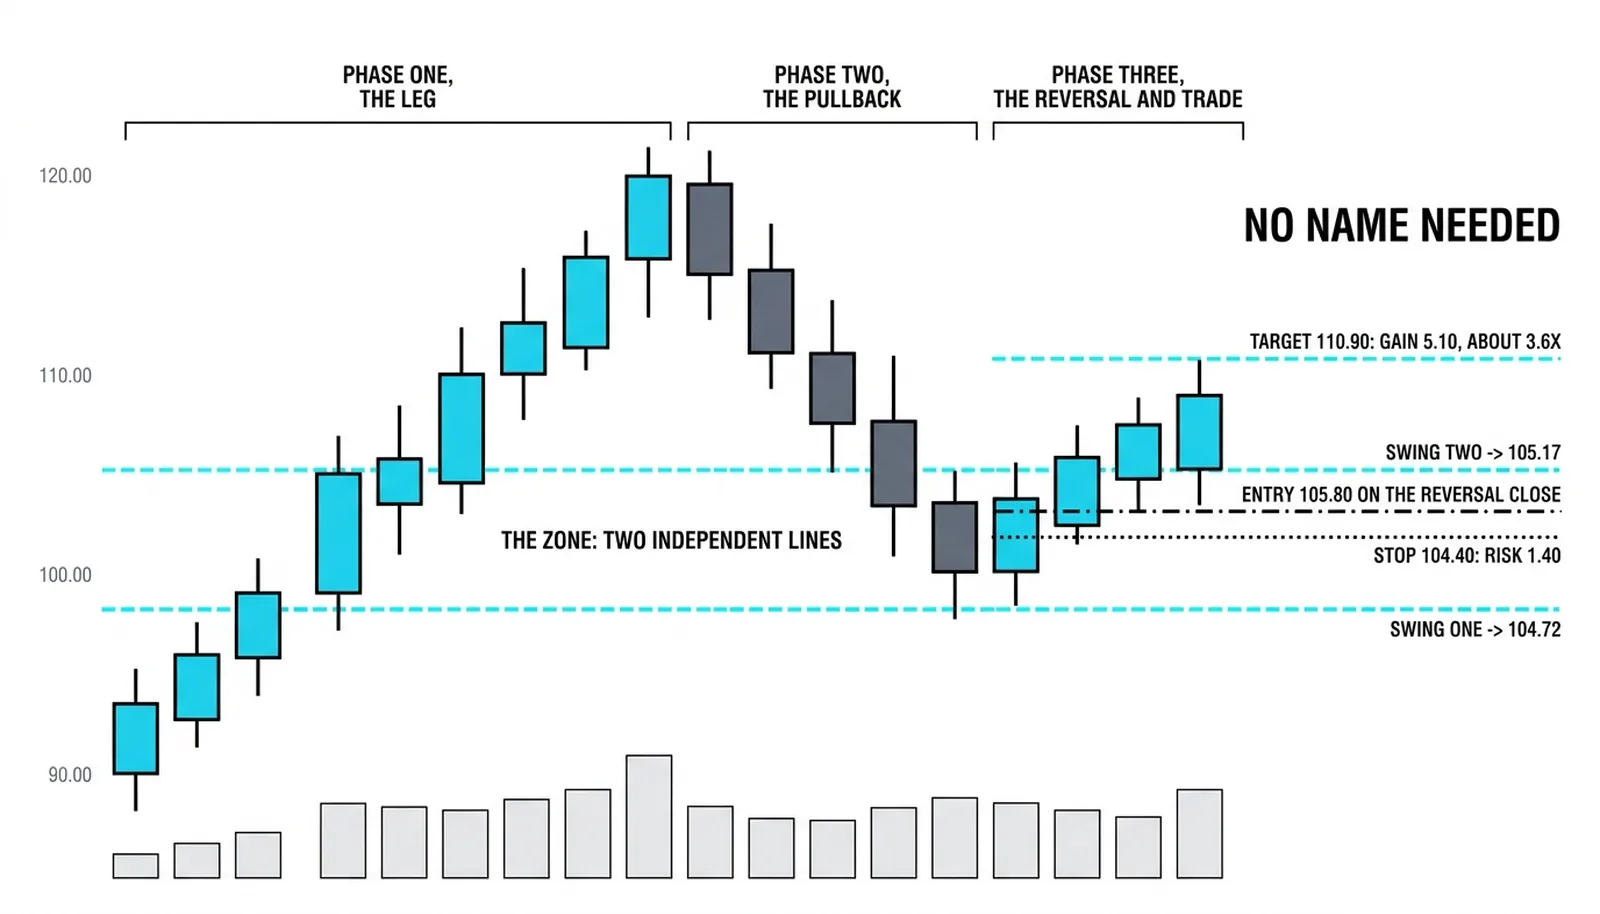
A swing runs 40.00 points, from 80.00 up to 120.00. Its 38.2 percent retracement sits at 104.72. The final leg alone runs 24.00 points, from 96.00 to 120.00, and its 61.8 percent retracement sits at 105.17. Two measurements of two different legs produce a zone from 104.72 to 105.17, a band less than half a point wide.
Price pulls back to 105.30, inside the zone's margin, and a reversal candle closes at 105.80. The trade is straightforward:
- Entry: long at 105.80, on the reversal close.
- Stop: 104.40, below the bottom of the zone. Risk is 1.40.
- First target: 110.90, a gain of 5.10, roughly 3.6 times the risk.
Notice what the trade needed. Two independent fibonacci lines agreeing on an area, a reversal close confirming buyers appeared there, and a void level below the zone defining the risk. Nothing else. The same prices would earn a name from one practitioner's chart and no name from another's, and the outcome would be identical either way.
Now the failed version. Price does not reverse. It closes at 104.20, below the 104.72 gate and below the stop. The drawing is void. No pattern vocabulary changes what that close means, and no trader who respects the void is still holding the long. The discipline is the product. The names are decoration.
| The Part | Question It Answers | Ratio Behind It | What Breaks It |
|---|---|---|---|
| The gate | Is this pullback the right depth to admit the pattern? | 38.2 percent of the full swing | A retracement running past the assigned ratio |
| The zone | Where should the final point land? | 61.8 percent of the final leg, overlapping the gate line | Price slicing through without a reversal close |
| The void | Where is the idea proven wrong? | Beyond the outer edge of the zone | A close past it, such as 104.20 in the example |
| The target | Where does the trade pay? | A measured extension back toward the prior high | Nothing, it is an objective, not a condition |
Harmonic Questions, Answered
What are harmonic patterns?
Harmonic patterns are fibonacci ratios grouped into named shapes, where each point must sit at its assigned ratio or the shape is void. They combine retracements and extensions of the same legs into a structured setup with a defined entry zone and a defined invalidation price.
Do harmonic patterns come from fibonacci?
Yes, entirely. Every gate and zone in the family is a fibonacci retracement or extension of a leg in the structure. The name harmonic refers to the same ratios repeating at different scales of the same price move.
Who discovered the harmonic patterns?
H.M. The pattern's original description published the measured structure in 1935, and harmonic trading doctrine later codified the family by assigning precise ratios and names to the variants. The shapes were named by practitioners, not established by academic research, so treat the canon as organized experience rather than proven law.
Do you need the names to trade the zones?
No. The worked example above used two independent fibonacci lines and a void level, with no named shape at all, and nothing about the trade suffered for it. The names are a filing system; the gates, zones, and voids are the method.
Next, the cluster practice moves underneath the zones themselves: how to read the order activity that forms inside a measured band, and how to tell genuine absorption from a pause before the void gives way.