Fibonacci Clusters: One Zone, Many Lines
Fibonacci clusters are several independent lines, drawn by different tools from different swings, that land inside the same narrow band of price. A single retracement line is a guess. Three lines from three unrelated measurements agreeing on the same few cents is something else entirely, and that agreement is what this lesson teaches you to find, count, and trade.

Picture several bus routes that never share a single street, all stopping at the same corner inside the same minute: the corner is far more interesting than any one route. Price works the same way. When a 38.2 percent retracement of one leg, a 50 percent retracement of another leg, and an old resistance shelf all point at nearly the same number, the market is telling you that corner matters. Your job is to be waiting there.
The earlier confluence lessons stacked retracements from different timeframes, and that foundation still stands. This lesson widens the practice: retracements, extensions, projections, and old highs or lows from any tool can all join the same zone, and the count of independent sources sets the weight of the trade.
Collecting the Lines
The method, taught in its standard order, is mechanical. Run every measurement the swings on your chart offer. Retracements of the major legs at 38.2, 50, and 61.8 percent. Extensions of the completed legs. Projections of prior swings laid over the current one. Then write down only the prices where two or more calculations land within a few cents of each other.
Everything else gets discarded. A chart with forty lines on it is not analysis; it is noise with good branding. The discipline of the cluster method is subtraction: the measurements are cheap, the coincidences are the product.
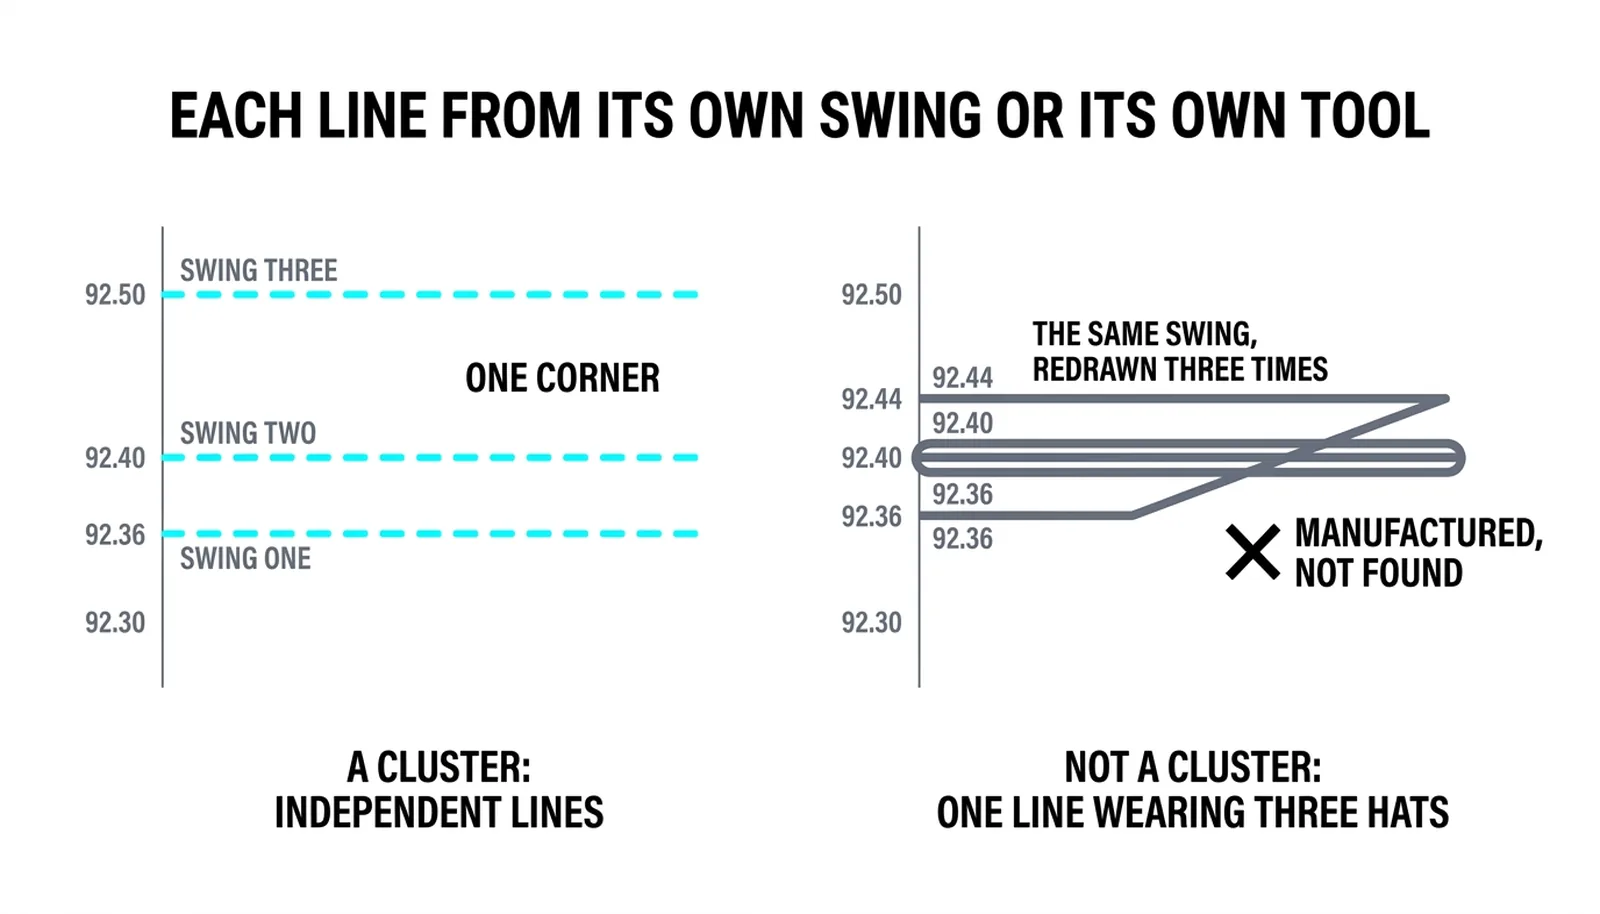
The word independent carries the whole method. Each member of a cluster must come from a different swing or a different tool. A trader who redraws the same swing three ways until three lines agree has manufactured agreement, not found it. That is grading your own homework, and the market does not accept self-graded work.
A quick test keeps the practice honest. For each line in the zone, ask: which swing produced this, and is that swing different from the one that produced the line next to it? If the answer is no, the two lines count as one.
The Count Sets the Weight
Two independent lines make a zone. Three make a landmark. The difference is not decoration; it changes how you size, where the stop sits, and how much of your week you plan around the level.
The width rule keeps the count honest. A two-line cluster earns a zone a few cents wide. A three-line agreement inside twenty cents is rare enough to plan a week around. If your lines are spread across two full points, you do not have a cluster; you have a spread, and spreads do not give you stops.
The price action canon frames the reason in one idea: each independent crowd that acted at a price leaves a memory there. Buyers who defended a level remember it. Sellers who took profit there remember it. A cluster is several crowds' memories stacked at one shelf, which is why the reaction is likelier and the stop can sit closer than it could under a single line.
That closeness of the stop is the real payout. A tighter invalidation point means the same risk capital buys a larger position, or the same position risks less. The cluster does not raise the chance of winning by magic; it improves the arithmetic of the trade.
- One line: an idea, no trade on its own.
- Two independent lines within a few cents: a working zone.
- Three independent lines within twenty cents: a level worth structuring the week around.
- Four or more: rare, and worth patience while price travels to it.
The Cluster at 92.36
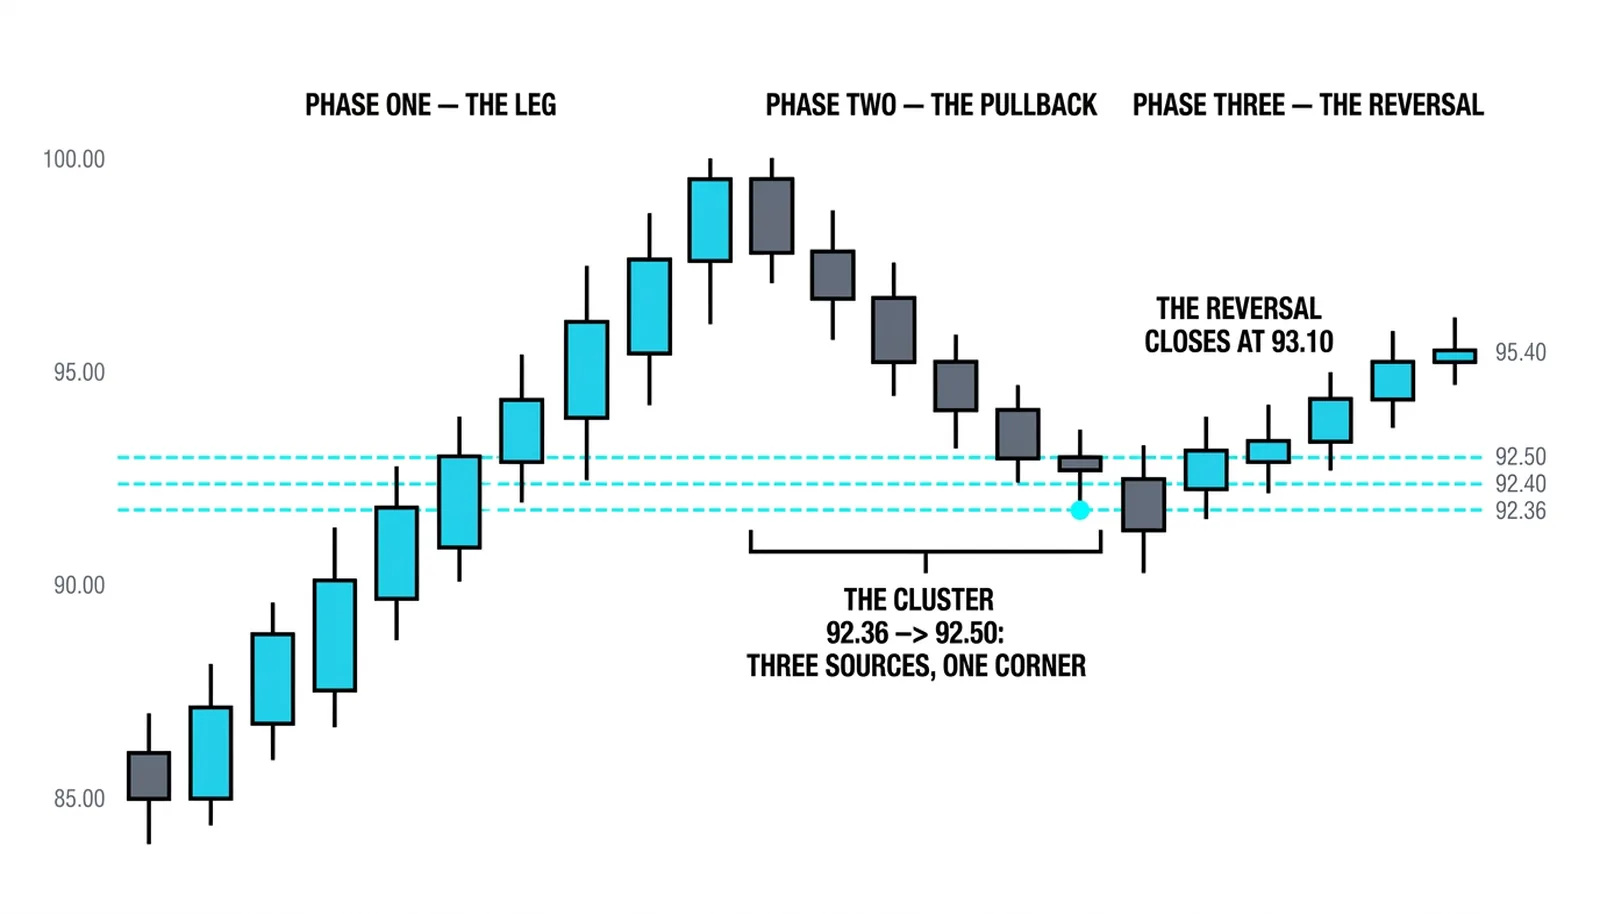
A hypothetical example, all numbers invented and round. The larger swing runs 20.00 points, from 80.00 up to 100.00. Its 38.2 percent retracement sits at 92.36.
A second swing, from a different leg entirely, runs from 84.80 to 100.00. Its 50 percent retracement sits at 92.40. An old resistance shelf from months ago, a level where price stalled and reversed three separate times, stands at 92.50.
Three independent sources, one band: 92.36 to 92.50. Fourteen cents wide. That is a cluster, and it earns a plan.
| The line | The tool that drew it | The price | The weight it adds |
|---|---|---|---|
| 38.2% retracement | Fibonacci retracement, 80.00 to 100.00 swing | 92.36 | First independent source; defines the lower edge |
| 50% retracement | Fibonacci retracement, 84.80 to 100.00 swing | 92.40 | Second independent source; confirms the zone |
| Old resistance shelf | Horizontal level from prior price history | 92.50 | Third independent source; caps the zone and adds crowd memory |
| Cluster zone | All three combined | 92.36 to 92.50 | Full weight; trade location, stop reference, and plan anchor |
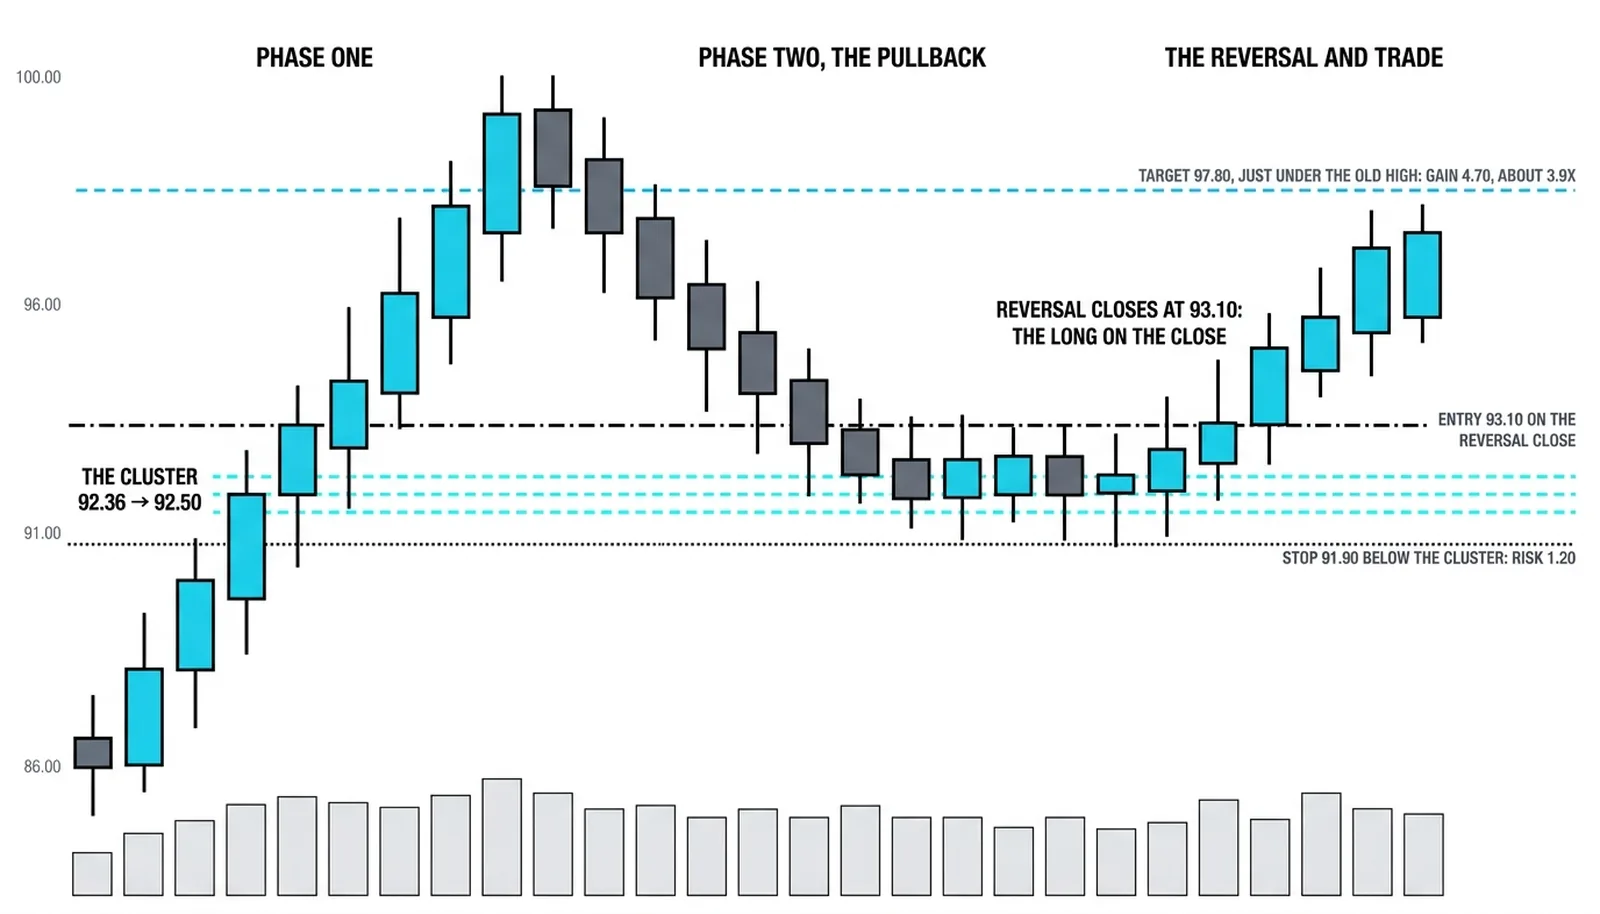
Price pulls back into the band. A reversal candle forms and closes at 93.10, back above the cluster. That close is the trigger, because the trade needs the market to agree with the zone before money goes in.
The long is taken at 93.10. The stop sits at 91.90, below the entire cluster, risking 1.20 per unit. The first target is 97.80, just under the old high at 100.00 and in front of where sellers are likely to return, for a gain of 4.70. That is about 3.9 times the risk.
Notice what the cluster actually did. It located the trade and it tightened the stop. Without the zone, the same bullish idea might have been entered anywhere between 93 and 96 with a stop under 90, and the reward-to-risk would have been ordinary. The three lines did not predict the rally; they made the trade cheap to be wrong about.
Now the failed version, because it happens. Price enters the cluster, pauses, and then closes at 91.70, below the whole zone. The trade is out at the stop for a 1.20 loss, and the cluster is finished as a reference. Three independent lines raised the odds of a reaction, and the reaction still belonged to the market.
Blunt truth: a cluster is a location, not a promise. The trader who responds to that failed close by redrawing swings until more lines agree has stopped measuring and started lobbying. The practice of fibonacci cluster practice survives losing trades because the losses are small, pre-defined, and honest.
Cluster Questions, Answered
What is a fibonacci cluster?
A fibonacci cluster is a narrow price band where two or more independent Fibonacci-based measurements, or a measurement plus a structural level like an old high, land within a few cents of each other. The independence of the sources is the definition; one swing redrawn three ways is one source.
How many lines make a strong cluster?
Three independent lines make a strong cluster. Two lines make a usable zone worth watching, three make a landmark worth planning around, and anything beyond three is rare enough to treat as a major level for the weeks ahead.
How close do the lines need to be?
The lines need to sit within a few cents of each other relative to the instrument's normal movement. A practical rule: the whole zone should be tight enough that a single stop placed just beyond it risks a small, defined amount. If the band is too wide for one stop, it is not one cluster.
Can a cluster fail?
Yes, and it fails in a specific way: price closes cleanly beyond the entire zone. That failure is information, not betrayal. The cluster located the trade and capped the risk; a close through it, like the 91.70 close in the example, ends the idea at a small, known cost, and the trader moves on without redrawing anything.
Next in this level, the harmonic ancestry begins: the simplest measured-move shape, then the Gartley, built on the same swing-measuring discipline you just practiced here.