Key Fibonacci Extension Levels
The key fibonacci extension levels are the 127.2, the 161.8, and the 261.8 percent projections beyond the old extreme, and each one carries a different job. The 127.2 is the first realistic objective after the break. The 161.8 is the projection a healthy trend can reach. The 261.8 is the climax zone where the smart money is already leaving.

Think of them as milestone markers on a long route, each one further out than the last, each one with its own reason for mattering, and no traveler obliged to reach them all. The previous lesson defined the projection itself and separated it from the retracement measurement. This lesson names the levels and ranks them by what they are worth.
The Three Levels That Matter
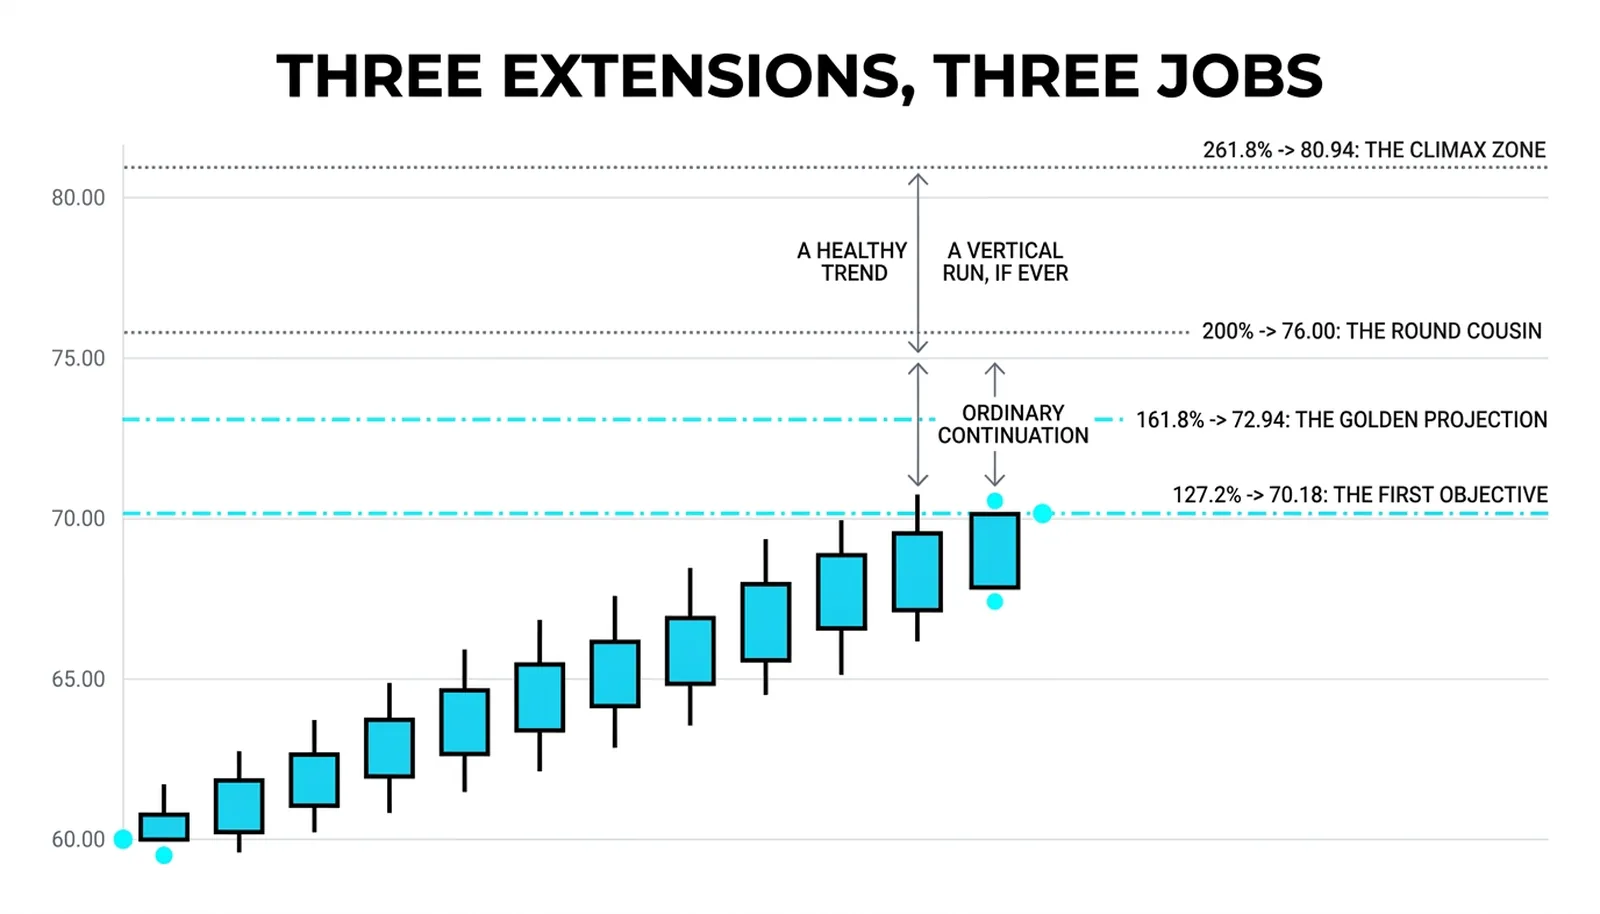
The 127.2 percent extension is the first objective. It sits close enough to the old extreme that ordinary continuation reaches it, which is why it gets hit more often than any other level in the family. Breakout traders and disciplined runners take partial profits there. It is the working level, the one that pays the bills.
The 161.8 percent extension is the golden projection. It equals the prior leg stretched by the ratio the whole toolkit is built on, and a trend in good health can reach it. Trend traders let profits work toward this level because it represents a full, confident extension of the move rather than a timid first step.
The 261.8 percent extension is the climax zone. Only runs that have gone vertical get there. The honest response at 261.8 is to sell into strength rather than admire it, because the odds of immediate continuation are at their worst exactly where the excitement is at its peak. Price that has traveled two and a half times the prior leg beyond the old high has spent most of its fuel.
The 200 percent level deserves one line. It is the round-number cousin, watched by the same crowd that watches round prices, and it often attracts orders simply because it is a clean figure. Treat it as a secondary marker between the golden projection and the climax zone.
The cluster method ranks the levels exactly this way in practice: the nearer extensions serve as targets, and the deeper ones serve as warnings. The price action canon adds the momentum test on top of that ranking: each further level demands more from the trend, and the trader who demands evidence at every extension keeps the deepest ones honest.
What Each Level Is Worth
Different crowds watch different levels, and that difference is what gives each level its character. Short-term breakout traders cluster at the 127.2 because their trade thesis ends at the first projection. Position traders hold for the 161.8 because their thesis is the trend itself. Almost nobody plans to buy at the 261.8, which is precisely why it works as an exit zone.
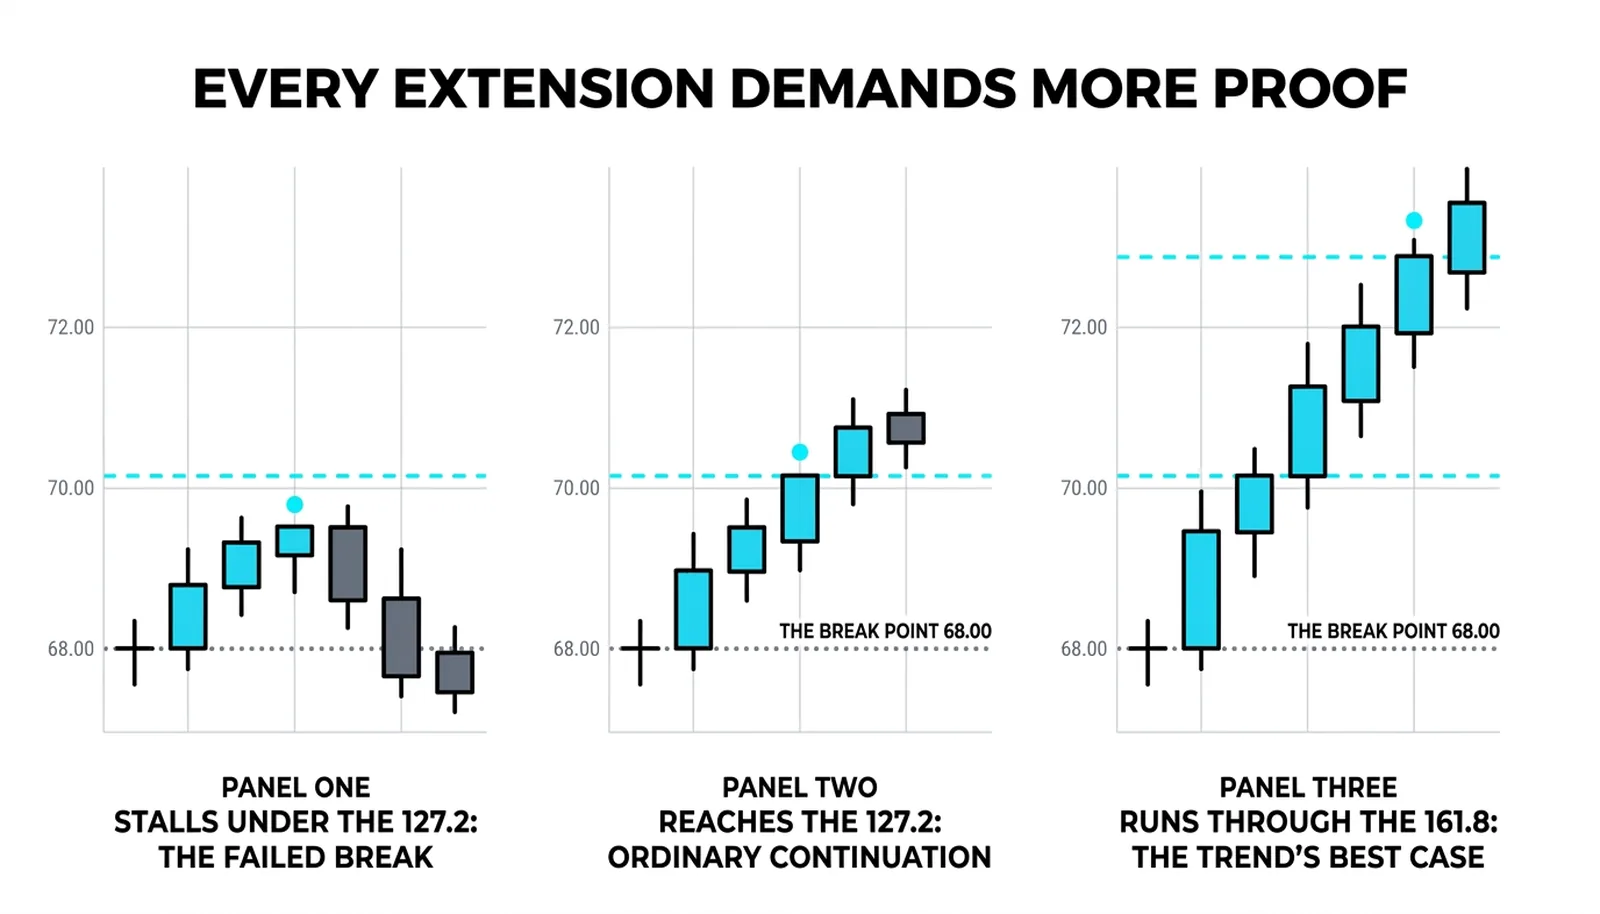
The momentum requirement escalates with distance. Reaching the 127.2 asks only that the breakout continues at an ordinary pace. Reaching the 161.8 asks that the trend keeps its structure, shallow pullbacks and steady pushes. Reaching the 261.8 asks for something close to a stampede, and stampedes end badly for late buyers.
Order flow concentrates at the nearer levels. Partial profit-taking at the 127.2 often produces a visible pause or a shallow dip, and that pause is normal, not a failure. The deeper levels see thinner participation, so price can slice toward them fast and reverse even faster. Speed at the deep levels is a warning, not a gift.
One blunt rule: the level is a place to make a decision, not a place to make a wish.
Trading Toward the Levels
The practical structure has three parts. The first target sits just under the old high, because the old high is the nearest barrier and paying yourself before it is prudent. The runner then works toward the 127.2, and only trend-strength evidence justifies holding anything for the 161.8.
Runner management is where the levels earn their keep. Once the first target pays, the stop on the remainder moves to breakeven or better, and the 127.2 becomes the next decision point. If price stalls hard below it, the runner exits on the failure. If price drives through it with structure intact, the 161.8 comes into play.
The honesty matters more than the mechanics. Extensions are targets, not entitlements. A break of the old high that stalls under the 127.2 and closes back below the old high is a failed break, and the failed break, not the projection, decides the runner's exit. The trader who has already spent the 161.8 in their imagination gives back open gains waiting for a level the trend never promised.
Size the trade for the level that pays, not the one that dazzles. The 127.2 pays often. The 261.8 dazzles rarely and charges tuition from everyone who waits for it without evidence.
The Run to 70.18
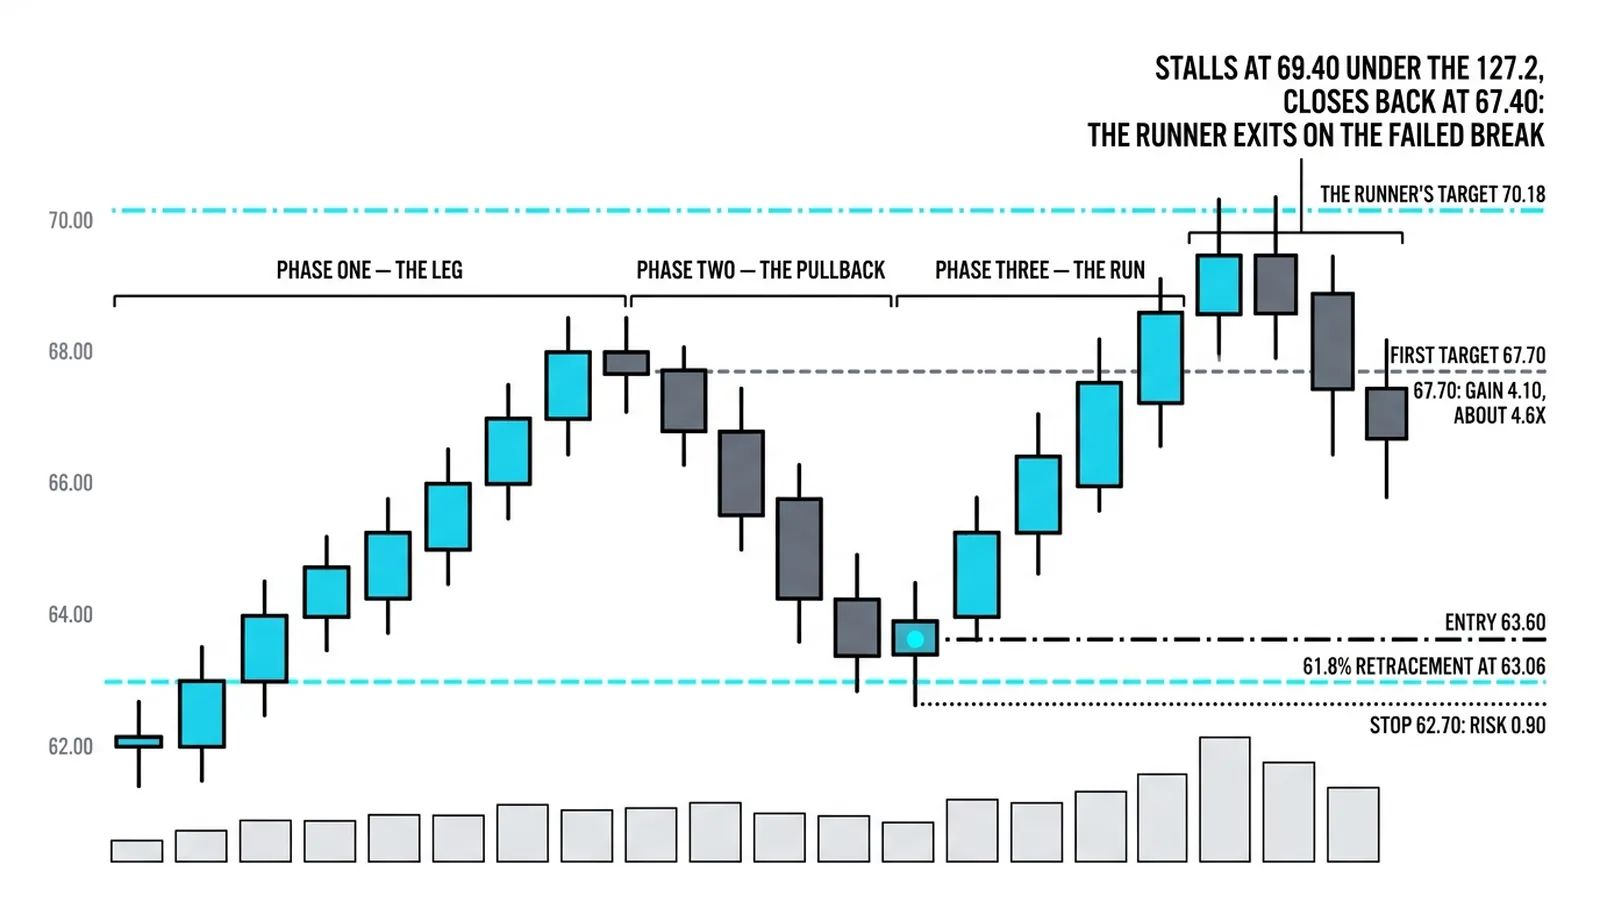
Here is a fully hypothetical illustration with round numbers. A leg runs 8.00 points from 60.00 up to 68.00. Projected from the pullback zone, the 127.2 percent extension sits at 70.18, the 161.8 at 72.94, and the 261.8 at 80.94.
Price pulls back to 63.10, holding just above the 61.8 percent retracement line at 63.06, and turns. The long is taken at 63.60 on the turn, with the stop at 62.70, risking 0.90 per unit. The first target sits at 67.70, just under the old high at 68.00.
The first target pays 4.10, which is about 4.6 times the risk. That single decision, paying yourself before the barrier, does most of the work in the trade. The runner is then held for the 127.2 extension at 70.18 with the stop trailed to breakeven.
Price breaks 68.00, pushes to 69.40, stalls under the 127.2, and closes back at 67.40. The close back below the old high is the failed break, and the failed break hands the runner its exit. The runner leaves with a modest gain instead of the full extension, and that is fine.
The trader who held the runner for 72.94 because the projection looked beautiful watched 4.10 of banked profit survive while the open gain evaporated. The level gets reached when the trend is strong enough. This trend was strong enough for the first target and nothing more.
| Level | Price | Role | Response |
|---|---|---|---|
| Old high | 68.00 | Nearest barrier | Take the first target just under it at 67.70 |
| 127.2 percent | 70.18 | First objective | Hold the runner, exit on a stall and failed break |
| 161.8 percent | 72.94 | Golden projection | Hold only with trend-strength evidence |
| 261.8 percent | 80.94 | Climax zone | Sell into strength, never chase |
Extension Level Questions, Answered
What are the key fibonacci extension levels?
The key fibonacci extension levels are the 127.2, the 161.8, and the 261.8 percent projections beyond the old extreme. The 127.2 is the first realistic objective after a break, the 161.8 is the projection a healthy trend can reach, and the 261.8 is the climax zone where continuation odds are worst. The 200 percent level acts as a round-number reference point between the 161.8 and the 261.8.
Why is the 161.8 extension important?
The 161.8 extension matters because it equals the prior leg stretched by the golden ratio, the same ratio the retracement toolkit is built on. A trend that reaches it has demonstrated full, healthy continuation, which is why trend traders let profits work toward it. It separates ordinary breakouts from genuinely strong trends.
What does a 261.8 extension mean?
A 261.8 extension means price has traveled two and a half times the prior leg beyond the old extreme, which only vertical, late-stage runs achieve. It marks a climax zone where the sensible action is selling into strength. Excitement peaks there precisely because continuation odds are at their worst.
How do you calculate fibonacci extension levels?
Measure the length of the prior leg, multiply that length by 1.272, 1.618, or 2.618, and project the result from the end of the pullback. In the worked example, the 8.00-point leg times 1.272 gives 10.18 points above 60.00, placing the 127.2 extension at 70.18. Most charting platforms draw all three levels automatically once you anchor the tool on the leg and the pullback low.
With the levels named, ranked, and tied to real trade decisions, the next lesson puts them to work: the scaling plan that turns the 127.2, the 161.8, and the 261.8 into a way of taking profits.