What Are Economic Indicators
Economic indicators are scheduled official statistics about the economy, covering things like inflation, employment, and growth, and markets move on them because they change expectations about interest rates and profits. That last part is the key. Traders do not care about the number itself. They care about what the number implies for the decisions of central banks and the earnings of companies.

Think of indicators as the economy's vital signs taken at a scheduled checkup. One reading rarely tells the whole story, but a pattern of readings tells you a lot. This lesson covers the main families, why the calendar matters as much as the data, and how to read a release without getting caught in the noise. The valuation side of this story is what fundamental analysis is.
The Big Families of Indicators
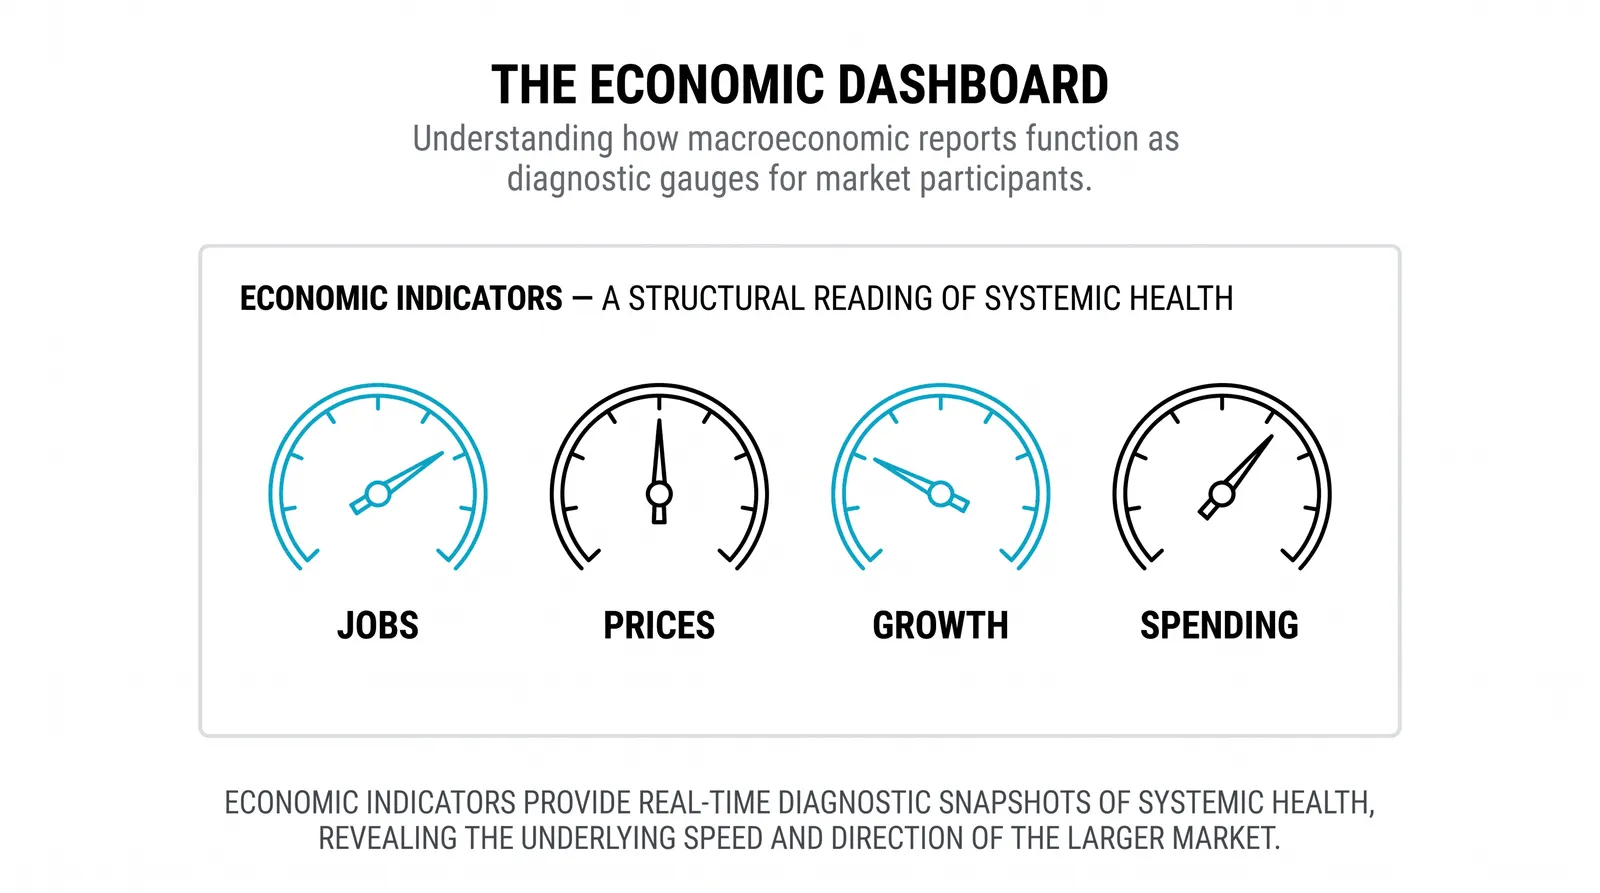
Most indicators fall into three groups. You do not need to memorize every report. You need to know what each family is trying to measure.
Inflation reports track how fast prices are rising. Consumer price indexes measure what households pay for goods and services. Producer price indexes measure what businesses pay for their inputs, which often shows up in consumer prices later.
Jobs reports track the health of the labor market. Employment change counts how many jobs were added or lost in a period. The unemployment rate measures the share of people looking for work who cannot find it.
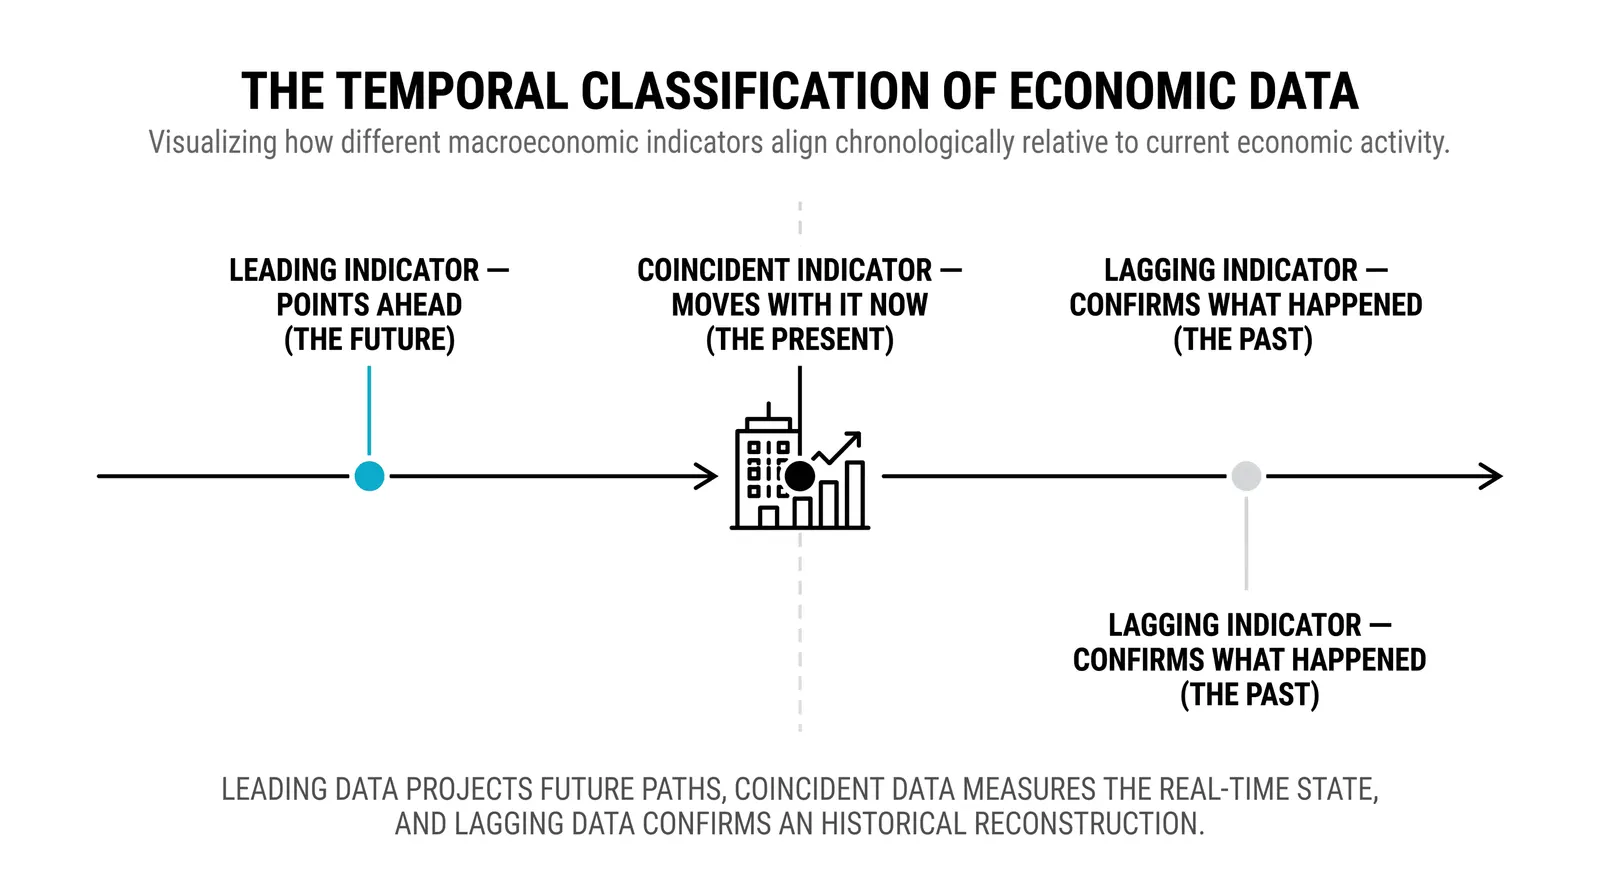
Growth reports track how fast the economy is expanding. Output figures measure total production of goods and services. Activity surveys ask purchasing managers whether business is improving or shrinking, and they arrive faster than hard output data.
Each family answers a different question. Inflation asks whether money is losing value. Jobs ask whether people have income to spend. Growth asks whether the whole machine is speeding up or slowing down.
Why the Schedule Matters as Much as the Number
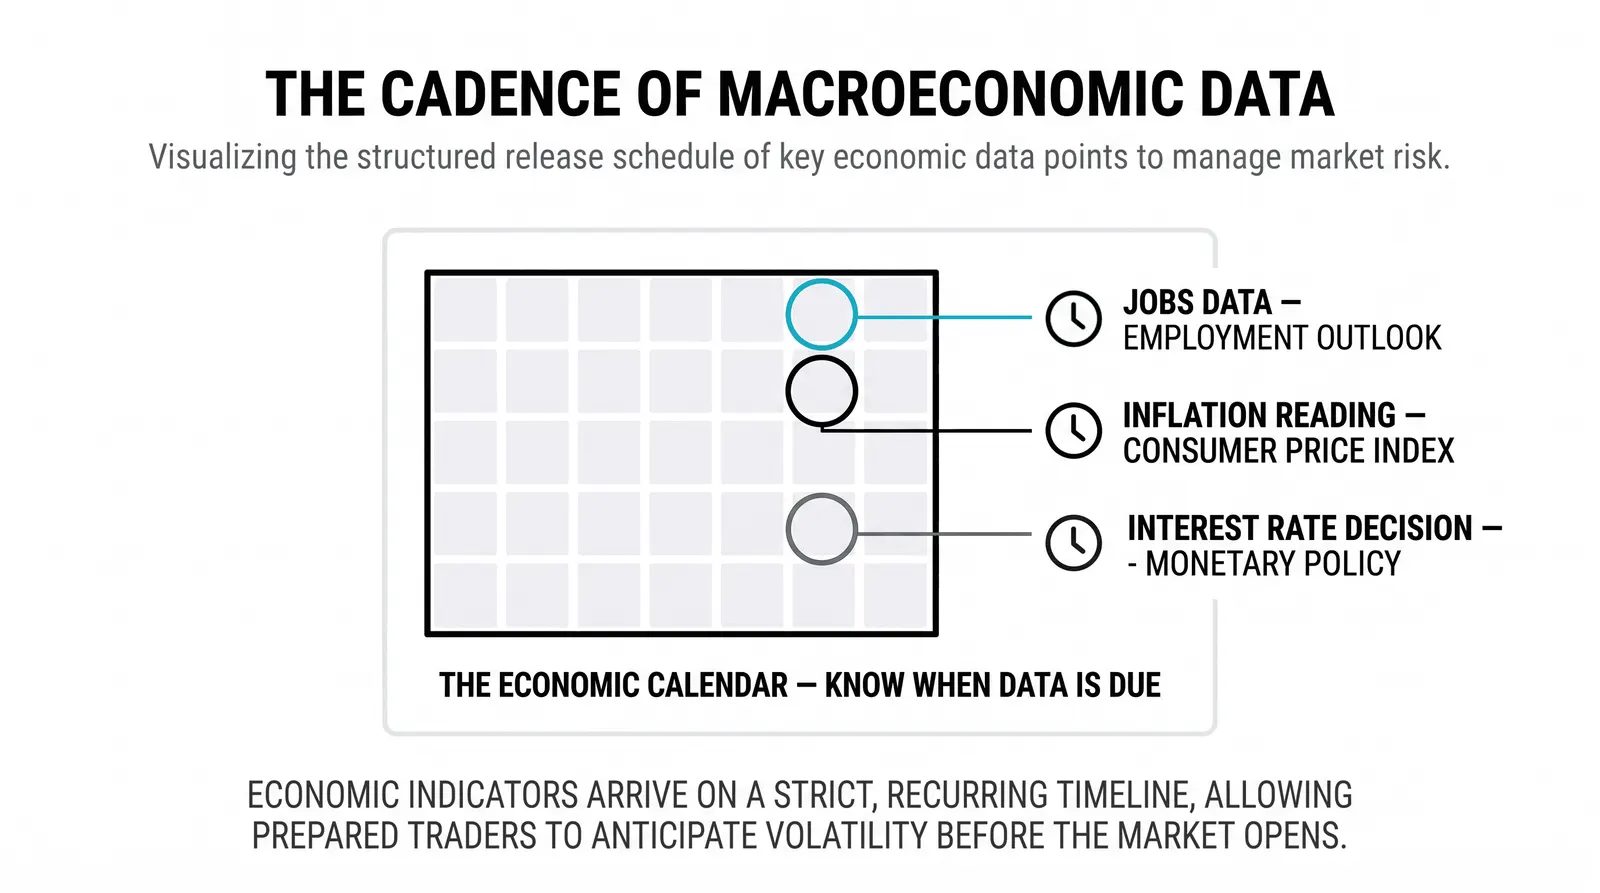
These reports land on published calendars, weeks or months in advance. Everyone knows when they are coming. That changes everything about how markets react.
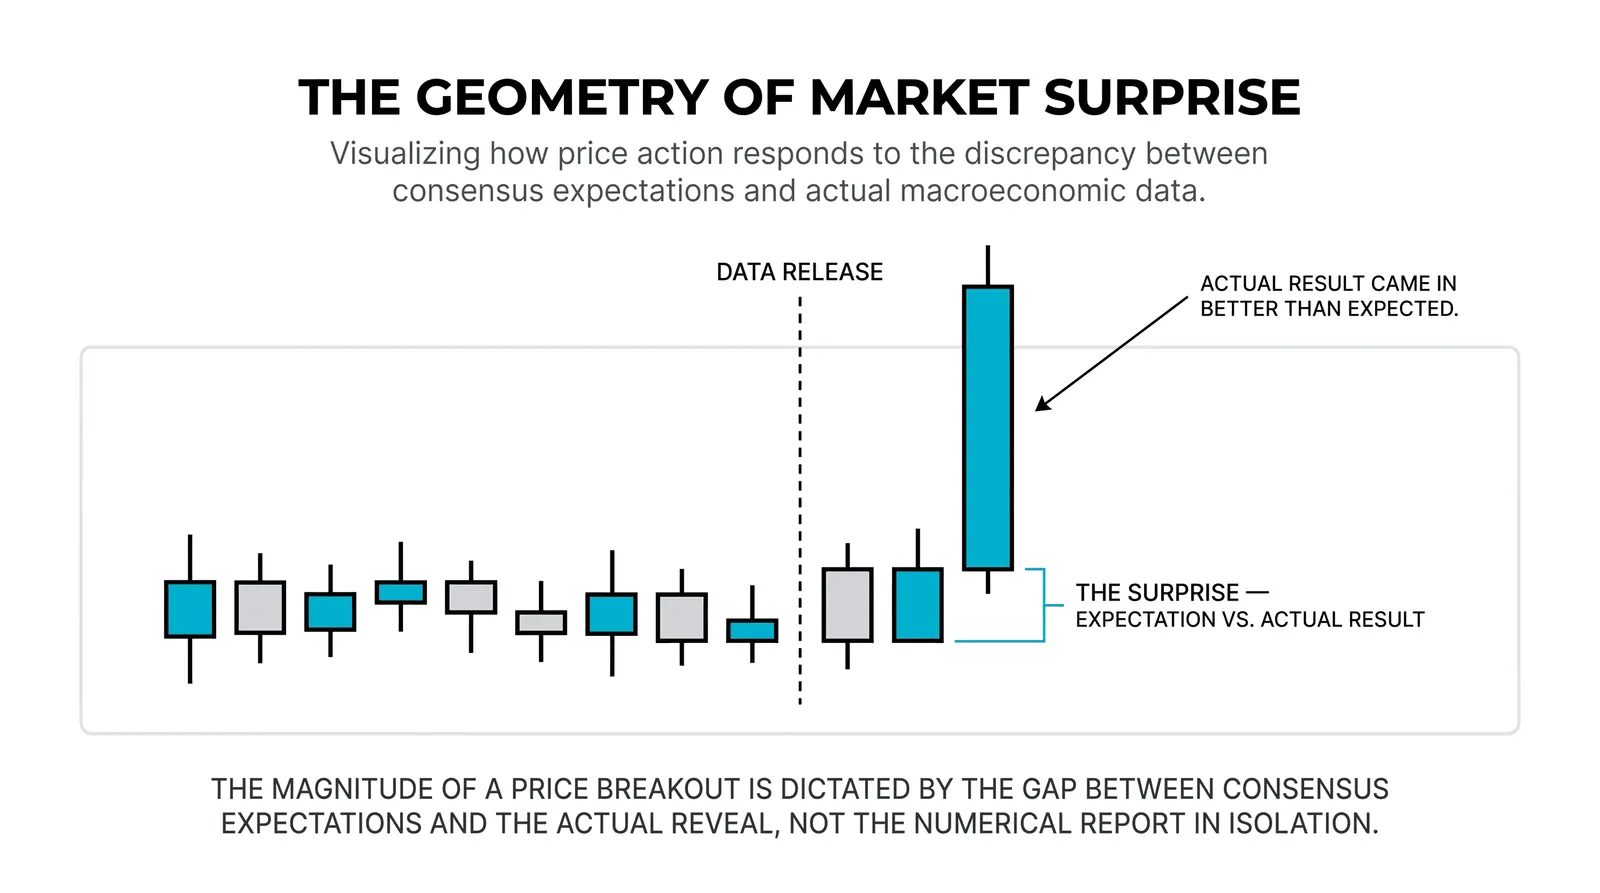
Because the date is known, traders position before the print. Analysts publish forecasts. Those forecasts get baked into prices. By the time the number drops, the expected version is already priced in.
So the market does not move on the number. It moves on the surprise, the gap between what was expected and what actually printed. This is the same logic as earnings season. A company can report strong profits and see its stock fall, because the market expected even stronger profits.
This is the single most common beginner mistake with indicators. You see a "good" number, buy, and watch price fall. The number was good. It just was not good enough relative to expectations.
Good news can push prices down. Burn that into your memory.
A Worked Example With Round Numbers
Here is a hypothetical scenario. None of these figures are real.
Say a major economy releases its monthly inflation report. The consensus forecast is 3.0 percent. The actual print comes in at 3.4 percent.
That is a meaningful upside surprise. Higher inflation hints that the central bank may keep interest rates higher for longer, or even raise them. Higher rates tend to support a currency, because they offer better returns to holders of that currency. So the currency jumps within seconds of the release.
Now flip it. Same forecast of 3.0 percent, but the print comes in at 2.6 percent. Lower inflation hints at lower rates ahead. The currency drops.
Notice what did not happen. Nobody waited to read the full report. Algorithms and fast traders reacted to the headline gap in milliseconds. By the time a retail trader reads the number, the first move is usually done. The corporate cousin of this logic lives in earnings reports.
How the Families Connect to Rates and Markets
Each indicator family points toward interest rates in its own way, and each tends to hit certain markets harder than others. This table sums it up.
| Indicator Family | What It Hints About Interest Rates | What It Moves Most |
|---|---|---|
| Inflation (consumer and producer prices) | Hotter prints point to higher or longer-held rates | Currencies and bond yields |
| Jobs (employment change, unemployment) | Strong hiring suggests rates can stay high; weak hiring suggests cuts | Currencies and stock indexes |
| Growth (output and activity surveys) | Strong growth reduces pressure to cut rates | Stock indexes and growth-sensitive currencies |
The pattern underneath is simple. Almost every major indicator feeds into one question: what will the central bank do next? Answer that, and you understand most of the reaction. The inflation family gets its own deep dive in the consumer price index.
How to Read a Release Without Getting Hurt
You do not have to trade the releases. In fact, standing aside is a legitimate strategy, especially early on. But you should always know when they are coming, because they affect trades you already hold.
A practical routine looks like this:
- Check the economic calendar at the start of each week. Mark the high-impact releases for the currencies or markets you trade.
- Note the forecast, not just the date. The forecast is your baseline for judging the surprise.
- Expect spreads to widen and price to whip in the first minutes after a big print. Stops can get hit by noise, not by being wrong.
- Wait for the dust to settle if you want to trade the reaction. The second move, after the initial spike, is often cleaner than the first.
One more caution. Revisions happen. Last month's number often gets updated in this month's release, and sometimes the revision matters more than the new headline. A strong print paired with a big downward revision to the prior month is not as strong as it looks.
Questions About Economic Indicators
Which indicators matter most for a beginner?
Start with inflation and jobs. Consumer price reports and the major employment releases move markets the most reliably, because they feed directly into interest rate decisions. Add growth surveys once you are comfortable reading the first two.
Where do I find the calendars?
Free economic calendars are widely available on financial news sites and most trading platforms. They list the release time, the forecast, the previous reading, and usually an impact rating. Filter for high-impact events in the markets you trade so the list stays manageable.
Do I need to trade the releases?
No. Many experienced traders flatly avoid the first minutes after a major print because spreads widen and price action gets erratic. Knowing the calendar matters even if you never trade a release, because it tells you when to expect volatility in positions you already hold.
Why do markets sometimes move opposite to the headline?
Because price reacts to the gap between expectation and reality, not to the headline in isolation. A strong jobs number can sink a currency if the market expected something even stronger, or if a revision to prior data cancels it out. Always compare the print to the forecast before judging the reaction.
Once you can read a release against its forecast, the next step is understanding the institutions that respond to these numbers. Central banks set the rates that everything else revolves around, and that is where this thread continues.