Volume Spread Analysis: An Introduction
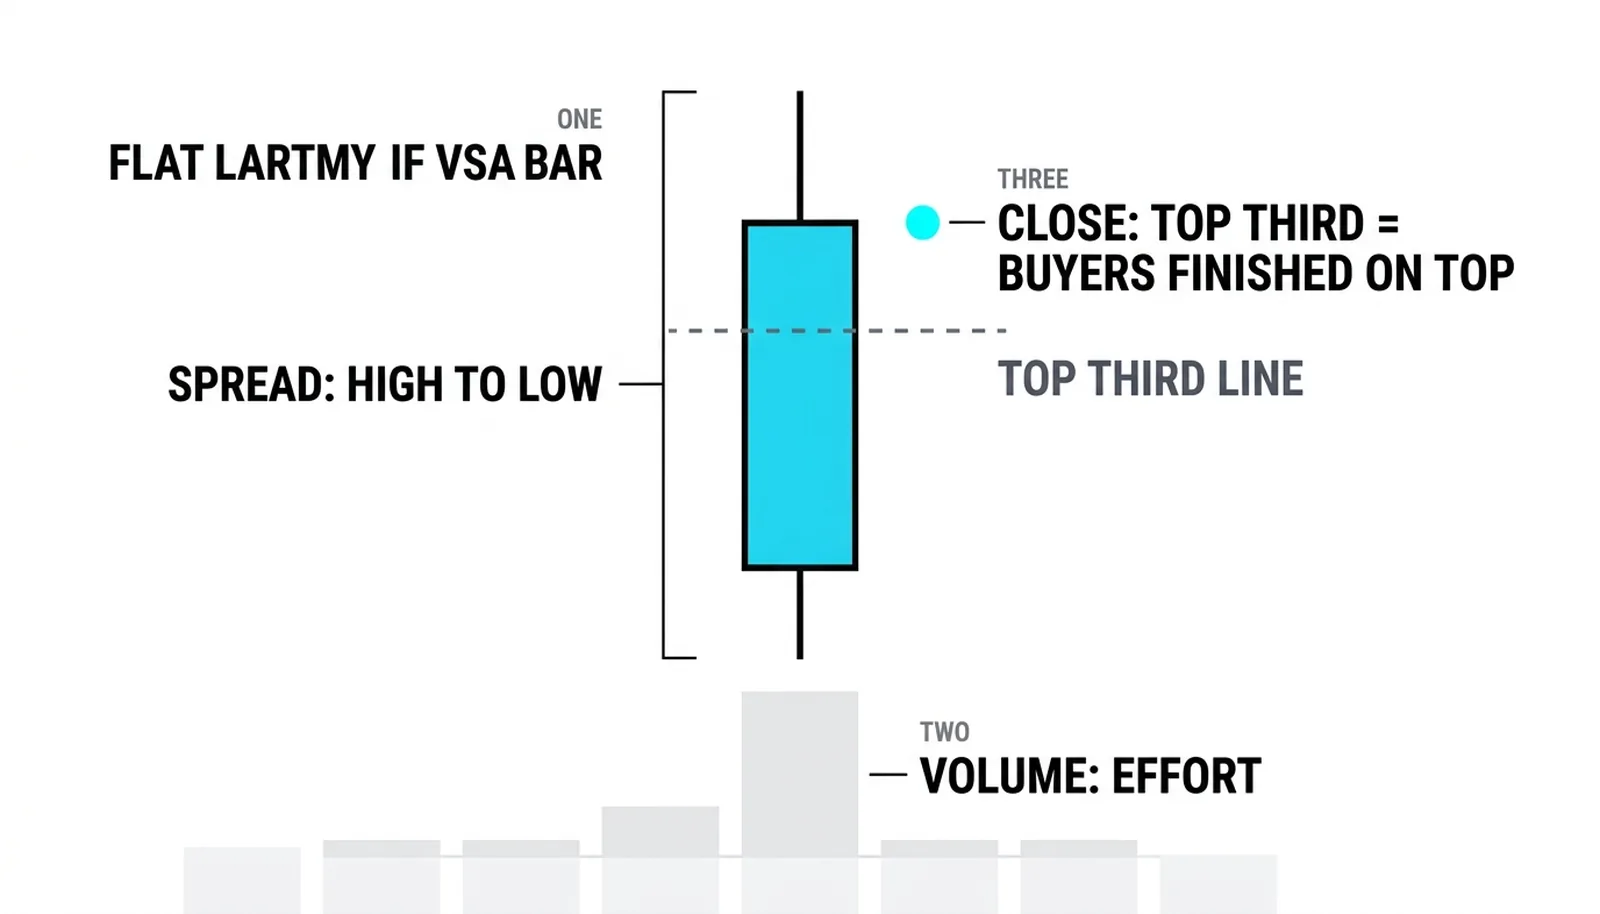
Volume spread analysis is a bar-by-bar method that reads three numbers on every bar: the volume, the spread of the bar from high to low, and where the close sits inside that spread. This introduction covers the three variables, where the method came from, and how to use it honestly. It was developed by Tom Williams, a former professional syndicate trader, and its core claim is simple. When those three numbers agree, the bar is honest. When they disagree, the disagreement itself is the message, because it suggests the price move and the effort behind it are out of balance.

Think of it like judging a restaurant's real night not by the calm dining room, but by the stack of dirty pans in the kitchen. The closing price is the dining room. The volume and spread are the kitchen. Two bars can close at the same price and describe completely different nights.
The previous lessons in this level already built the pieces. You learned why effort versus result matters, and how volume behaves differently in trends and ranges. VSA is the framework that formalizes both ideas into a repeatable per-bar reading, so this post is the bridge, not a re-teach.
The Three Variables
Volume is the effort. It tells you how much participation a bar attracted. A big move on heavy volume means many traders committed money to it. A big move on thin volume means few did.
Spread is the travel. It measures how far price ranged from high to low during the bar. Wide spread means the bar covered real ground. Narrow spread means it barely moved.
The close's position inside the bar is where the stronger side actually finished. A bar can travel three points and close at the top, the middle, or the bottom. That finishing position tells you who was in control when the bar ended, regardless of what happened along the way.
Combine the three and the same price tells different stories. A close high in a wide up bar on heavy volume says buyers pushed, traveled far, and held the ground. The same closing price on a narrow bar with thin volume says price drifted there and nobody paid much for it. Identical destination, opposite credibility.
Where VSA Came From
Tom Williams spent years as a syndicate trader before codifying the method and laying it out in the book Master the Markets. The intellectual roots run straight back to the classic accumulation and distribution framework's tape reading from the early twentieth century, especially the effort-versus-result principle you already know from this level. Later work took the Wyckoff method's qualitative observations and turned them into named, per-bar patterns. That lineage matters more than the biography.
The Patterns This Level Will Build
The next lesson owns the three variables in full depth. After that, individual lessons own the named bars. Here is the map, one line each:
- The no-demand bar: an up bar on narrow spread and low volume, suggesting buyers are absent at higher prices.
- The no-supply bar: its mirror, a down bar on narrow spread and low volume, suggesting sellers are absent at lower prices.
- Stopping volume: a bar where heavy selling suddenly gets absorbed, and the decline halts despite enormous effort from sellers.
- The test: a low-volume return to a climactic area, checking whether supply or demand has really cleared out.
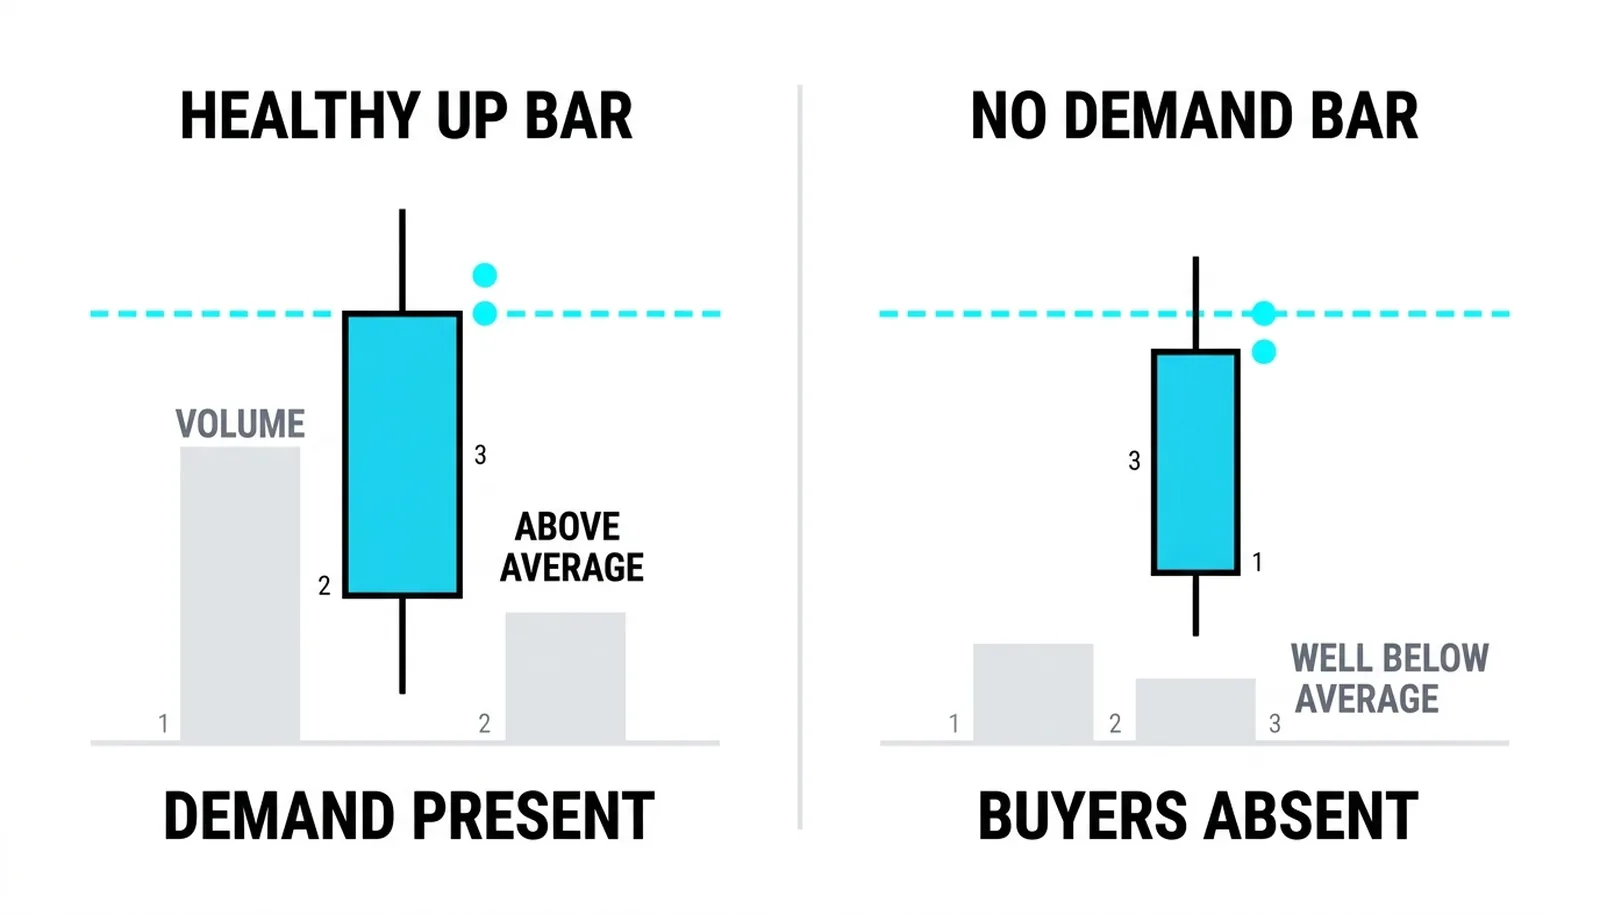
Each pattern is just the three variables arranged into a recognizable disagreement. Learn the variables first and the patterns stop being memorization.
Using VSA Honestly
Now the part most introductions skip. The smart-money framing is a model, not a proven fact. Nobody can verify who traded on a given bar. When VSA says "the professionals absorbed the selling," that is a story layered on top of observable numbers, not confirmed reporting from inside an institution. Treat insider narratives as memory scaffolding for the patterns. The patterns are real and testable. The cast of characters is invented.
VSA is also discretionary. The same bar admits two readings, and experienced practitioners will sometimes disagree about whether a bar shows absorption or simple exhaustion. That is not a flaw unique to VSA; it is true of every chart method. The value is in the checklist discipline, not the story.
So build the checklist habit before you build any narrative. On every bar, in order:
- Read volume against its recent average.
- Read spread against recent bars.
- Read the close against the bar's own range.
Only after those three mechanical checks do you interpret. A method that only works when you tell yourself a story is not a method.
One more discipline keeps the reading honest: timeframes. A no-demand bar on a 5-minute chart is a sentence, not a verdict. The same pattern on a daily chart, after an extended advance, pressed into old resistance, carries real weight. Read the pattern on the timeframe you trade, then check the next one or two higher timeframes for agreement. When the bar-level story and the higher-timeframe story contradict each other, the higher timeframe wins, and the honest response is to wait rather than argue with it.
One Bar, Read Three Ways
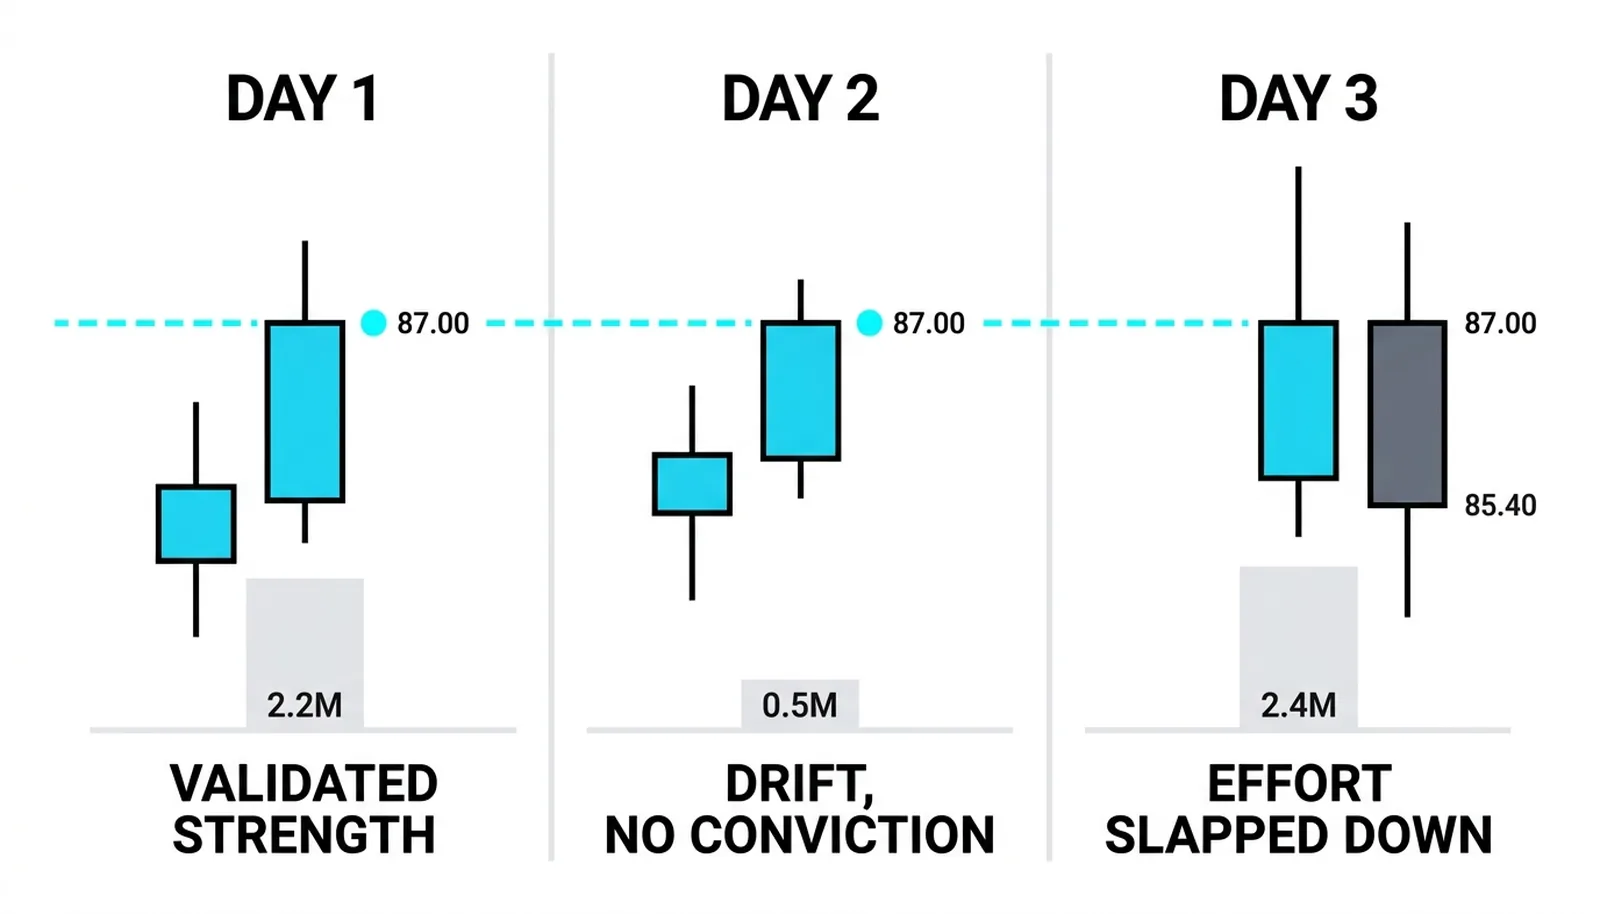
Here is a hypothetical illustration with invented round numbers. A stock averages 1.0 million shares a day. On three separate days, it closes at 87. Same close, three different bars.
Day one: 87 reached on 2.2 million shares with a 3.4-point spread, closing at 86.9, near the high. Heavy effort, wide travel, strong finish. Validated strength.
Day two: 87 reached on 0.5 million shares with a 0.8 spread, closing at 86.8. A narrow drift up that nobody paid for. The price is the same, the conviction is not.
Day three: 87 touched on 2.4 million shares with a 3.6 spread, but the bar closes at 85.4, near the low, leaving a deep upper wick. Heavy effort pushed up and got slapped back down. The close's position inside the bar is what separates this from day one.
| Day | Volume and Spread | Close Position | Verdict |
|---|---|---|---|
| One | 2.2M shares, 3.4 spread | Near the high (86.9) | Validated strength |
| Two | 0.5M shares, 0.8 spread | Middle-high (86.8) | Drift, no conviction |
| Three | 2.4M shares, 3.6 spread | Near the low (85.4) | Effort rejected, warning |
Three closes at 87, three different verdicts. Price alone could never tell you this. The bar's internal detail could.
Volume Spread Analysis, Answered
What is volume spread analysis in simple terms?
Volume spread analysis is a way of reading each price bar through three numbers: how much volume traded, how far price traveled, and where the close landed inside that range. Agreement between the three confirms the move. Disagreement flags it for suspicion.
Who created VSA?
Tom Williams, a former professional syndicate trader, developed and named the method, publishing it in Master the Markets. The framework builds directly on the earlier tape-reading principles of the classic accumulation and distribution framework, especially effort versus result.
Is the smart money idea in VSA literally true?
No, it is a model rather than verified fact. No one can confirm who traded on any single bar, so treat the smart-money language as a memorable way to label patterns, and rely on the observable numbers for your actual decisions.
What are the three variables in VSA?
Volume, spread, and the close's position within the bar. Volume shows effort, spread shows travel, and the close shows which side finished in control.
The next lesson takes the three variables apart one at a time, with the averaging baselines and comparison rules that turn this introduction into a working checklist.