VSA: The Three Variables
The three variables of volume spread analysis are volume, spread, and close position, and each one is read relatively, never as an absolute number. Volume is compared against that bar's own recent average. Spread is compared against the bars around it. The close is measured against the bar's own range. A big volume figure on one instrument is noise on another, so the raw number tells you nothing until you ask what it is big or small against.

Think of an oven giving you three readings: the heat, the timer, and the color of the crust. A baker trusts the crust. Volume and spread are the heat and the timer, the conditions. The close is the crust, the finished result. You need all three, but they are not equal.
The previous lesson covered what VSA is, where it came from, and the honesty rules that govern it. This lesson owns a different job: how each of the three variables is actually measured and compared on a single bar. Underneath everything sits the effort-versus-result law, and the three variables are simply how that law gets measured. The next lesson applies them to the most basic classification of all, up bars versus down bars.
Variable One: Volume Against Its Own Average
Volume is effort. It is the count of shares or contracts that changed hands during the bar, and by itself the figure is meaningless. One million shares is frantic for a thin small-cap and sleepy for a major index fund.
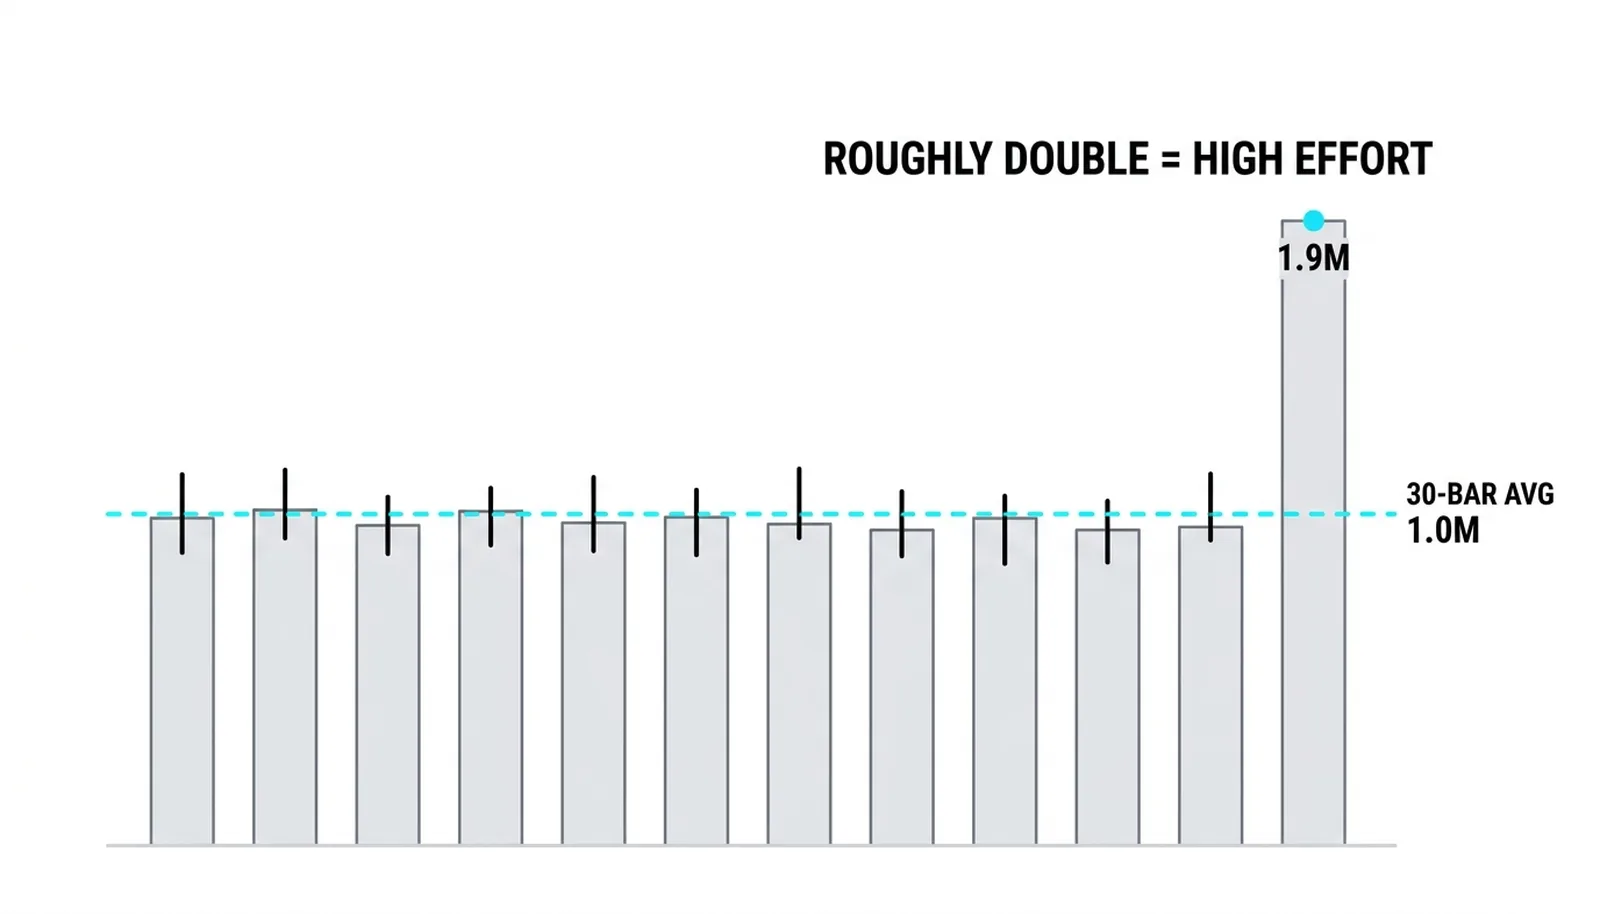
The standard convention is a simple average of the last 30 bars of volume. Thirty is long enough to smooth out one-off spikes and short enough to stay current. When a new bar prints, you compare its volume against that average and label it high, low, or normal.
Two rules keep this honest. First, use the same feed. Volume from one broker or one exchange cannot be compared against an average built from a different source. Mixing feeds corrupts every comparison downstream. Second, judge in rough bands, not decimals. In practice, volume around double the recent average reads as clearly high. Around half reads as clearly low. Everything between is ordinary, and ordinary is a valid reading.
Traders new to this often want precision. They want to know whether 1.7 times average counts. The answer is that VSA works in broad categories because the market works in broad categories. You are not measuring to the millimeter. You are asking whether the crowd showed up in unusual numbers or stayed home.
Variable Two: Spread Against Recent Bars
Spread is the bar's high-to-low range. It measures how far price traveled during the bar, and like volume it only means something in comparison.
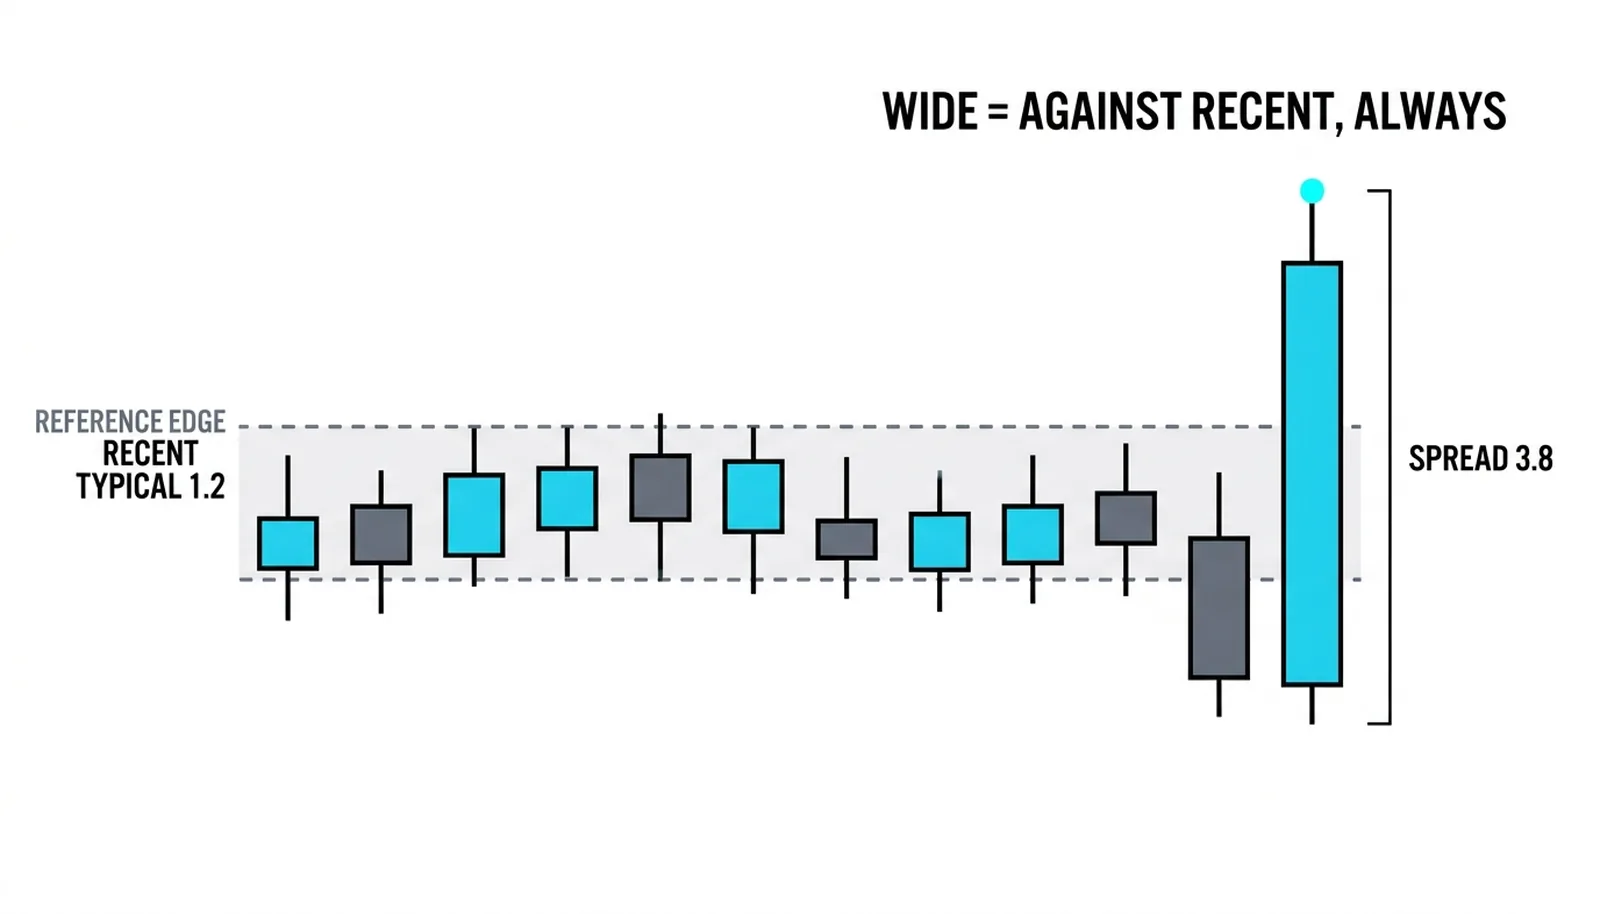
A wide spread says the bar covered a lot of ground. A narrow spread says it was compressed. But wide and narrow are judgments against the last handful of bars on that chart, nothing else. There is no fixed point size that counts as wide, and there never can be. A two-point bar is enormous for a quiet utility stock and trivial for a volatile futures contract. Even on the same instrument, what counts as wide changes as volatility expands and contracts over weeks.
So the habit to build is simple. Look at the bar, then glance at the ten or fifteen bars behind it, and ask whether this bar's range is larger, smaller, or about the same. That glance is the measurement. Some traders formalize it with an average range figure, and that is fine, but the eyeball comparison against recent bars is the core skill.
Spread is where result starts to show up. Volume is the effort going in. Spread is the first sign of what that effort produced. A huge volume bar with a narrow spread is already telling you something before you even look at the close: a lot of work, very little ground gained.
Variable Three: The Close Inside the Bar
The close position is the most informative of the three variables and the one beginners skip. It is the close expressed as a fraction of the bar's own range, not as a price.
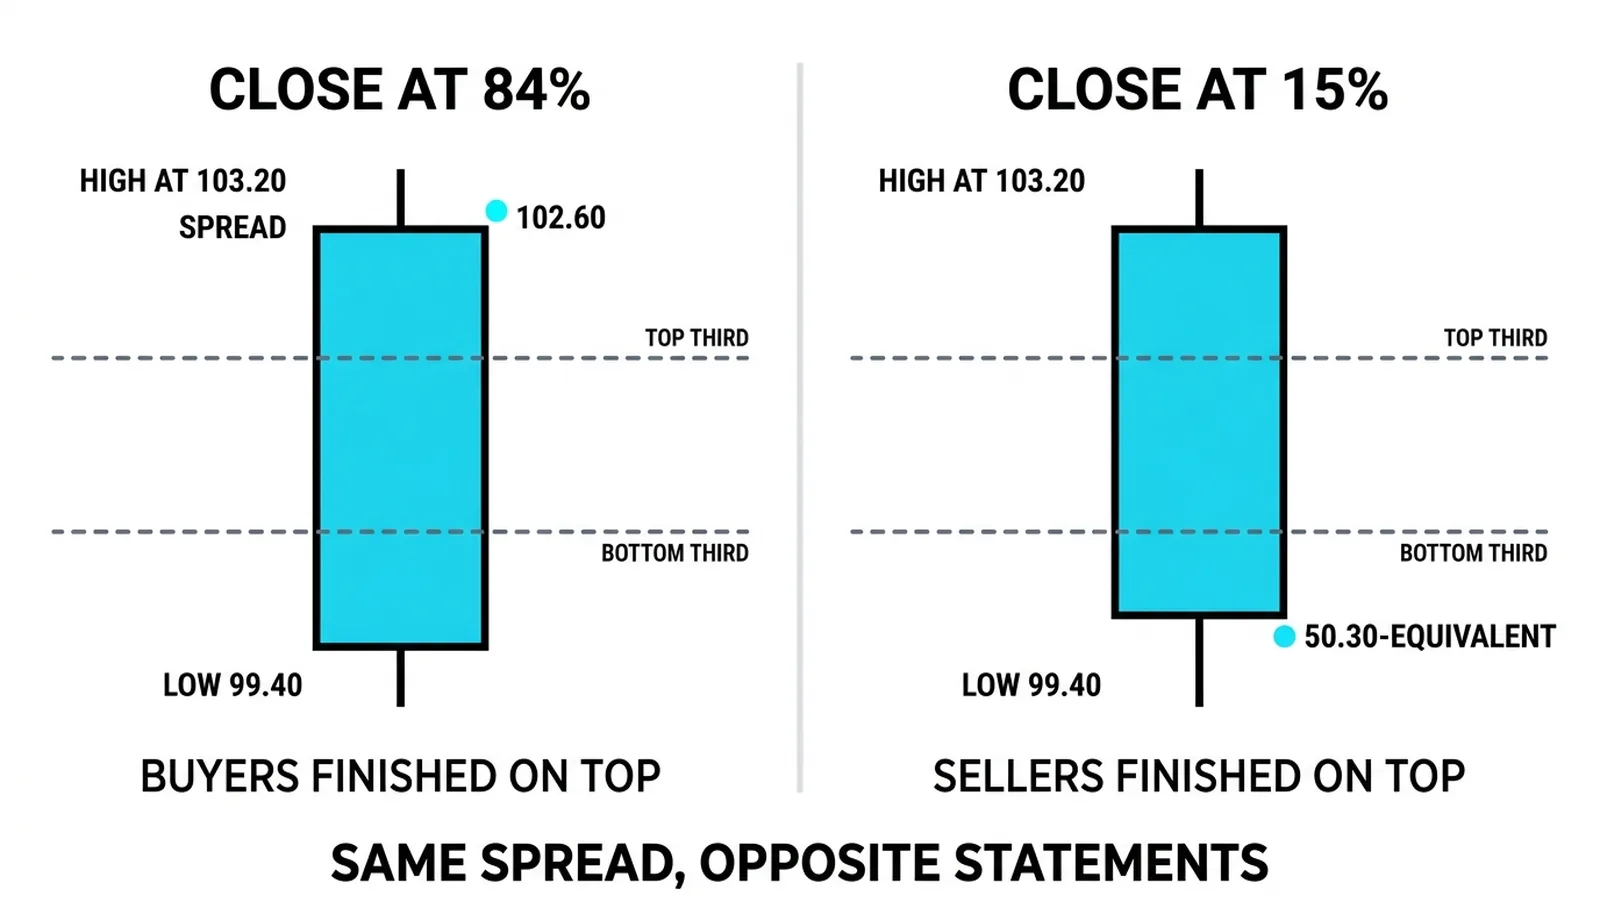
The convention divides the bar into thirds. A close in the top third means buyers finished in control of that bar. A close in the bottom third means sellers did. A close in the middle third means neither side won, and the bar is indecisive regardless of what its color suggests.
The math is trivial. Take the close, subtract the low, and divide by the full range. A bar that ran from 50 to 52 and closed at 51.7 closed at 85 percent of its range, deep in the top third. The same bar closing at 50.3 sits at 15 percent, the bottom third, and it is a completely different statement even though the spread and possibly the volume are identical.
The close is where the stronger side actually finished. Intra-bar highs and lows show where price visited. The close shows where it was left when the bar ended, and that is the part the next bar inherits. A wide spread with a close at the top is a statement of strength. The same wide spread with a close at the bottom is a statement of weakness, and the volume will tell you how much conviction sat behind either one.
Reading the Three Together
No single variable carries a signal. The signal lives in the combination, and specifically in whether the three agree or disagree.
Agreement looks like this: heavy volume, a wide spread, and a close near the extreme of the bar. Effort was high, the result was large, and the finish confirmed the direction. All three point the same way, so the bar means what it appears to mean. Genuine demand or genuine supply, depending on direction.
Mismatch is where VSA earns its keep. Heavy volume with a narrow spread means enormous effort and almost no result, which says someone absorbed the other side's orders. A wide spread on thin volume means the move had no participation behind it and is suspect. A strong close on a low-volume bar is a finish nobody fought over. Each mismatch is information, and often the most valuable information on the chart.
The working rule is blunt: two variables in agreement and one against is a question, three against is an answer. Two-for-one tells you to wait, watch the next bar, and demand confirmation. Three pointing the same way, or a mismatch so stark it cannot be innocent, tells you the bar has already spoken.
One Bar, Fully Measured
Here is a single hypothetical bar worked through the full process. Round numbers, invented for illustration.
A stock's 30-bar average volume is 1.0 million shares. Today's bar opened at 100, traded between a low of 99.4 and a high of 103.2, and closed at 102.6.
| Variable | Reading | Compared Against | Verdict |
|---|---|---|---|
| Volume | 1.9 million shares | 30-bar average of 1.0 million | High, roughly double |
| Spread | 3.8 points (99.4 to 103.2) | Recent typical spread of 1.2 | Wide |
| Close position | 102.6, at 84 percent of the range | The bar's own high-to-low span | Top third |
| Combination | All three agree upward | Each other | Genuine demand |
The close position math: 102.6 minus 99.4 is 3.2, divided by the 3.8 range gives 84 percent, comfortably in the top third. Volume near double the average, spread roughly three times the recent norm, close near the high. Effort, result, and finish all point up. This bar is what real buying looks like.
Now change one input. Same open, same range, same close of 102.6, but volume comes in at 0.4 million, well under half the average. The spread and the close still look strong, but the effort behind them is missing. Nobody showed up to contest the move, so the rise may be drift rather than demand. The verdict flips from genuine to suspect, and the price never changed. The measurements did the work, not the price.
The Three Variables, Answered
What are the three variables in VSA?
Volume, spread, and close position. Volume is the effort behind the bar, spread is the bar's high-to-low range, and close position is where the close sits inside that range. All three are read relatively, each against its own recent context.
How many bars should the volume average use?
The standard convention is 30 bars. That window is long enough to filter out one-off spikes and short enough to reflect current conditions. Consistency matters more than the exact number, so pick 30 and keep it.
What does close position tell you?
It tells you which side actually won the bar. A close in the top third of the range means buyers finished in control, the bottom third means sellers did, and the middle third means the bar was indecisive. It is the result the next bar inherits.
Do the variables work on every timeframe?
Yes, because every comparison is relative to that chart's own recent bars. A five-minute bar is judged against recent five-minute bars, a daily against recent dailies. Volume quality varies by market and feed, but the three-variable method itself is timeframe-independent.
With the three variables measurable, the next step is classification: applying them to up bars and down bars, the simplest split in the whole framework and the foundation for every VSA signal that follows.