Effort vs Result: The Volume Price Law
Effort vs result is the volume-price relationship test from the third law of the classic accumulation and distribution framework, and it is the cleanest single question you can ask any bar on a chart. Effort is the volume behind a bar. Result is the price movement that volume produces. Every bar either validates the relationship, meaning the volume matches the size of the move, or breaks it, meaning you have an anomaly worth your attention.

Think of a rowing crew that digs in hard while the boat barely creeps forward. That boat is telling you about the current, not about the rowing. When heavy effort produces a weak result, something unseen is pushing against the move, and that something is usually other traders with deep pockets.
Earlier lessons in this level established why volume can be trusted as a data source and how to read it vertically and horizontally, so this lesson takes that foundation as given. The basic confirmation checklist you already learned is the everyday version of this idea. What follows is the law itself, and how to run the validation-versus-anomaly test at two levels: the single bar and the whole trend.
Validation: When Volume Backs the Move
The healthy case is simple. A bar with a wide spread, closing near its extreme, on volume well above average, is a move with genuine participation behind it. Effort and result agree. The market spent real money to travel that distance, and the distance reflects it.
Run this as a harmony test bar by bar. Volume above average should come with a spread above average. Quiet volume should come with a modest spread. Neither has to match perfectly, but the proportions should make sense together. When they do, you can treat the move as honest.
The same law scales up to the trend level. A rising trend carried by rising volume is validated at the larger degree. Each push higher draws more participation than the last, which means new buyers keep arriving and paying up. That is the trend telling you it has fuel. A trend where volume quietly shrinks on each new leg is the opposite message, and it deserves the same skepticism at the trend level that a weak bar earns at the bar level.
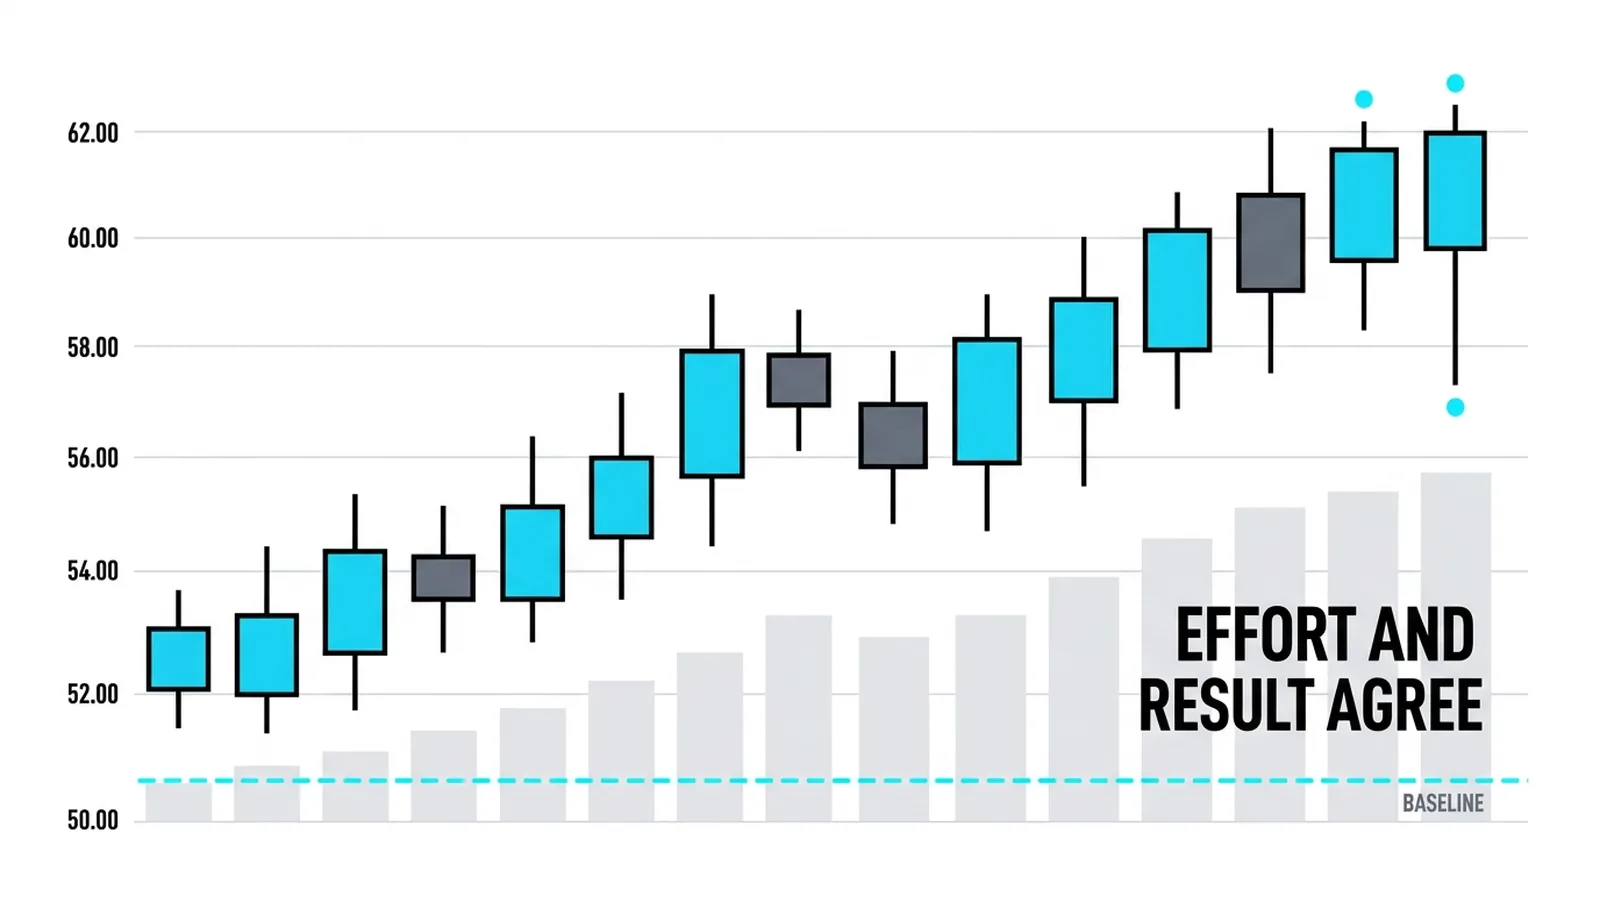
One habit makes this practical: stop reading price alone. Every time you note a big bar, glance down and ask whether the effort earned that result. After a few hundred bars, the check becomes reflex.
Anomaly One: High Effort, No Result
The first classic warning is a bar with very high volume that barely moves. Huge effort, tiny result. Something absorbed all that trading without letting price travel.
The mechanism is straightforward. For price to stall under heavy turnover, someone large must be sitting on the other side, filling every order that comes in. In an up move, that means a big seller is supplying stock into the buying, soaking it up without letting the price run. In a down move, a big buyer is catching everything the sellers throw. Either way, a participant with serious size is working against the visible direction.
This is why the anomaly shows up so often near old highs and lows. Those levels are where large operators defend or distribute. Price presses into a prior high, volume spikes, and the bar closes nearly flat. The crowd sees excitement. You should see a ceiling being enforced.
One caveat keeps you honest. A single high-volume flat bar is a warning, not a verdict. Sometimes it resolves as a pause before continuation. What it always means is that the easy move is over until proven otherwise, and your job is to wait for the next bars to reveal which side won the absorption battle.
Anomaly Two: Big Result, No Effort
The mirror image is a wide spread bar on thin volume. Price traveled far, but almost nobody participated in the trip. The move has no crowd behind it.
Thin-volume moves are cheap to produce. With few orders in the book, a modest amount of buying or selling pushes price a long way. That makes the bar suspect in two specific situations. The first is naturally thin markets, such as holidays, overnight sessions, or neglected instruments, where wide spreads on low volume are routine noise rather than signals. The second is a move against the dominant side, where a sharp rally in a downtrend on weak volume is usually just sellers stepping back for a moment, not buyers taking control.
The practical rule: a big bar that nobody showed up for does not deserve the same respect as a big bar with a crowd. Treat it as unproven. If the next bars confirm it with rising participation, the move earns its spread retroactively. If they do not, expect the move to retrace.
Markets Need Effort to Fall Too
A common misconception says markets fall under their own weight, that declines are effortless and only rises need fuel. This is the gravity trap, and it is wrong.
Falling prices require selling. Every tick lower happens because someone actively sold into the bid. A downtrend carried by rising volume is a validated downtrend, exactly as a rising trend on rising volume is validated. The effort is there, the result is there, and the relationship holds.
The anomaly works symmetrically too. A downtrend where volume falls away on each new low is the same warning as a rally on shrinking volume. The selling pressure is drying up. Price is still drifting lower, but the effort behind the decline is gone, which means the move is vulnerable to reversal once the last motivated seller is done.
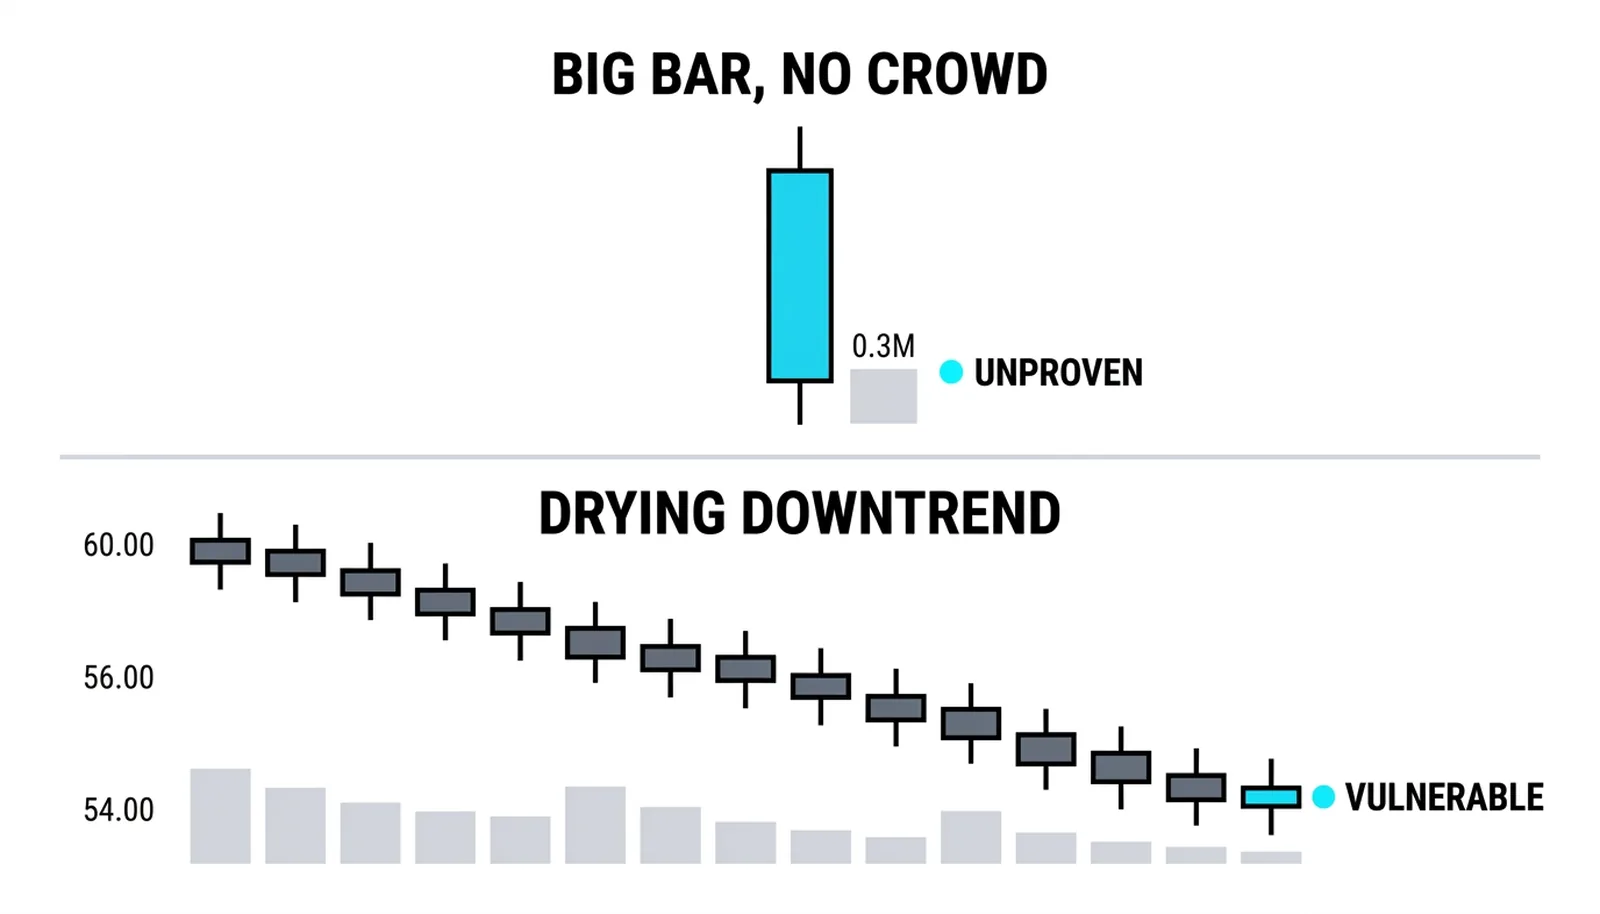
So apply the test identically in both directions. Direction never changes the law. Only the relationship between effort and result matters.
Four Bars, One Anomaly
Here is a hypothetical illustration with round numbers. A stock sits near 80 in an established uptrend. You read four consecutive bars.
Bar one closes up 0.4 on 0.9 million shares. A narrow spread on quiet volume. Effort and result match. Validated, nothing to note.
Bar two closes up 0.6, but volume jumps to 2.1 million shares. The effort more than doubled while the result barely grew. Someone supplied a wall of stock into that buying. First warning.
Bar three closes up 1.1 on 1.3 million shares. The spread widened nicely, but the effort faded. Participation is thinning as price extends.
Bar four is the widest yet, up 1.4, on only 1.0 million shares. The rise is now running on empty. The biggest result of the sequence came with near-average effort.
| Bar | Spread | Volume | Verdict |
|---|---|---|---|
| 1 | +0.4 | 0.9M | Validated, quiet day |
| 2 | +0.6 | 2.1M | Anomaly: effort doubled, result did not |
| 3 | +1.1 | 1.3M | Weakening: result up, effort down |
| 4 | +1.4 | 1.0M | Anomaly: biggest gain on thin effort |
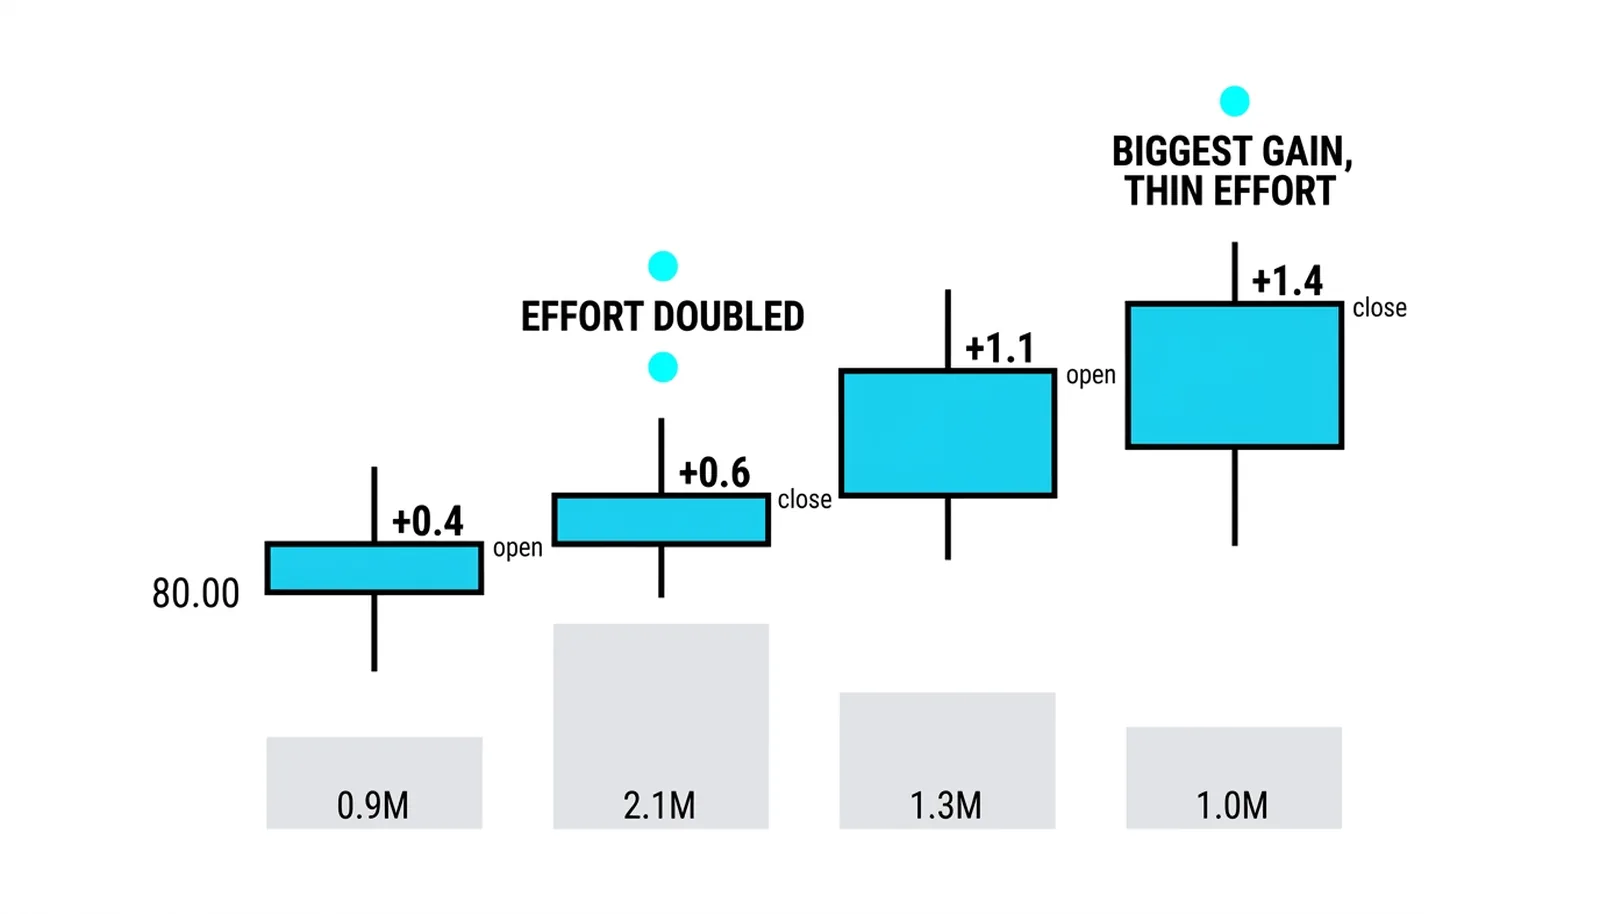
The honest reading of this sequence is not "sell everything." It is narrower and more useful: stop trusting pullback buys until the relationship repairs. Two different anomalies in four bars tell you the trend's fuel supply is in question. If the next pullback comes on falling volume and the next rally returns on rising volume, the law is back in harmony and the trend earns your trust again. If the anomalies stack up, you were warned early rather than surprised late.
The next lesson applies this same test to whole moves, comparing high-volume advances against low-volume ones, and the lesson after that handles volume climaxes, where effort and result both go to extremes. Later in this level, the full Wyckoff three-law picture arrives and ties this law to its two siblings.
Effort and Result Questions
What does effort vs result mean in trading?
Effort vs result is the third law of the classic accumulation and distribution framework: effort is the volume behind a bar, result is the price movement it produces. When the two match, the move is validated. When they diverge, the bar is an anomaly that warns you something is working against the visible direction.
What is an anomaly in volume price analysis?
An anomaly is any bar where effort and result disagree. The two classic forms are high volume with almost no price movement, which signals absorption by a large opposing trader, and a wide price spread on thin volume, which signals a move with no real participation behind it.
Does effort vs result work in downtrends?
Yes, identically. Falling markets require selling effort just as rising markets require buying effort. A downtrend on rising volume is validated, and a downtrend on shrinking volume carries the same warning as a rally on shrinking volume.
Who created the effort vs result law?
The classic accumulation and distribution framework formalized it as the third of three laws. It sits alongside the Wyckoff laws of supply and demand and of cause and effect, and together the three form the backbone of the volume-price method this level teaches.
Carry one habit out of this lesson: for every notable bar, ask whether the effort earned the result. The next lesson stretches that question across entire moves, where the answer gets louder.