Volume Profile vs Standard Volume
Standard volume counts trades by time: one bar per period, telling you when the market was busy. The volume profile takes those same trades and stacks them by price, telling you where the business was done. The second view is the one that draws the levels.

Think of a contact list sorted two ways, by date or by name: the same entries in both views, and the question you are asking decides which sort is useful. Nothing is added or removed when you re-sort. The data is identical. Only the answer it can give you changes.
The earlier lesson on vertical versus horizontal volume named this contrast and touched the point of control in passing. This lesson owns the profile reading in full. If the two-axes idea is fuzzy, go back and read that lesson first, because everything here builds on it.
What Standard Volume Answers
Standard volume is a time series. Every bar on the chart gets one volume bar beneath it, and that bar answers a single question: how much changed hands during this period.
That makes it the right tool for effort. Wyckoff built an entire method on comparing effort, meaning volume, against result, meaning price movement. A wide-range candle on huge volume that closes near its high is effort producing result. A wide-range attempt on huge volume that goes nowhere is effort failing, and that failure is information.
Climaxes live in this view too. A climactic bar is defined by its volume relative to the bars around it, and you can only see that relationship in the time series. The spike stands out because the bars before it were smaller.
Drying pullbacks are the mirror image. When price pulls back on shrinking volume, the time series shows the selling losing participation bar by bar. That pattern is invisible in any price-sorted view, because the profile does not care about sequence.
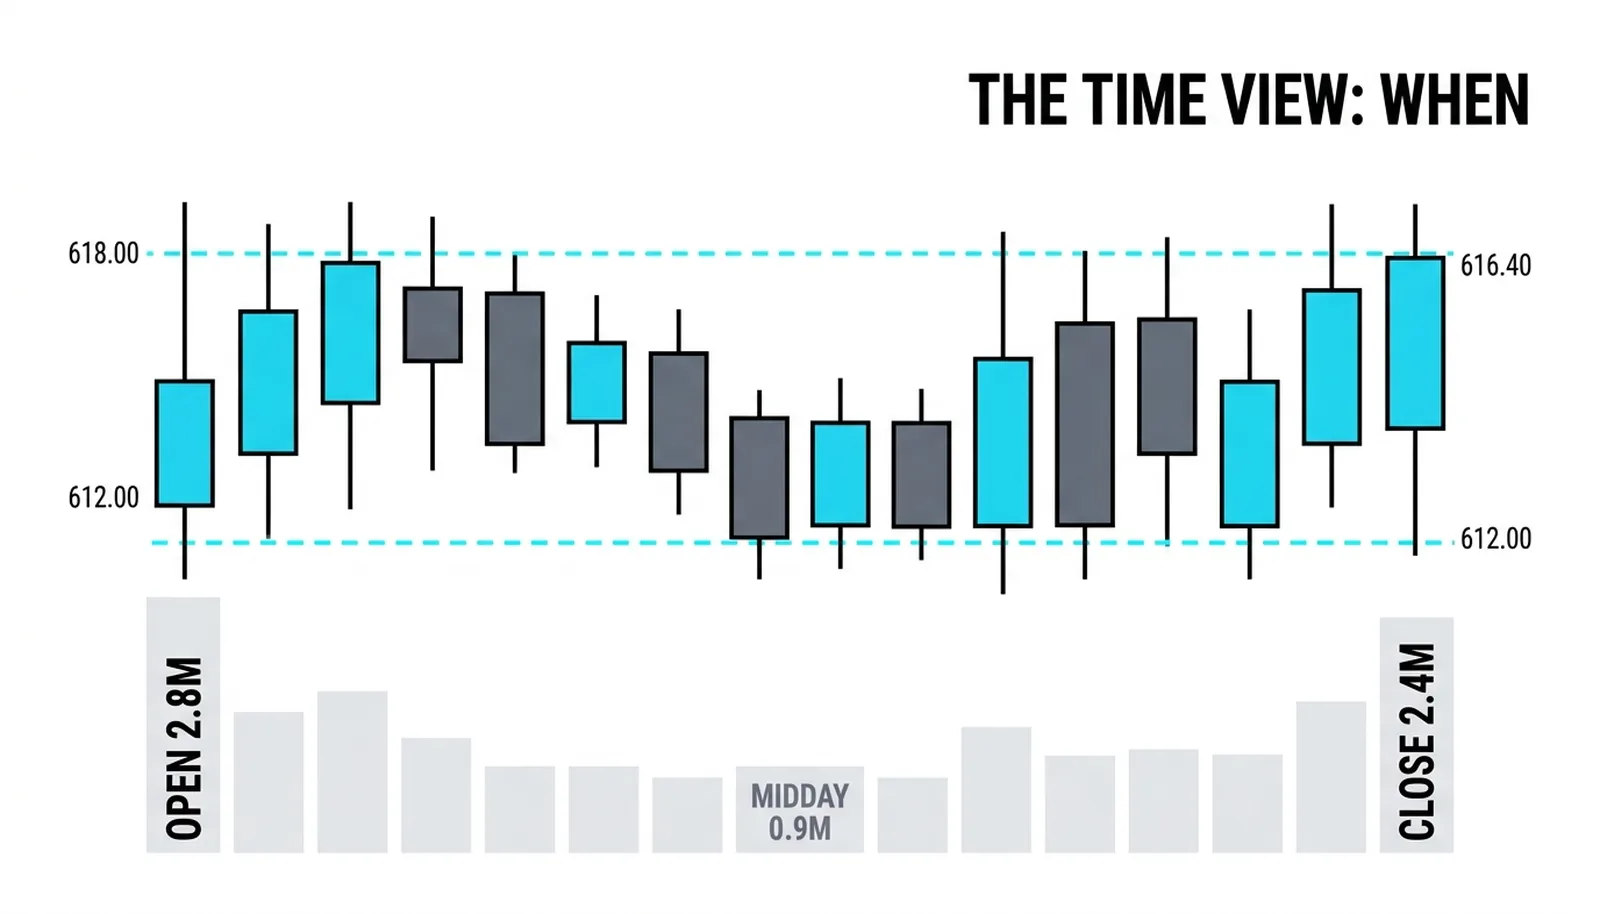
So standard volume owns the when questions:
- When did the crowd show up?
- When did the move have real participation behind it?
- When did interest dry up, and did the pullback or the rally carry the heavier flow?
Confirmation belongs here as well. A breakout bar with a volume bar twice its neighbors confirms itself in the time view. You do not need a profile to see that.
What the Profile Answers
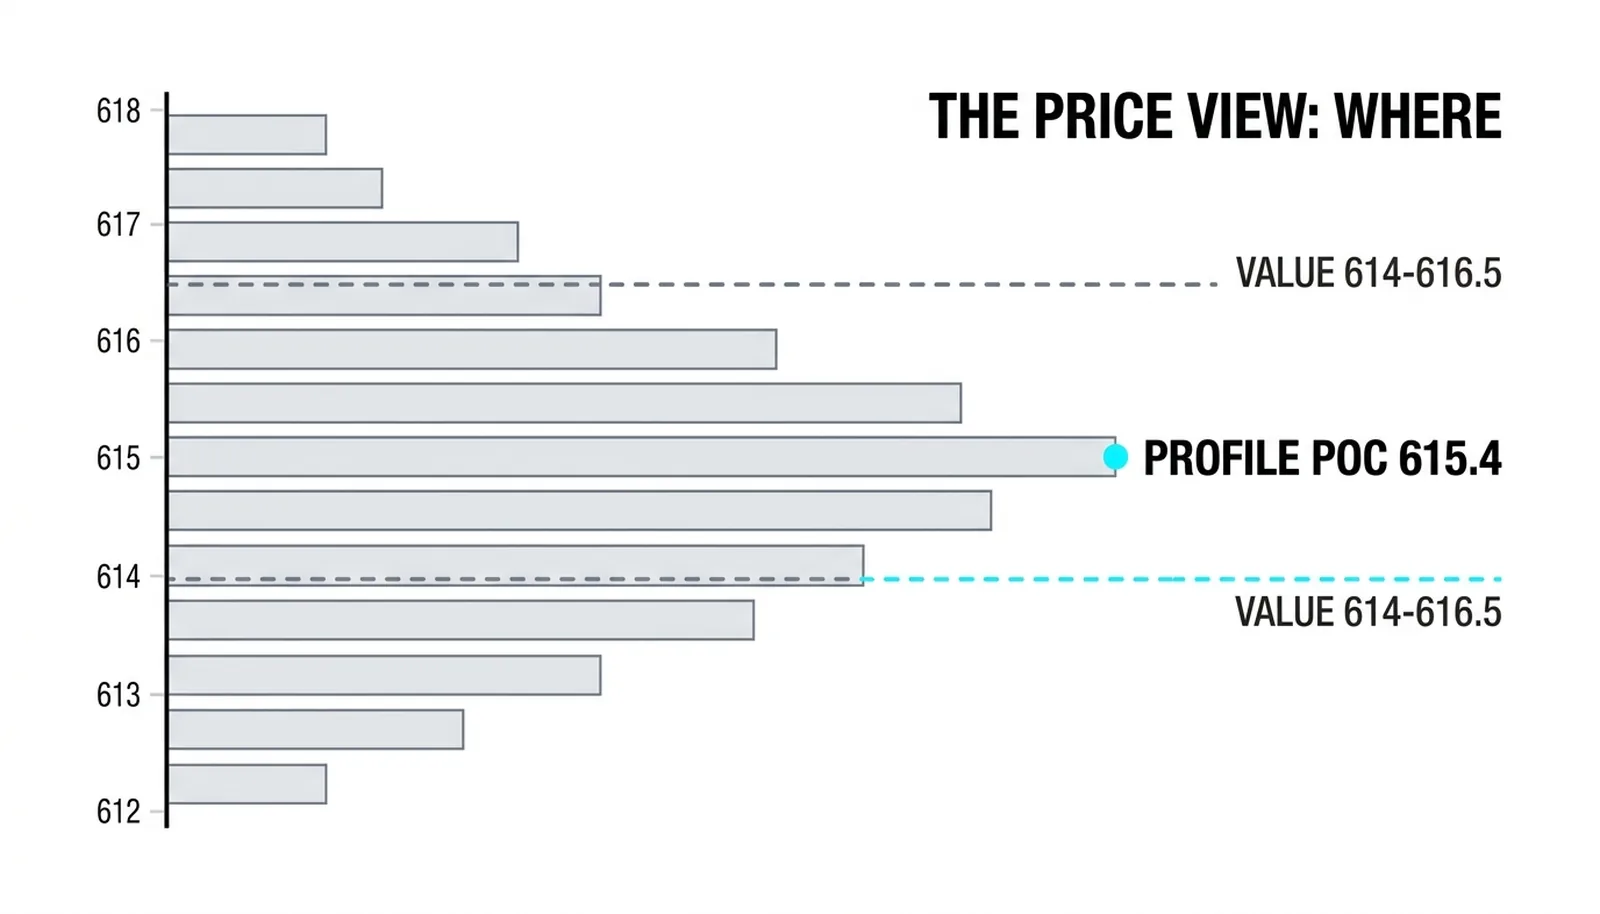
The profile rotates the same data ninety degrees. Instead of asking how much traded each hour, it asks how much traded at each price. The output is a horizontal histogram sitting on the price axis, and its shape is a map of acceptance.
Acceptance is the core concept. Prices where heavy volume traded are prices both sides agreed to do business at. They were accepted. Prices where little volume traded were rejected or rushed through. The market spent time and contracts at the accepted prices and passed quickly through the rest.
That distinction is what draws levels. The fattest part of the profile, the point of control, marks the single most accepted price of the window. The thin zones above and below it mark prices the market treated as transit. Support and resistance stop being lines you draw by eye and become prices the tape itself voted on.
The profile owns the where questions:
- Where did the market accept price, and where did it reject price?
- Where is the level a pullback is likely to respect?
- Where can a stop sit so that normal noise leaves it alone?
A level from the profile is a level you can trade against. You can place a stop behind it, a target in front of it, and a size decision on how far away it sits. A time-based bar gives you none of that directly.
The Same Day, Read Twice
Now the honesty. Two things traders get wrong about this pair, and both matter.
First, the profile is not more information. It is the same information re-sorted. On a quiet, balanced day the two views agree almost completely: the busy hours are the hours price sat at one level, and the profile peak sits exactly where the time bars were tall. On those days the profile adds nothing. Traders who treat the profile as a superior feed are wrong. It is a different filing system for the same receipts.
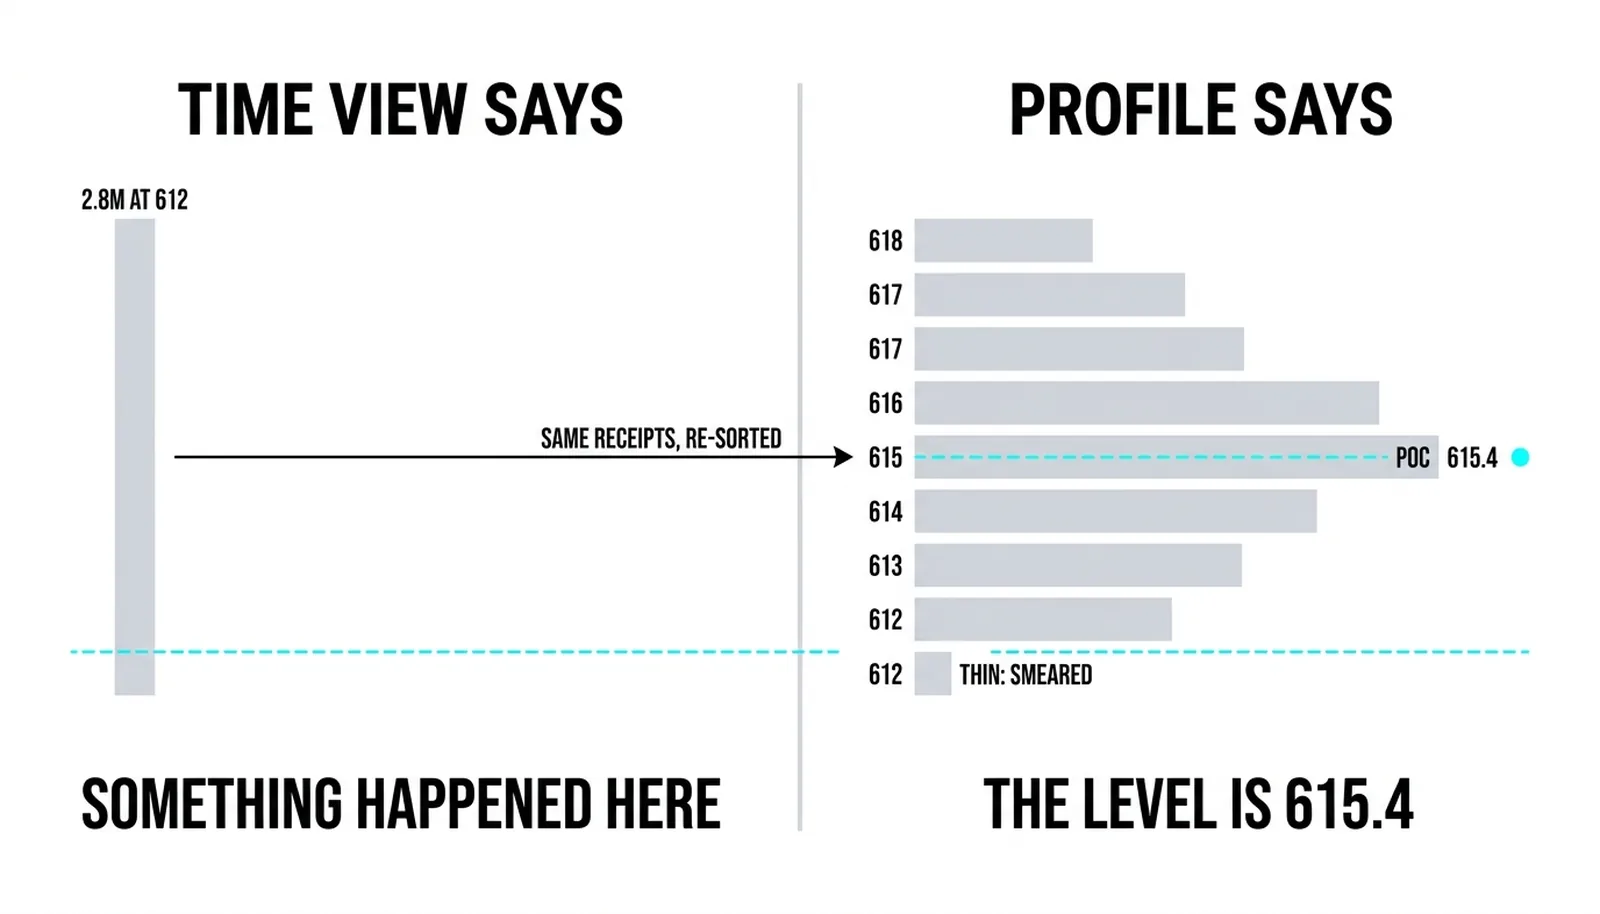
Second, time-based spikes and price-based peaks do not always land in the same place. A huge opening bar can spread its volume across ten prices as price drives in one direction. That bar looks like one event in the time view, but in the profile it smears into a thin layer across a wide range, leaving no level at all. Reading that bar as a single price to defend is the classic standard-volume mistake. The bar tells you something happened. It does not tell you where.
The practical bridge works like this. A heavy time bar tells you something happened at that moment. The profile shows you the price where the day's business actually concentrated. That price, not the bar, is what you can build a trade around.
One Session, Two Views
Here is a hypothetical session, all numbers invented and round. A stock opens at 612, trades between 612 and 618 all day, and closes at 616.4.
The standard volume view prints two heavy bars: 2.8 million in the opening hour and 2.4 million in the closing hour, with a quiet 0.9 million through the midday stretch. Read on its own, this view says the action lived at the open and the close. A trader watching only the time series marks 612, the price of that giant opening bar, as the level the day was built on.
The profile of the same session tells a different story. The heaviest price bin sits at 615.4. Volume built steadily from 612 up to that peak and thinned out above 616.5. The opening bar's 2.8 million was spread across the drive from 612 to 616, so it left no single dominant price. The midday hours, slow in the time view, were quietly stacking contracts at 615.4 the whole time.
What each view caught: the standard view correctly flagged the open and the close as the busy periods, and it would catch any climax or drying pullback inside the day. What it missed was the level. It pointed at 612 because that is where the biggest bar printed, but 612 was a starting point, not an accepted price.
What the profile caught: 615.4 was the price both sides kept agreeing to, all day, regardless of when the loud bars printed. It missed the timing entirely. From the profile alone you cannot tell whether the morning or the afternoon carried the conviction, or whether the close was strong or exhausted.
The level worth marking is 615.4. The time view told you when to pay attention. The price view told you what to pay attention to.
| Question | Standard Volume Answer | Profile Answer | Which View to Trust |
|---|---|---|---|
| When was the market active? | Two heavy bars at the open and close | Cannot answer; sequence is discarded | Standard volume |
| Did the move have real participation? | Compare each bar's volume to its neighbors | Cannot separate effort by period | Standard volume |
| Where was price accepted? | Guesses from where big bars printed | Peak bin at 615.4, built all day | Profile |
| Where do a stop and target go? | No direct answer; bars are times, not prices | Behind or in front of the 615.4 level | Profile |
Volume Profile vs Standard Volume, Answered
What is a volume profile in trading?
A volume profile is the day's trades re-sorted by price instead of by time. It appears as a horizontal histogram on the price axis, and its widest point, the point of control, marks the most accepted price of the window.
How is volume profile different from volume bars?
Volume bars stack trades by period, one bar per candle, so they show when activity happened. The profile stacks the same trades by price, so it shows where activity concentrated. Same data, different sort order.
Which is better, volume profile or standard volume?
Neither, because they answer different questions. Use standard volume for effort, climaxes, and confirmation; use the profile for acceptance and the levels you trade against. On quiet, balanced days they agree so closely that the profile adds nothing anyway.
What does a volume profile show that volume bars do not?
It shows the exact price where business concentrated, which is the price you can place a stop or target at. A heavy time bar tells you something happened; the profile tells you the price it happened at, and that price is the tradable output.
The next lessons stay inside the profile. The three profile windows come first, because the window you choose decides which levels even exist on your chart, and then fixed versus anchored ranges, where the starting point of the profile becomes a decision rather than a default.