Session, Daily and Visible Range Profiles
Session, daily, and visible range profiles are three windows on the same tool: one auction at a time, one day at a time, and whatever slice happens to be on your screen. The window you choose decides which questions the profile can honestly answer.

Think of binoculars with three magnifications: the same view through each, one setting for watching a single gate, one for the whole hillside, one for whatever you happen to sweep across. Sweeping carelessly invents landmarks that were never there.
The previous lesson covered how the profile sorts volume by price instead of by time. That contrast is settled. What remains is the choice of frame, and the frame is where most beginners quietly go wrong.
The Session Window: One Auction at a Time
The session profile resets when each trading session begins and closes when that session ends. Every new day starts a fresh histogram, built only from that day's transactions.
It answers one question well: what did today's auction agree on? Where did the most business get done, where was price accepted, where was it rejected, and how did the day's shape develop from open to close.
This is the natural window for day traders. If your trades live and die inside a single session, the session profile is the only frame that matches your horizon. Yesterday's volume distribution is history; it informs context but does not define today's acceptance.
It is also the natural window for reading day-type shapes. The P-shaped and B-shaped profiles, the balanced days, the trend days, all of these are session-level objects. A shape is a story about one auction, and you need one auction's worth of data to read it.
The classic accumulation and distribution framework builds much of the method on studying each day's trading as a complete campaign, and the session profile is the modern instrument for that same habit.
One caution. The session window tells you nothing about where today's value sits relative to last week's. It is deliberately narrow. That narrowness is a feature when you respect it and a blind spot when you forget it exists.
The Daily Window: Structure Over Days
For an exchange-traded market with a clear open and close, the daily profile is essentially the same object as the session profile, drawn at day scale. One day, one distribution, one answer about acceptance.
The terms blur across platforms and asset classes. Some markets trade nearly around the clock and must draw their "day" somewhere, often at an arbitrary settlement or rollover time. On one platform a daily profile means the cash session; on another it means the full 24-hour cycle. Know which definition your chart is using before you read anything into it.
Where the daily window earns its keep is in sequence. A single day's profile is one data point. A run of daily profiles, each with its own point of control and value area, shows whether acceptance is migrating, holding, or overlapping. Rising value areas across several days tell a different story than value areas stacked on top of each other.
That sequential reading is how you connect auction theory to the structure work from earlier levels. Support and resistance drawn from swing highs gets confirmation or contradiction from where daily value has been building.
Keep the window matched to the question. If the question is about this week, read a week of daily profiles in sequence rather than stretching one frame to cover everything.
The Visible Range: A Preview, Not a Measurement
The visible range profile computes over whatever the screen currently shows. Zoom in and it recalculates. Scroll left and it recalculates again. The histogram always reflects exactly the bars in view, nothing more.
This makes it wonderful for a quick structural read of a chosen stretch. You pull up a three-month rally, glance at the visible range profile, and see immediately where the bulk of that move's volume traded. That is a legitimate use.
It is dangerous as a source of levels. Because the profile depends on the frame, the point of control and value area shift every time you scroll or zoom. A level that changes when you move the frame was never a level.
Two honesty beats, stated plainly. First, the visible range profile is a preview tool, not a measurement tool; anything important should be measured with a defined window, a session, a day, or an anchored range with a fixed start. Second, the session window is the natural one for day-type shapes, while the anchored and composite windows covered next lesson are the natural ones for structure, and mixing the windows mixes the questions.
Most bad profile readings trace back to this single habit: treating a scrolling preview as a fixed measurement. Write your levels down from defined windows only.
One Week, Three Reads
Here is a hypothetical illustration with invented round numbers. A stock spends a week trading between 320 and 328.
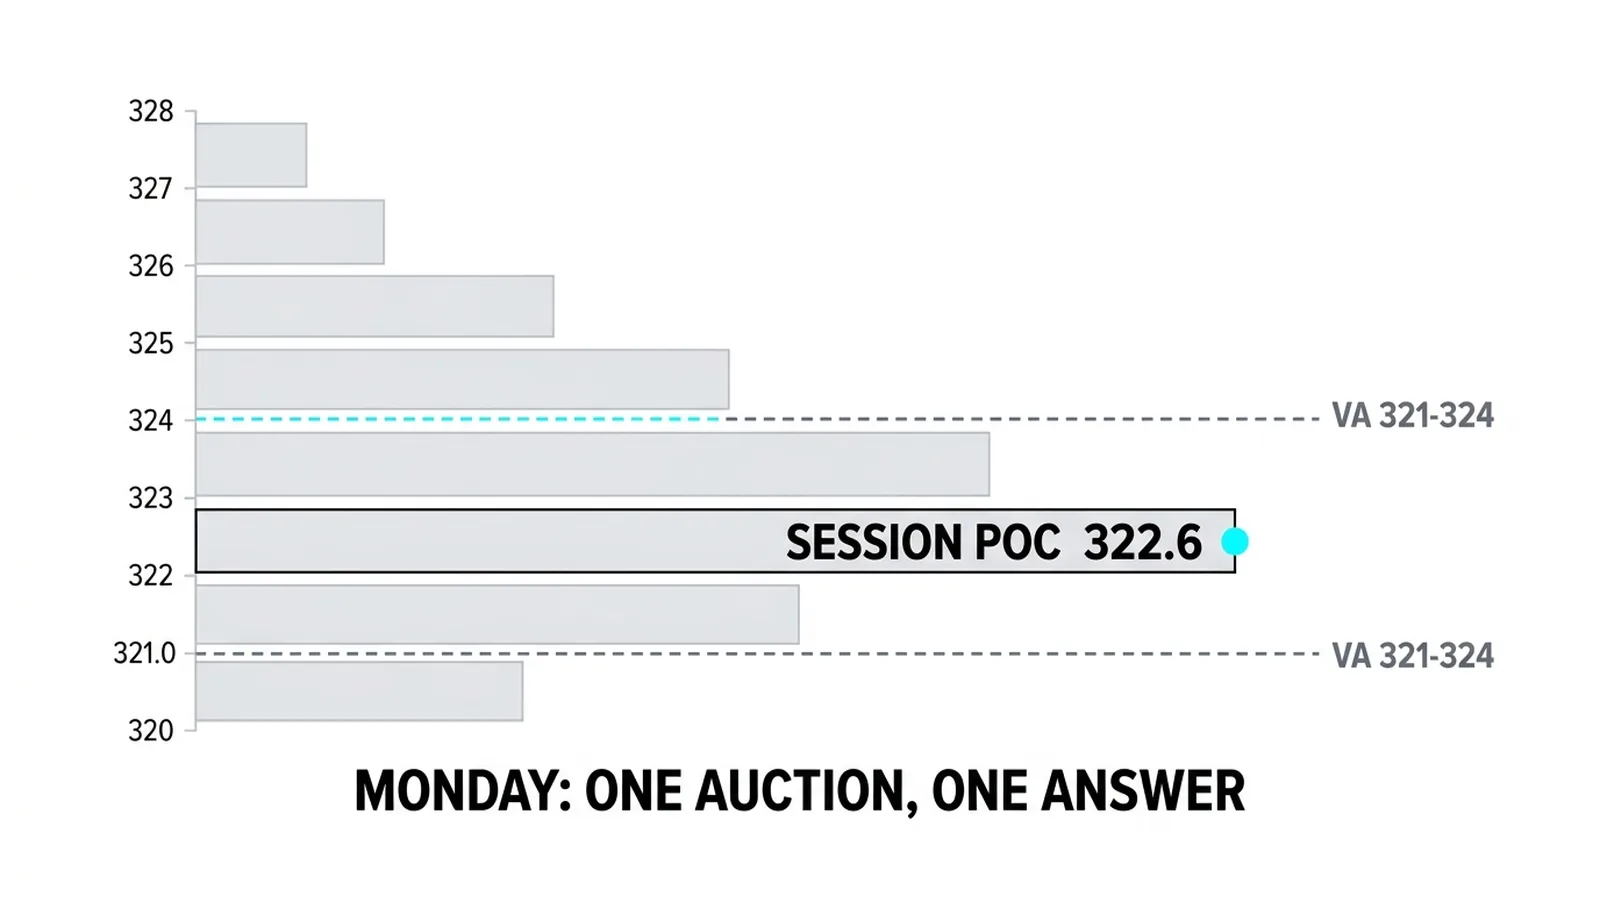
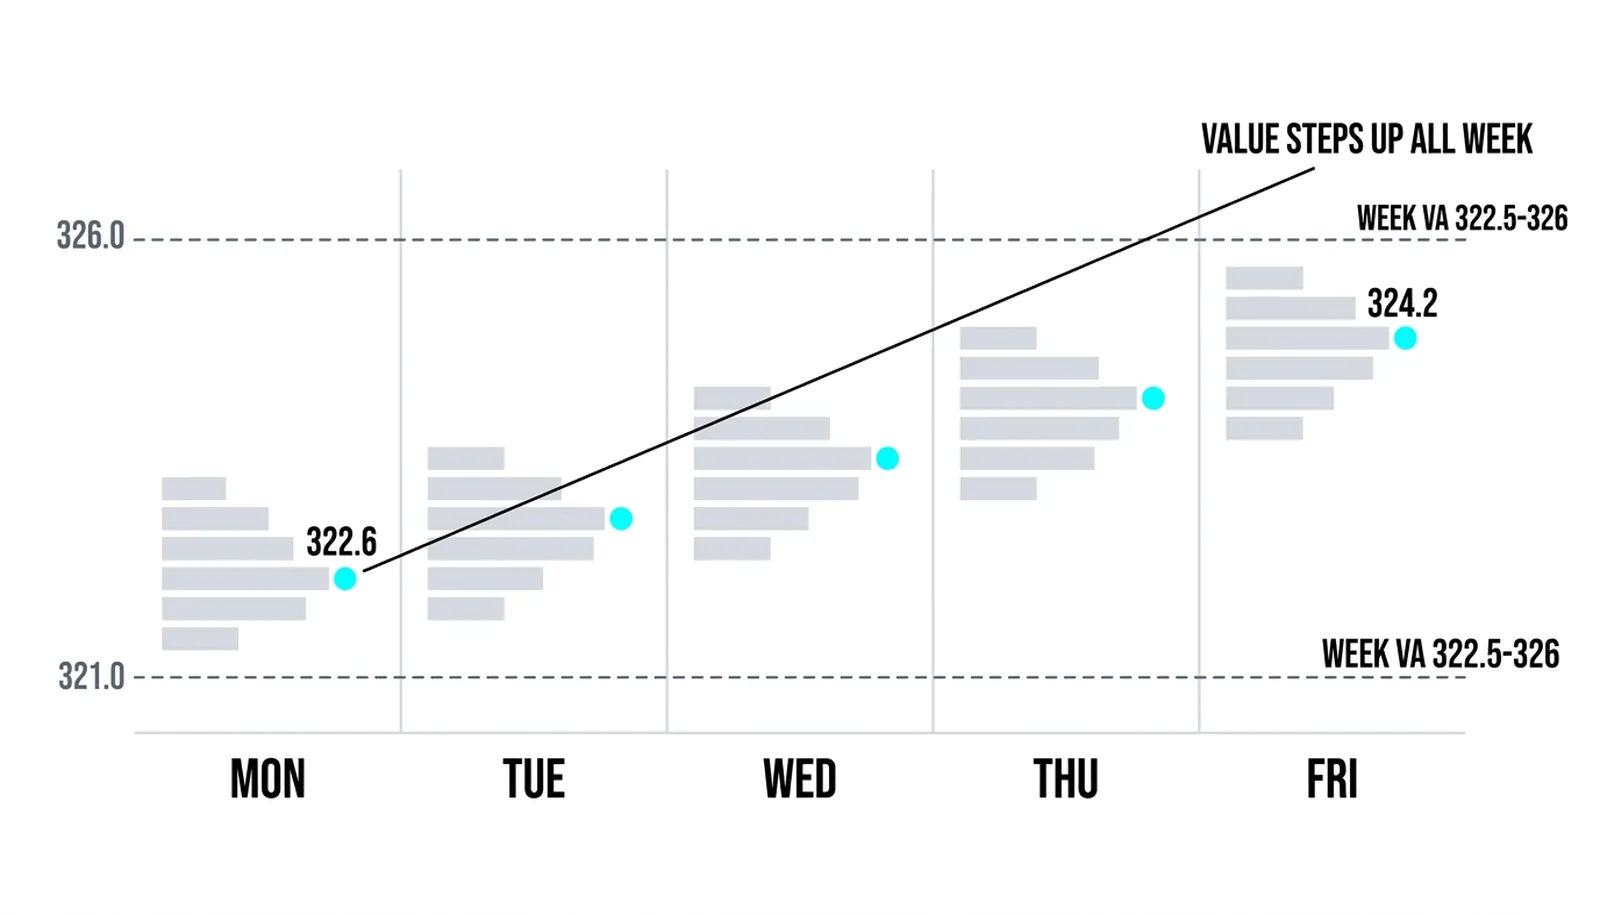
Monday's session profile prints its heaviest bin at 322.6, with a value area from 321 to 324. Read as one auction, Monday found acceptance low in the week's range and spent most of its energy there.
By Friday, the week's combined picture shows its heaviest bin at 324.2, with value from 322.5 to 326. Value stepped up across the week. The five session profiles, read in sequence, show each day's acceptance building higher than the last, and the week-long read confirms the auction migrated upward rather than oscillating in place.
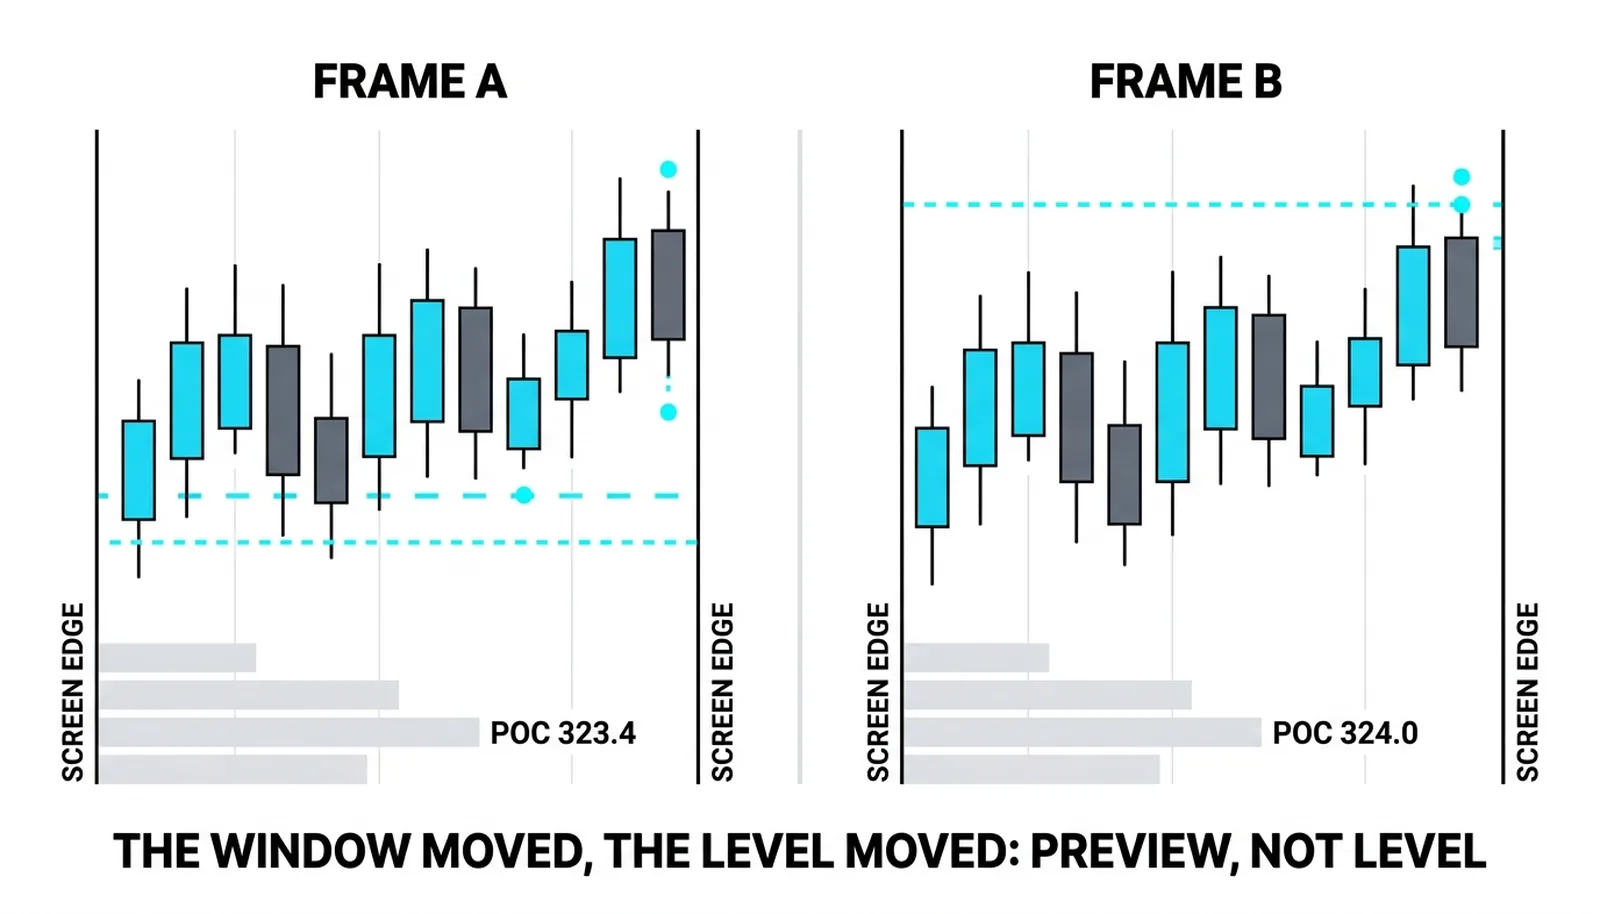
Now the third read. A trader who sweeps the visible range loosely on Wednesday sees a heaviest bin at 323.4. They shift the frame by two sessions and the heaviest bin moves to 324.0, the point of control of the visible window. Nothing about the market changed; only the window did.
That drifting number is a preview, not a level. The session profiles say what each day agreed on. The week-long read says where the multi-day auction settled. The visible range number says only what the current crop of bars happens to contain, and it would be a mistake to mark 323.4 on the chart as if it were a fixed reference.
| Window | What it covers | The question it answers | The trap it carries |
|---|---|---|---|
| Session | One trading session, reset each open | What did today's auction agree on? | Blind to anything beyond the current day |
| Daily | One trading day, as the platform defines it | Where is acceptance migrating across days? | Definitions blur across platforms and nearly round-the-clock markets |
| Visible range | Whatever bars are on screen | What does this chosen stretch look like at a glance? | Levels move when you scroll; a preview mistaken for a measurement |
| Anchored / composite (next lesson) | A fixed, user-defined span | Where did volume concentrate from a specific event or across a chosen structure? | A poorly chosen anchor produces a meaningless profile |
Session, Daily and Visible Range Profiles, Answered
What is a session volume profile?
It is a volume profile built only from one trading session, resetting at each open and closing at each close. It shows where that single auction concentrated its business, making it the standard tool for day traders and for reading day-type shapes like P-shaped and B-shaped profiles.
What is the difference between session and daily volume profile?
In exchange-traded markets with a clear open and close, they are essentially the same object at day scale. The difference appears in markets that trade nearly around the clock, where the platform must draw the "day" at an arbitrary cut, and in how you use them: session profiles are read one auction at a time, while daily profiles are read in sequence to track migrating acceptance.
What is a visible range volume profile?
It is a profile computed over whatever bars are currently visible on your screen, recalculating every time you scroll or zoom. It works well as a quick structural preview of a chosen stretch, but its point of control and value area move with the frame, so it should never be the source of levels you intend to trade from.
Which volume profile window should I use?
Match the window to the question. Use the session profile for intraday decisions and day-type reading, daily profiles in sequence for multi-day structure, and the visible range only for fast orientation. For anything you plan to mark, measure, and trade from, use a defined window with fixed boundaries.
Next lesson takes the final step in this block: anchored and composite profiles, where you choose the start of the window yourself and build structural reads across weeks and months. That is where the profile stops describing single auctions and starts describing campaigns.