Fixed Range vs Anchored Volume Profile
An anchored volume profile pins its start to one event and accumulates every session since, while a fixed range profile measures one defined window you choose in advance, a swing or a base with a start and an end. The first answers where the market's agreement has developed since the thing that started it all. The second answers where value sat inside one completed auction. Same math, different questions.

Think of two survey crews. One measures a fixed section of road between two stakes and files its report. The other drives a stake at the bridge and keeps measuring every day the road extends. Each crew answers a different engineering question, and neither is wrong.
The previous lesson covered which window to read: session, swing, or composite. This lesson is narrower. It covers the two deliberate ways of drawing a window, and the discipline each one demands.
The Fixed Range: One Defined Question
A fixed range profile starts and ends where you say it does. You mark the first bar and the last bar, and the tool builds a histogram of volume at each price inside that slice. Nothing outside the slice counts.
That constraint is the point. The fixed range answers one question: where was value inside this defined move? It is the natural tool for reading one swing, one base, one completed auction. When the auction is finished, the profile is finished too. It will not change tomorrow.
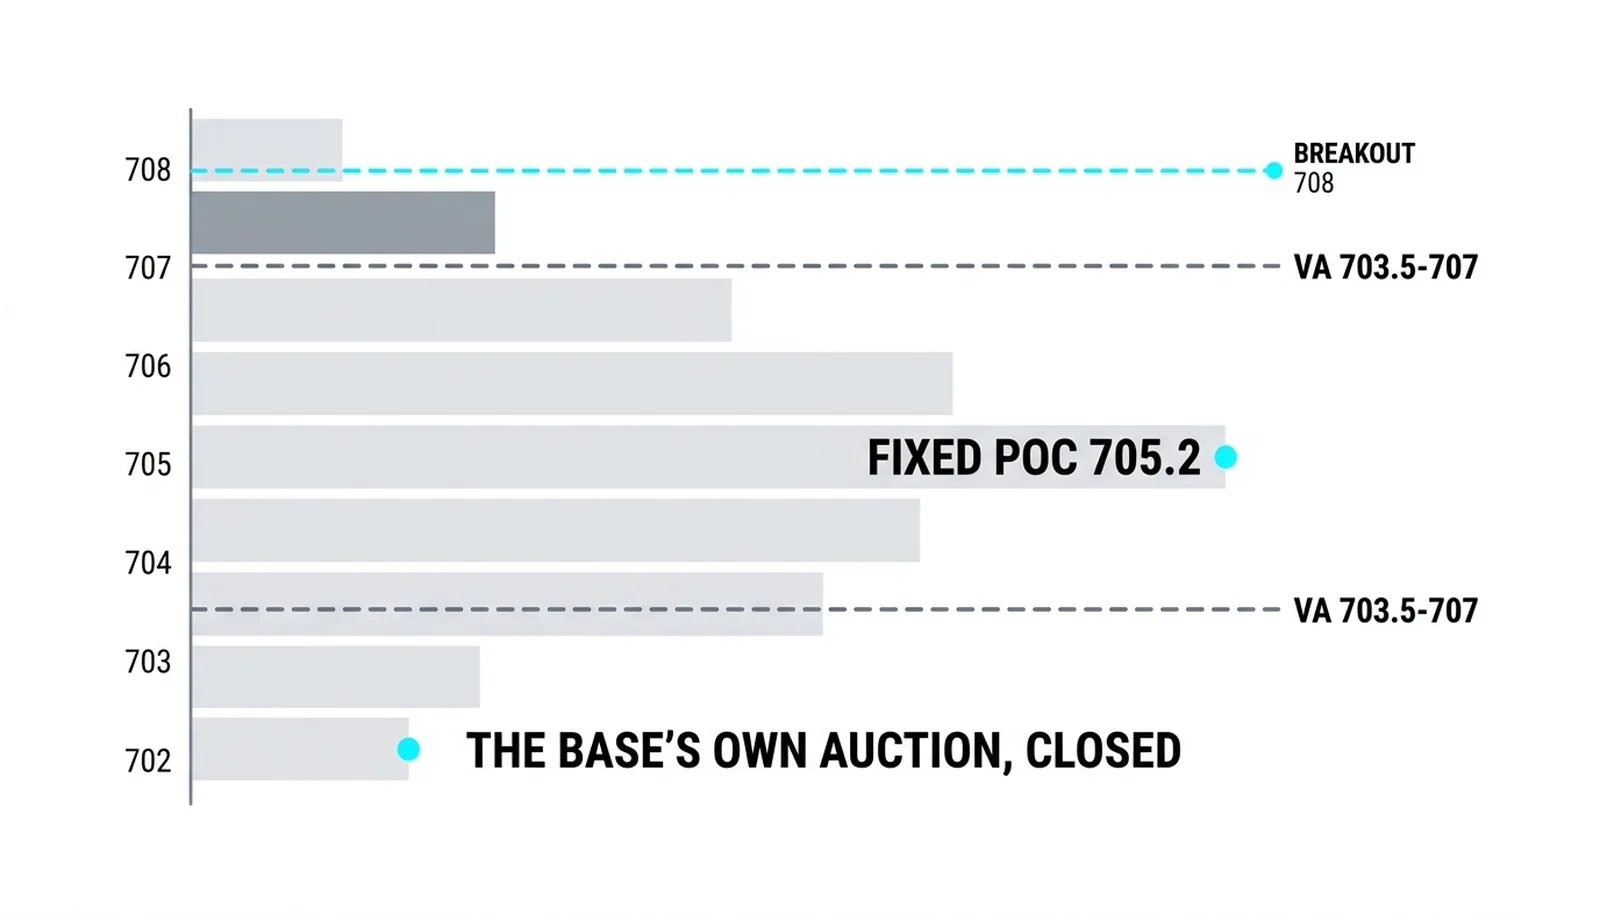
Used well, it reads like an autopsy of a move. A base that built its heaviest volume near the lows tells you buyers did their work down there. A rally whose volume concentrated at the top tells you late money paid up, and that level will matter on the way back down.
The classic accumulation and distribution framework holds that a trading range is a campaign with a cause and an effect, and the fixed range profile is the cleanest modern way to measure where that campaign actually did its business.
Used badly, it is a curve-fitting machine. If you draw the window after looking at where the pretty levels fall, you have not measured anything. You have decorated a bias.
The Anchored Profile: Since the Event
An anchored profile has a start and no end. You pin it to one event, a breakout, a gap, a news day that reset expectations, and it accumulates volume at price from that bar forward. Every session adds weight. The histogram grows more honest as the data piles up.
The question it answers is different in kind: where has value built since that event? Not inside a closed move, but across the open-ended auction the event started. A breakout day begins a new argument about price. The anchored profile records the entire argument.
The read that matters is the anchored point of control, the single price with the most volume since the event. An anchored POC that holds over weeks is the market's standing agreement since that moment. When price returns to it, price is returning to those terms. How it behaves there tells you whether the agreement still holds.
Here is the catch, and it is not a small one. The anchored profile is only as honest as its event. Pin the anchor somewhere arbitrary and you get a number that looks like a level and is not. The anchor must mark a real change in the auction: a breakout that moved the stock, a gap that repriced it, a news day that reset expectations. A random Tuesday produces a random histogram.
The same discipline applies in reverse to the fixed range. A fixed range over a window you chose after seeing the levels is curve-fitting. The range should be defensible before the profile is drawn: marked swings, completed bases, a move with an obvious start and finish. Not whichever slice makes the prettiest histogram.
Choosing Between Them
The question comes first. The window comes second. Traders who pick the tool first end up answering a question nobody asked.
Ask what you actually want to know:
- "Where was value inside this completed move?" Fixed range. The auction is closed, so measure it as a closed thing.
- "Where has value built since this event changed the stock?" Anchored. The auction is still running, so measure it as a running thing.
- "Will this level hold on a retest?" Usually anchored, because the level that matters is the agreement the market is still operating under.
- "Where did the old base do its work?" Fixed range, because that campaign is over and its record is final.
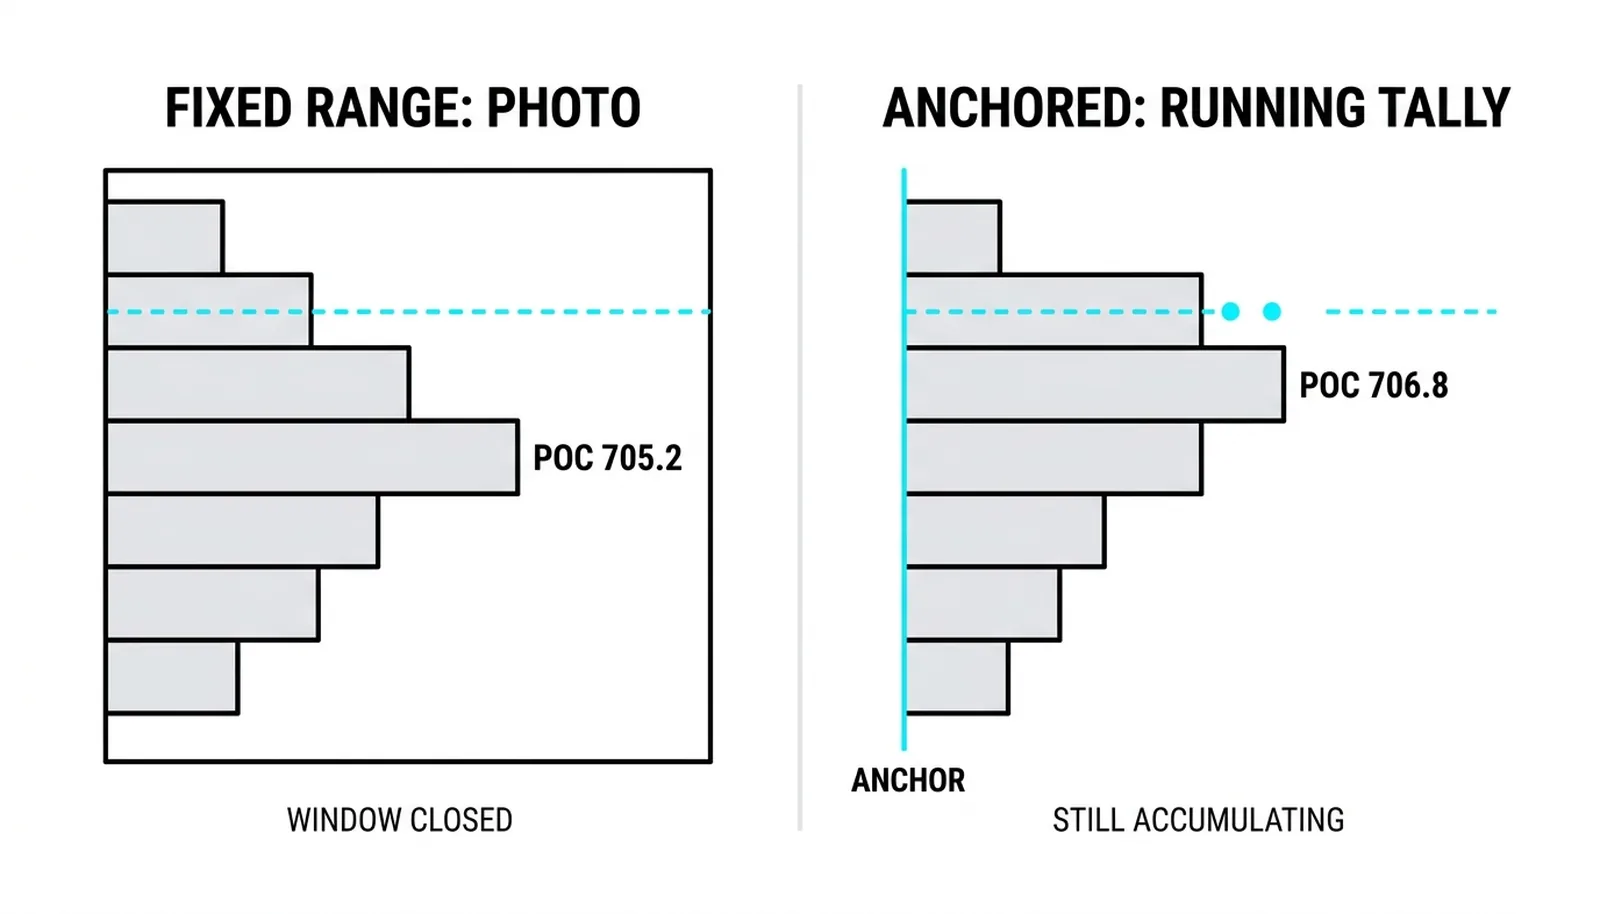
One is a photograph of a finished auction. The other is a running tally of a live one. Confusing the two produces confident readings of the wrong thing.
A practical sequence works well. When a stock breaks out of a base you were watching, the fixed range profile of the base tells you where the accumulation happened. The moment the breakout fires, you start an anchored profile at that session. From then on, the anchored profile becomes your map of the new regime, and the fixed range of the base stays on the chart as history.
Neither tool is more advanced. They are two instruments measuring two different spans of the same auction.
One Breakout, Two Measurements
Hypothetical numbers, round ones, for illustration only.
A stock bases for weeks between 702 and 708. On a Monday it breaks out above 708, and over the following two weeks it runs to 716.
Measurement one, the fixed range. Draw the profile over the base alone, first bar of the range to the last bar before the breakout. Its heaviest bin sits at 705.2, with a value area from 703.5 to 707. That is the base's own auction: the bulk of the campaign's business happened near the middle, slightly below the breakout line. If price ever falls back into the base, 705.2 is where the old crowd did its work.
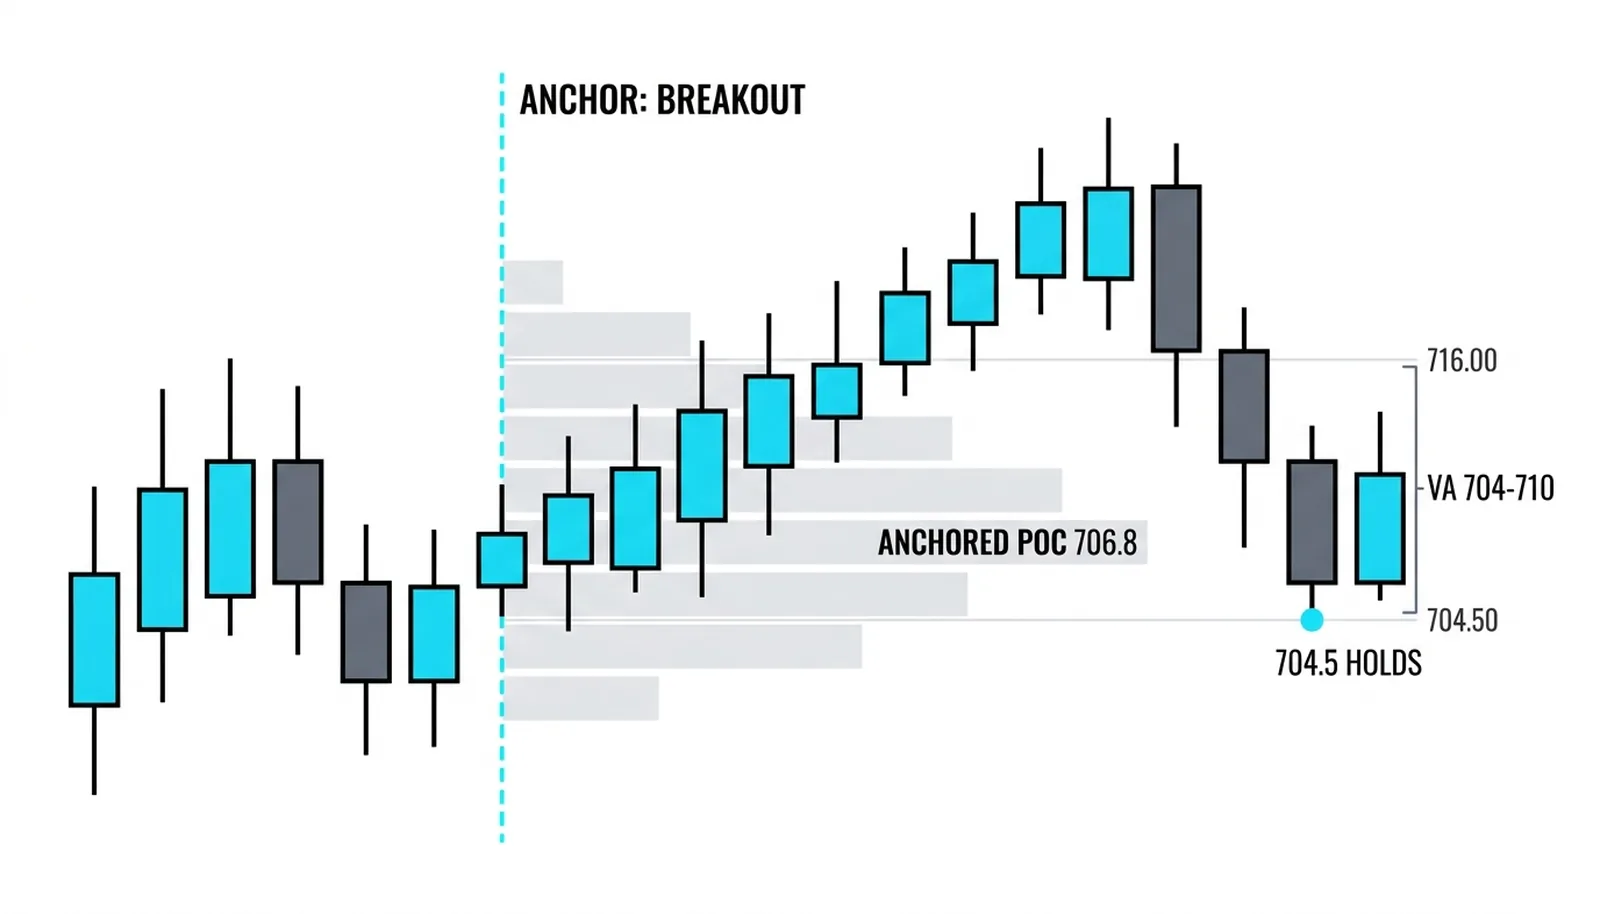
Measurement two, the anchored profile. Pin the anchor at the breakout session and let it accumulate. By the end of the two weeks, its heaviest bin sits at 706.8, with a value area from 704 to 710. Notice it is heavier and wider than the base profile, because every pullback that held above 704 added volume to those lower bins. Each successful retest made the agreement thicker.
Now the stock pulls back from 716. It dips to 704.5, inside the anchored value area, just above its lower edge, and holds. Buyers step in. That is the anchored profile doing its job: price returned to the standing agreement since the breakout, and the agreement held. The fixed range profile of the base could not have shown you that level with the same authority, because its auction ended on breakout day. The anchored profile's auction is still live, and 704 is where the live market has done the most business.
Two windows. Two honest answers. One trade decision informed by both.
| Tool | What It Measures | The Question It Answers | What Disqualifies It |
|---|---|---|---|
| Fixed range profile | Volume at price inside one window with a start and end you define | Where was value inside this completed swing, base, or auction? | A window chosen after seeing the levels, picked to flatter a bias |
| Anchored profile | All volume at price since one pinned event, accumulating each session | Where has value built since the event that changed the auction? | An anchor pinned to an arbitrary bar that marked no real change |
| Anchored POC | The single heaviest price since the event | What are the market's standing terms since that moment? | Treating it as permanent; a new event can supersede the old anchor |
| Fixed range of a base | The finished campaign's volume distribution | Where did the old accumulation or distribution actually happen? | Expecting it to govern price after a new auction has begun |
Fixed Range vs Anchored Profile, Answered
What is a fixed range volume profile?
A fixed range profile is a volume-at-price histogram built over one window you define with a start bar and an end bar. It answers where value sat inside that specific move, and once the move is complete the profile never changes. It is the right tool for reading a finished swing, base, or auction.
What is an anchored volume profile?
An anchored profile is a volume-at-price histogram pinned to one event that accumulates every session from that point forward. It answers where value has built since the breakout, gap, or news day that started the current auction, and it grows more reliable as more sessions add weight to it.
Where should an anchored profile start?
It should start at a bar that marked a real change in the auction: a breakout from a base, a gap that repriced the stock, or a news event that reset expectations. An anchor pinned to an ordinary bar produces a histogram that looks like a level and is not, because nothing actually began there.
Which profile should I use for support and resistance?
Use the anchored profile for levels in the current, live auction, since its point of control and value area reflect the agreement the market is still operating under. Use the fixed range profile for levels inside a completed move, like an old base, where the record is final. The question you are asking decides the tool, never the other way around.
Next in Level 9, the profile stops being a blob and starts being a shape. P-shaped and B-shaped days read the silhouette of the histogram itself, and each shape tells you who finished the day in control.