Volume Profile Meets Market Structure
Structure and the volume profile answer different halves of the same location question. Swing structure tells you the direction and the condition of the market: trend or range, which levels broke, where the bracket edges sit. The profile tells you which price inside a zone actually matters, because it shows where volume was accepted and where it was rejected. Put them together and you stop trading zones the width of a postcode and start trading specific prices with specific reasons behind them.

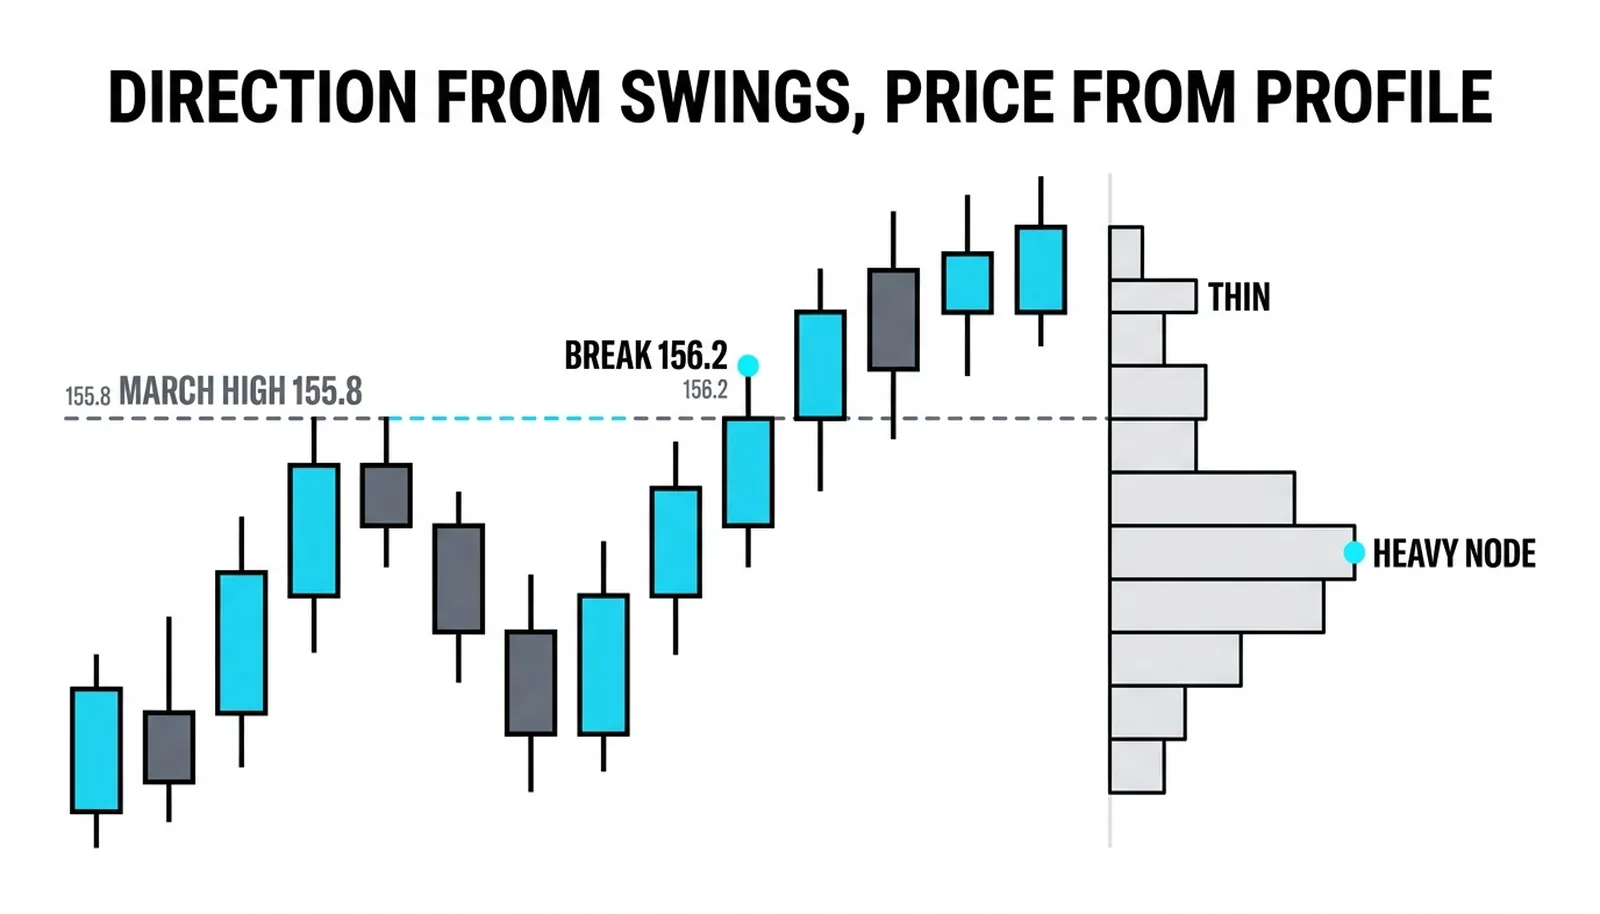
Think of a carpenter checking a board edge against two straightedges: when both agree, the edge is true, but testing the same edge with the same tool twice proves nothing new. Structure is one straightedge. The profile is the other. This final lesson of the profile block bolts the volume work onto the swing framework from the earlier levels, so you should already know how to mark swing highs and lows and read trend condition. What follows is the workflow that joins them.
The Division of Labor
Structure comes first, always. Mark the swing highs and lows, decide whether the market is trending or ranging, note which levels broke and where the bracket edges sit. This order matters because the profile read changes meaning depending on condition. A heavy node inside a range is a rotation point. The same node at a breakout level in a trend is a potential pullback shelf. Same shape, different job.
The profile comes second, to refine the zone. A broken resistance backed by a heavy node is a different pullback than one sitting in a thin band. The first has a crowd of prior participants who accepted that price and may defend it. The second is a price the market passed through quickly, with little agreement behind it. A breakout over a low volume area tends to run, because nobody lives there. There are few trapped positions to slow the move and few resting orders to absorb it.
Order flow analysis observes that the strongest zones are exactly where classic support and resistance and the profile's heavy areas coincide. That observation is the spine of this lesson. When the swing map and the volume map point at the same price, the level carries two independent reasons to hold.
The workflow, stated plainly:
- Structure decides what kind of trade is available. Trend continuation, range rotation, breakout, or nothing.
- The profile decides where it lives. Which specific price inside the zone carries the volume.
- The placements lesson completes the plan. Stops go beyond both the swing and the node; targets sit at the far side of thin bands or at the next structural level.
Skip the first step and you will find yourself buying heavy nodes inside downtrends, wondering why support keeps failing. The node was real. The condition was wrong.
Where the Two Records Agree
Start with the cleanest case: a heavy node sitting at a broken swing level. Price broke above an old high, volume built at or just under that high during the retest, and now the pullback arrives. You have two records. The swing record says the market turned from this price before. The volume record says a large number of positions changed hands here. When the pullback holds, both records are confirmed at once.
The second case is the thin band behind a breakout. When price breaks out and the area above it is a low volume region on the profile, the path of least resistance is up through that band. The market crossed it quickly before, leaving little inventory behind. Expect the transit to be fast, and expect any pause to come at the far edge of the band, where the next heavy node begins.
The third case uses multi-day profiles for bracket edges. Build a profile across several sessions of a range and the value area edges often line up with the range's swing extremes. That overlap gives you a bracket edge with two definitions: the price where swings reversed, and the price where acceptance ended. A break of that edge is more meaningful than a break of a level drawn from either source alone.
Notice what all three cases share. The profile never invents a level. It sharpens a level structure already found, or it explains why a move through empty space behaved the way it did.
Confluence Done Honestly
Market profile practice states a rule worth memorizing: confirmation must come from different sources of information. Price breaking above resistance and price sitting above resistance is one fact stated twice. It counts for nothing. A heavy node at a broken swing level is two records agreeing: one about who traded there, one about where swings turned. That is confluence.
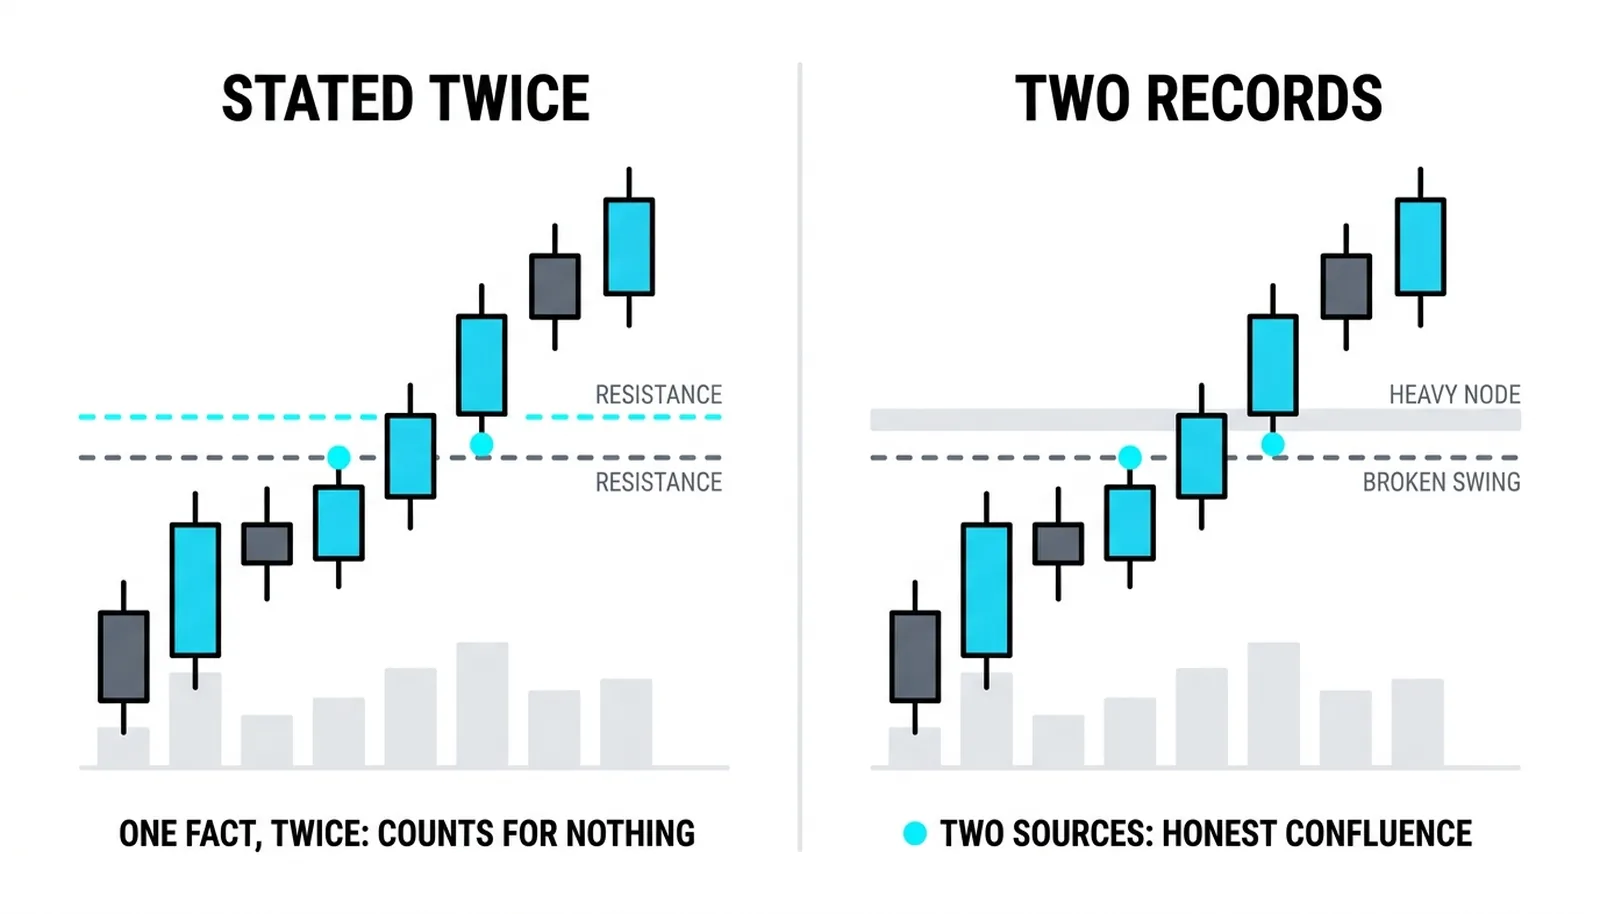
The test is simple. Ask whether your two signals could both fail for the same reason. If yes, they are the same signal wearing two hats. Two price-based tools fail together whenever price moves. A price tool and a volume tool fail for different reasons, which is exactly what makes their agreement worth something.
The second trap is overlay stacking. Adding more tools to a level does not de-risk the trade. A level with five indicators drawn on it fails exactly like any other level when the market decides to go through it. Confluence narrows location. It never guarantees outcome.
This is where traders talk themselves into oversized positions. The chart looks crowded with agreement, so the trade feels safe. It is not safer. It is just better located. Keep the risk sizing the same as any other trade, and let the confluence improve your entry price rather than your confidence.
Two honest sources, well placed, beat six redundant ones every time.
Where the Two Maps Agree
A hypothetical stock is trending up, printing higher highs and higher lows. The March swing high sits at 155.8. Price breaks above it, printing 156.2, and rallies to 158.4 before stalling.
Anchoring a profile at the breakout shows heavy congestion between 156.4 and 157.2, built during the retest that followed the break. Above, a thin band runs from 158.0 to 158.8, an area price crossed quickly on the way up.
The pullback returns to 156.8. Two records now sit at the same address. The broken March high at 155.8 marks where swings turned. The heavy node from 156.4 to 157.2 marks where volume was accepted. The trader enters at 156.9, places a stop at 155.4 below both the swing and the node, and targets 159.6, just through the thin band.
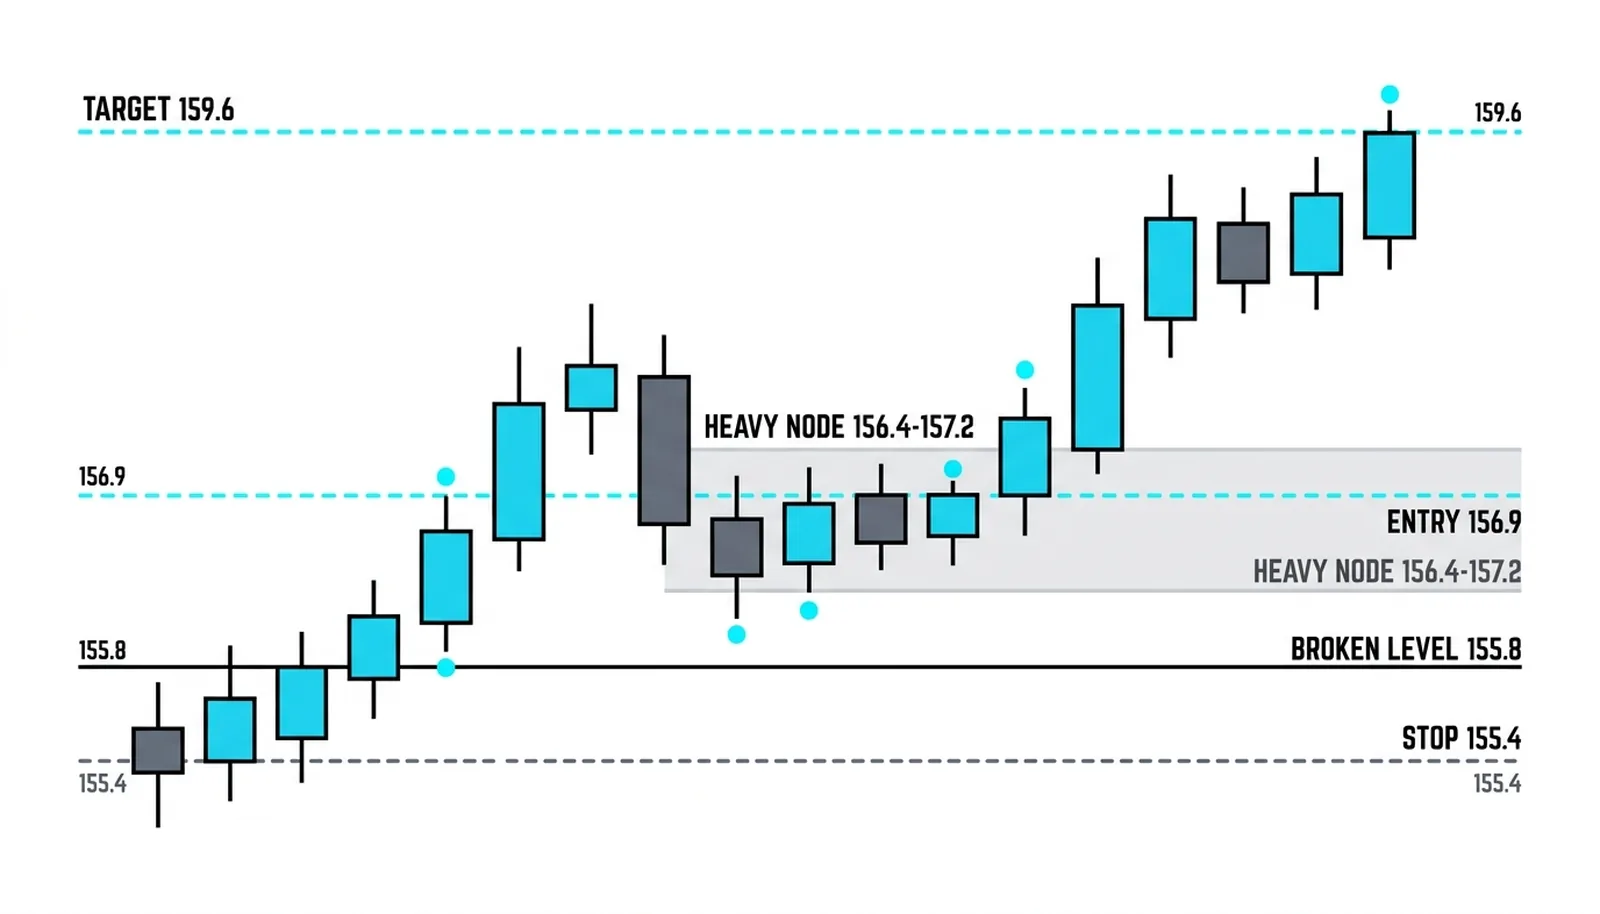
Price holds at the node, lifts, and the transit above 158.8 arrives quickly, exactly because the band was thin. Little inventory, little resistance, fast travel. The target fills at 159.6 near the far edge of the empty zone.
Now the falsification. If price had accepted below 155.4, both records would have failed together: the old swing broken back downward and the heavy node rejected. That single event ends the idea, and the stop placement means the exit happens at the moment the thesis dies, not after hope runs out.
| Structural feature | The profile partner | The combined read | What would falsify it |
|---|---|---|---|
| Broken March high at 155.8 | Heavy node at 156.4 to 157.2 | Pullback shelf with two independent reasons to hold | Acceptance below 155.4 |
| Rally leg to 158.4 | Thin band at 158.0 to 158.8 | Fast transit expected once price re-enters the band | Stalling and rejection inside the band |
| Uptrend of higher highs and lows | Volume building at each retest, not at highs | Healthy trend, pullbacks are opportunities | Heavy volume printing at the highs instead |
| Next swing objective above | Target at 159.6, past the thin zone | Exit where the next congestion begins | Failure to reach 158.8 at all |
Volume Profile and Market Structure, Answered
How do you combine volume profile with market structure?
Read structure first for direction and condition, then use the profile to pick the exact price inside the structural zone. Structure says a pullback in an uptrend is tradable; the profile says the entry lives at the heavy node nearest the broken level, with the stop beyond both.
Should you mark structure or profile first?
Structure first, every time. The meaning of any profile feature depends on market condition, so a node read without knowing whether the market trends or ranges is a read without context. Mark swings and bracket edges, then anchor the profile.
What is confluence in profile trading?
Confluence is agreement between independent sources of information, such as a broken swing level and a heavy volume node at the same price. Two price-based signals agreeing is one fact restated and adds nothing. True confluence narrows location; it never promises the outcome.
Does volume profile replace support and resistance?
No, and treating it as a replacement throws away half the information. Support and resistance mark where swings turned; the profile marks where volume was accepted. The strongest levels are where the two coincide, which is the entire reason this lesson exists.
The profile block is now complete: balanced and imbalanced days, nodes, entries, exits, VPOC migration, and the structural overlay. The next stage of Level 9 moves from where volume sits to how it behaves, reading delta and effort-versus-result so you can judge whether the crowd at a level is absorbing supply or about to fold.