Volume Profile Entries, Exits and Stops
The volume profile turns a chart into a placement map for three decisions: entries sit at the value edges or on pullbacks into heavy zones, targets sit at the next congestion, and stops sit at the price that proves the idea wrong. None of these works alone. An entry without a mapped target is a hope, and a stop without a structural reason is a random donation.

Think of a climbing route with pre-placed protection: you only commit where an anchor can actually go, the anchor defines how far a fall carries, and placing gear where there is no rock is decoration, not protection. The profile works the same way. The heavy zones are the rock. The thin zones are air. Every decision in this lesson hangs off that difference.
The previous two lessons mapped the territory, the heavy zones where two-sided trade happened and the thin zones price crossed in a hurry. This lesson owns what you do with that map: where you get in, where you get paid, and where you admit you were wrong.
Entries at the Edges and in the Zones
Entry logic splits on one question: is the day balanced or trending. The profile answers that before you place anything.
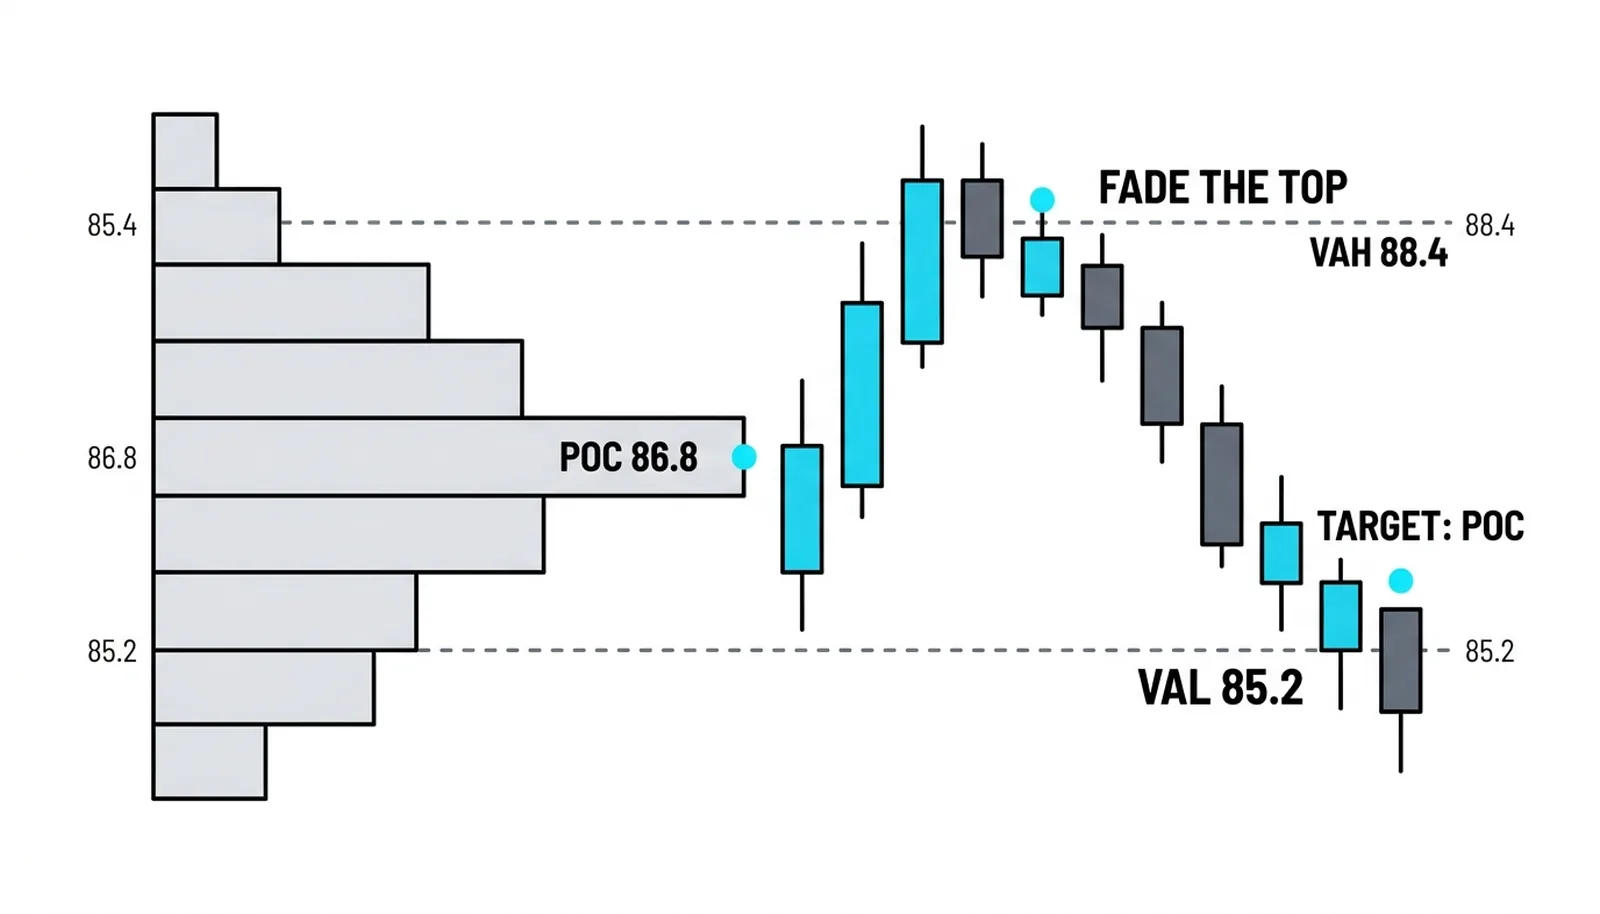
In balance, price rotates around the point of control inside a D-shaped distribution. The trade is the rotation fade. Price stretches to the value area high, stalls, and you sell the edge back toward the middle. Or price dips to the value area low and you buy it back up. The second balanced-day entry is the pullback into a heavy zone. Price leaves a high volume node, drifts back into it, and the resting interest there gives you a place to join with the crowd that already showed its hand.
In imbalance, the fade inverts. A trend day accepts price beyond the value area, so the entry is acceptance itself. You buy once price holds above the value area high, ideally on the retest that confirms the old ceiling now acts as a floor. The same logic sells acceptance below the value area low. The retest matters because the first push through often snaps back; the second touch, the one that holds, is where the market tells you the move has sponsorship.
One blunt rule sits under all of this. The market condition picks the tactic, not the other way around. Running edge-fades on a trend day gets you run over. Chasing breakouts inside a balanced bell gets you faded by everyone else. The profile's first job is telling you which game is being played today, and only then do the placements follow.
Entries in short
- Balanced day: fade the value area edges back toward the point of control.
- Balanced day: buy pullbacks into a heavy zone where prior interest sits.
- Trend day: buy acceptance above the value area high, sell acceptance below the low.
- Prefer the retest that confirms over the first thrust through.
Targets and the Scale-Out Ladder
Targets come off the same map the entries did. Price in rotation travels from one edge to the other, so the first target is the opposing edge of the zone you entered from. Beyond that sits the point of control, the price where the most business was done, and beyond that the next heavy node in the direction of the trade.
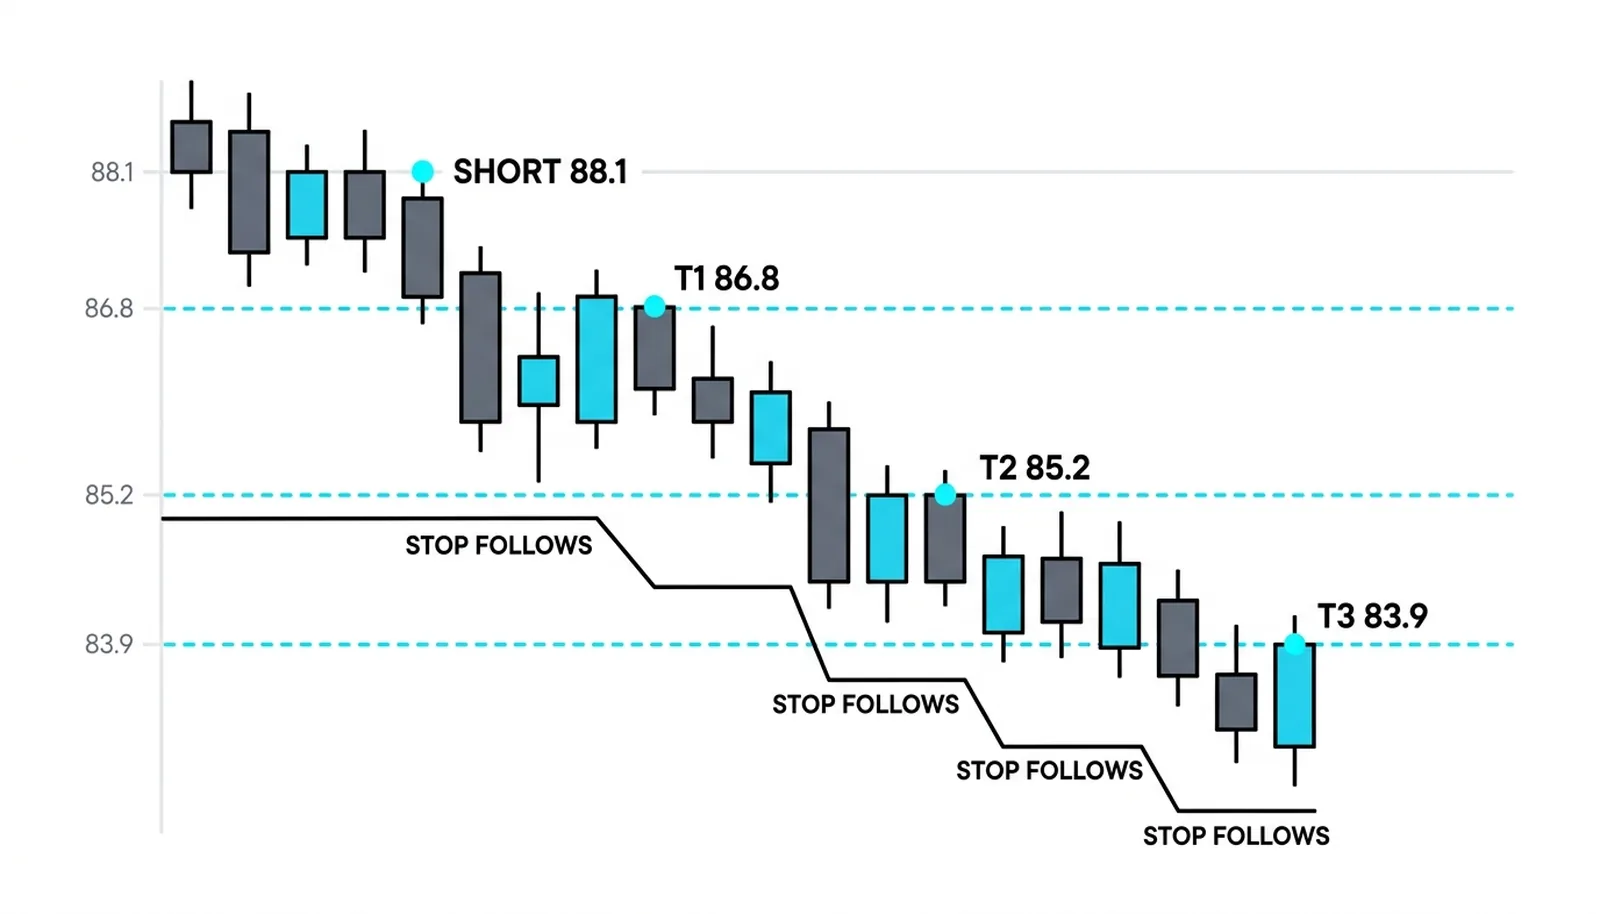
Market profile practice frames this as a three-target sequence, and the framing earns its keep. Take a partial at the first target, another at the second, and let the final piece run toward the third. Each filled target lets the stop ratchet in the trade's direction, so after the first fill the remaining position cannot lose on the original risk. That ratchet is the point. You are converting an open risk into a paid position one rung at a time.
The ladder also matches how price actually behaves. Rotations stall at the middle. Moves through the middle stall at the far edge. Breaks of the edge stall at the next node. Each rung sits where friction is most likely, so each exit is placed where the trade is most likely to struggle, not where you feel like taking profit.
A common failure is holding the whole position for the final target. The first two rungs exist because most rotations do not complete. Paid partials forgive the times the third target never prints.
Stops at the Failure Point
A stop belongs at the price where the idea is proven wrong, not at the price where the loss feels comfortable. If you shorted the value area high because balance should hold, the idea dies when price accepts beyond that edge. The stop goes past the far side of the zone the trade depends on, with room for the overshoot.
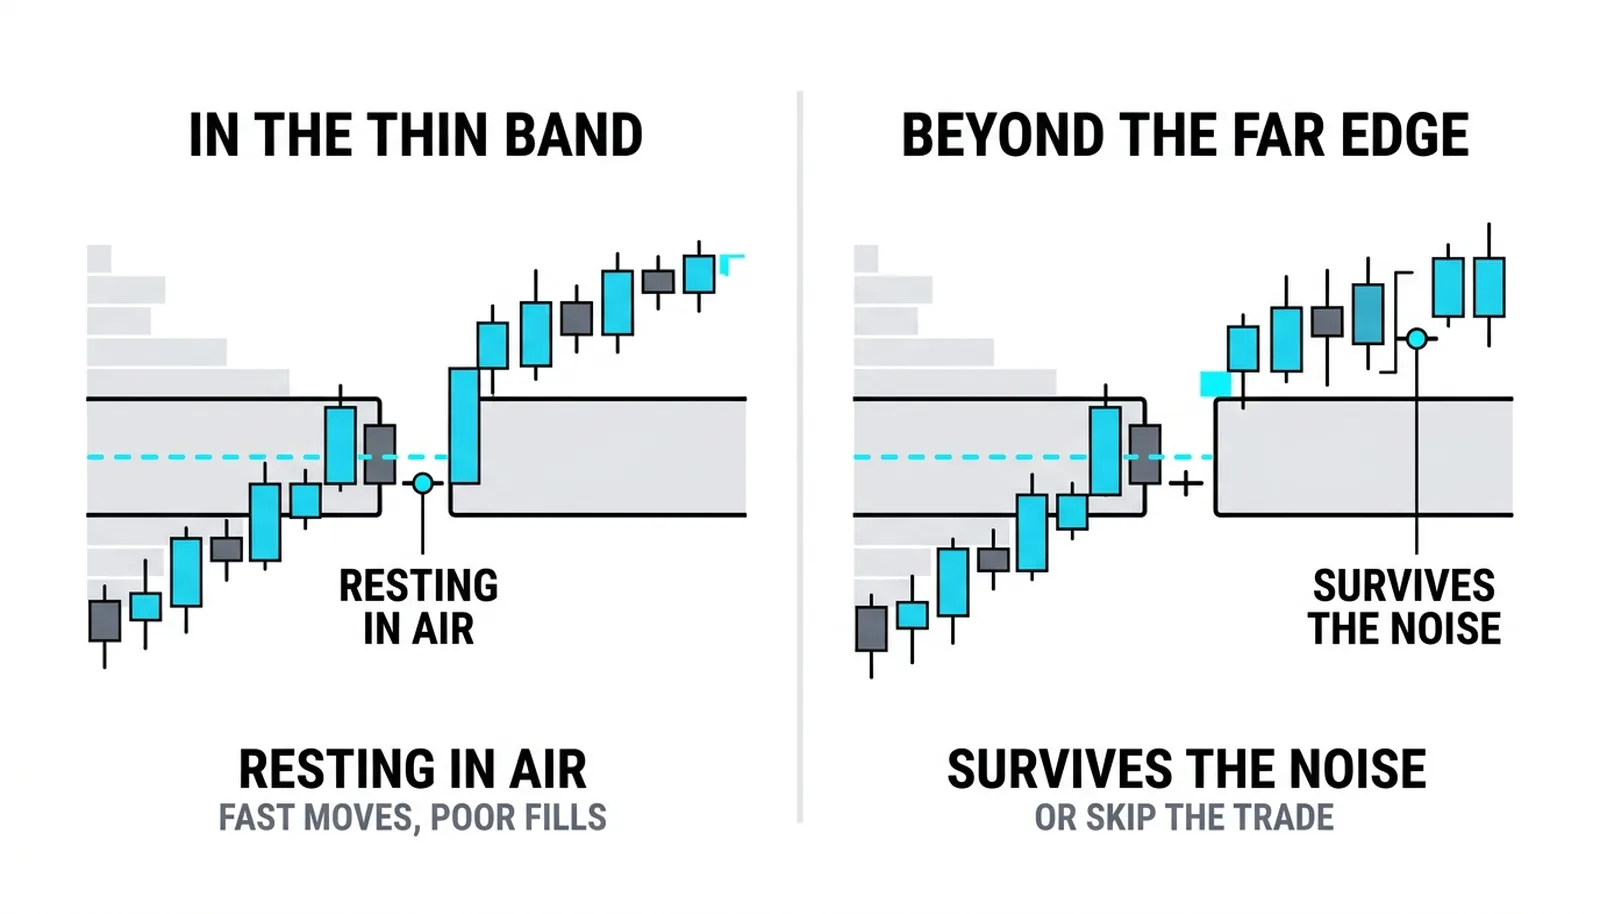
That room is not optional. Profile levels are zones, not lines. Price overshoots a point of control by ticks routinely, and a stop placed exactly at the line dies of noise on a trade that was right. Treat every level as a band, size the position so the band's width is affordable, and accept that a wider structural stop means a smaller position. The sizing absorbs the honesty.
Two placements are banned. The first is the round dollar stop, a fixed amount detached from structure, because the market does not know or care what you risked. The second is a stop inside a thin band. Low volume zones are where price moves fast and fills are poor; a stop resting there is a stop resting in air. If your failure point falls inside a thin zone, push it to the far side of the next heavy node or skip the trade.
One Short, Three Targets, One Fail Point
Everything below is a hypothetical illustration with invented round numbers. A stock has spent a week balancing between 84 and 90. The value area runs from 85.2 to 88.4, and the heaviest single price, the point of control, sits at 86.8.
Price rallies into the 88.4 edge and prints a rejection, a push above that fails to hold. The trader shorts at 88.1. The fail point is acceptance beyond the edge, so the stop sits at 89.6, past the zone, past the noise band. Risk is 1.5 per share.
The ladder lays out three targets. First, 86.8, the fairest price of the week and the most likely stall. Second, 85.2, the lower value edge where rotations usually complete. Third, 83.9, the next heavy node below the balance, reachable only if the low breaks.
Price rotates down and 86.8 fills. One third comes off for 1.3, and the stop ratchets to 88.0, just above the entry. From here the trade cannot lose on the original risk. The read at this stage is simple: the rotation is alive, the middle held as friction, and the remaining position is now a free look at the edge.
Price presses through the middle and 85.2 fills. The second third banks 2.9 from entry, and the stop drops to 86.7, under the point of control. Now the read shifts: the rotation has completed, and the last third is a bet that the balance breaks downward rather than reverts back up through the value area.
Price breaks the low, reaches 83.9, and the final third collects 4.2 from entry. Total taken in stages: 1.3, 2.9, and 4.2 against 1.5 risked. What would have ended the trade early is just as instructive. Acceptance above 88.4, two closes holding over the edge, stops the short at 89.6 for the full 1.5. A stall at 86.8 that reverses back through 88.0 scratches the runner for a small win on the remainder. Every outcome was pre-written on the map before the entry filled.
| Decision | Balanced-day placement | Trend-day placement | The mistake it prevents |
|---|---|---|---|
| Entry | Fade the value area edge, or buy the pullback into a heavy zone | Buy acceptance beyond the value area high on the confirming retest | Fading a trend day or chasing breakouts inside balance |
| First target | The point of control at the middle of the rotation | The next heavy node in the direction of the move | Holding the whole position for a rung most moves never reach |
| Stop | Beyond the far side of the edge being faded, outside the noise band | Back inside the value area, where acceptance is disproven | Dying of noise on a correct idea with a line-exact stop |
| Stop ratchet | To entry after target one, under the point of control after target two | Under each reclaimed node as the move extends | Letting a paid trade round-trip back into a loss |
Volume Profile Entries, Exits and Stops, Answered
How do you use volume profile for entries?
Match the entry to the day type the profile shows. On a balanced day, fade the value area edges back toward the point of control or buy pullbacks into a high volume node. On a trend day, enter on acceptance beyond the value area, ideally on the retest that confirms the old boundary now holds from the other side.
Where do you place a stop using volume profile?
Place it at the failure point of the specific idea, beyond the far edge of the zone the trade depends on. Never use a round dollar amount detached from structure, and never rest a stop inside a low volume band where price moves fast and fills are poor. Treat every level as a band and size the position for the overshoot.
What are the best take-profit levels with volume profile?
The strongest targets are the opposing value area edge, the point of control, and the next heavy node beyond it, in the order the trade reaches them. Each sits where friction is most likely, which is exactly where profit-taking belongs.
How do you scale out of a trade with the profile?
Take a partial at each rung of the ladder and ratchet the stop after every fill. After the first target, move the stop so the remaining position cannot lose on the original risk; after the second, lock in further. The ladder converts open risk into a paid position one stage at a time.
Next in Level 9, the point of control stops being a static line and starts to travel: how VPOC migration across sessions reveals whether the market is building conviction or losing it, and how to read the drift before the breakout shows it.