High Volume Nodes: Congestion Zones at Work
The words "high volume" in a high volume node describe the fattest band of the profile: a price zone where an outsized share of the period's transactions took place. It matters because congestion leaves a mark. Markets return to those prices and defend them with above-average reliability, and the trader who can see the fat zones on a profile holds information the plain price chart never shows.

Think of a hub airport: every airline concentrates its connections there because that is where the passengers already are, flights route back through it all day, and a disruption at the hub ripples across the whole schedule while a delay at a small regional strip touches nobody. The previous lesson covered the thin lanes, the prices the market crossed in a hurry. This one owns the fat zones and the point of control that crowns them.
What the Fattest Bins Record
A node is a band of prices where large participants built and held positions. Order flow analysis frames these as the zones where institutional size was active, and the practical consequence follows directly: the probability that those prices get defended rises when the market returns to them. Size does not commit at a price and then walk away from it without a fight.
Crowning every profile sits the point of control, the single price with the most volume of the entire period. Read it as the fairest price the auction found. The market probed higher, the market probed lower, and it kept coming back to that one line. That repeated acceptance is the signature of agreement between buyers and sellers.
Acceptance is the key word. A price touched once in a spike means little. A price traded heavily for hours means both sides did real business there, and both sides have positions anchored to it. When price drifts away and later returns, those anchored positions become active orders again.
Nodes earn the most trust in one specific spot: where a heavy zone coincides with a classic support or resistance level already marked on the price chart. Two independent records, the horizontal profile and the vertical price history, pointing at the same price. That overlap is where the read stops being a curiosity and becomes a working level.
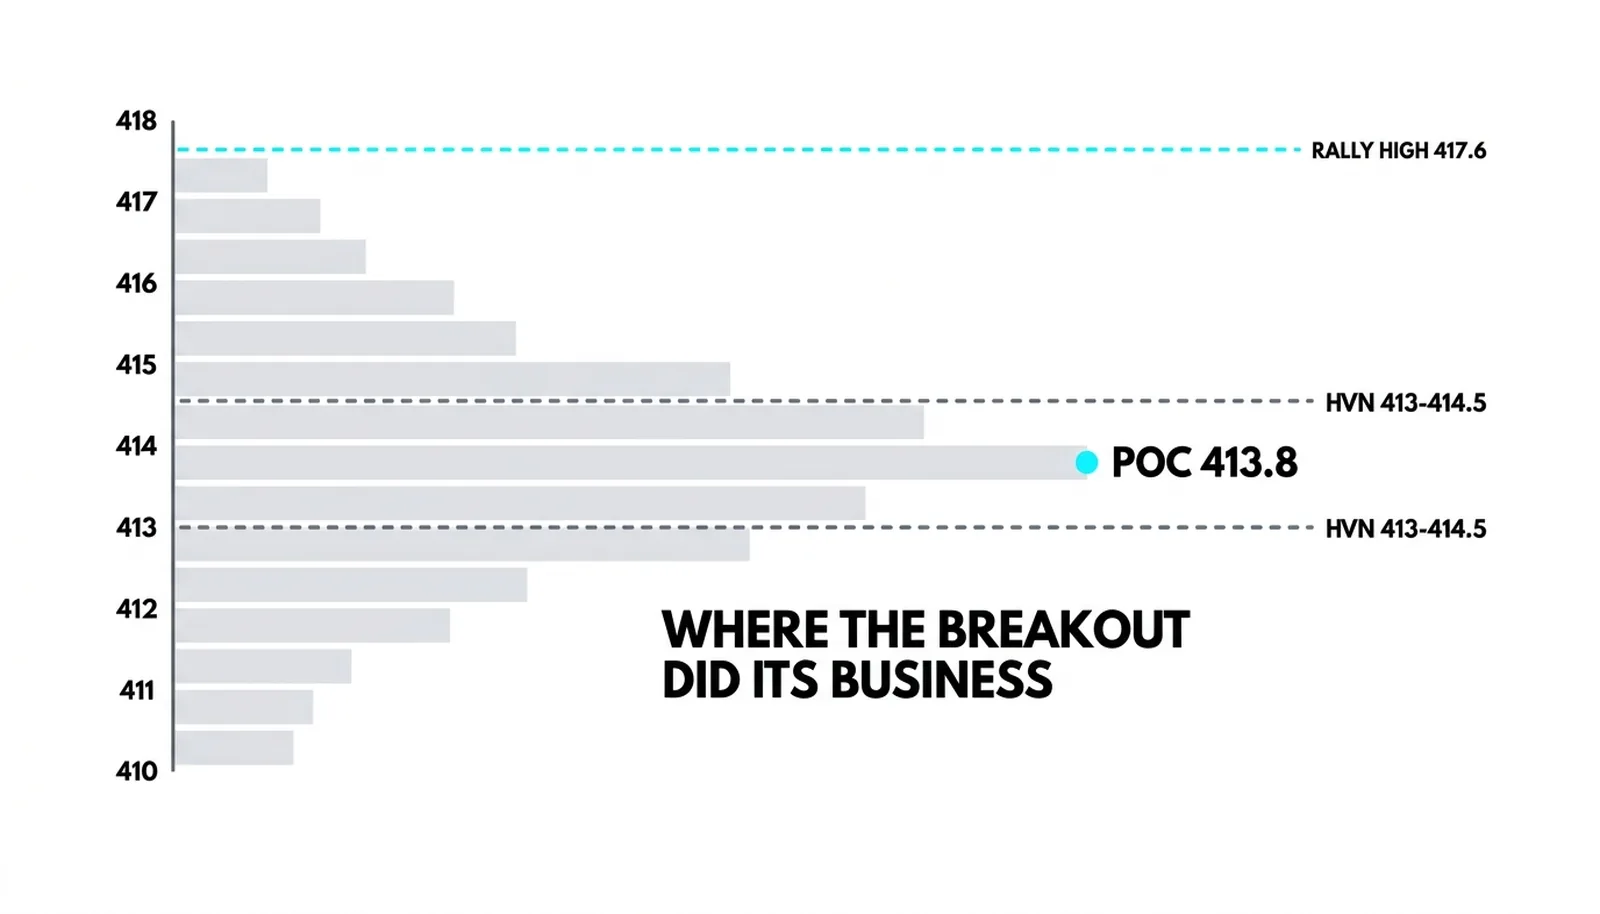
The Naked Point of Control
A naked point of control is a past period's fairest price that later sessions have never come back to touch. It sits on the chart as an untested line, and it is one of the most watched draw targets on any profile chart. The point of control behind it is the anchor of the whole read.
The logic is simple. The market agreed on that price once, with maximum participation, and then left without ever checking it again. Unfinished business of that kind tends to get finished. Price gravitates back toward untouched points of control far more often than randomness would suggest, because the auction left a question unanswered there.
Traders track these lines for two uses. First, as targets: if price is above a naked point of control and starts to weaken, that line below is a reasonable first objective. Second, as reaction zones: when price finally returns to the line, the first touch often produces a response, because the participants who built the original congestion treat the level as theirs.
The setup works best with patience. Mark the naked point of control, wait for price to arrive, and then watch the behavior at the line rather than assuming the bounce. A stall, a rejection wick, a failure to close below: those are the confirmations. The line itself is an invitation, not a guarantee.
When a Heavy Zone Holds and When It Fails
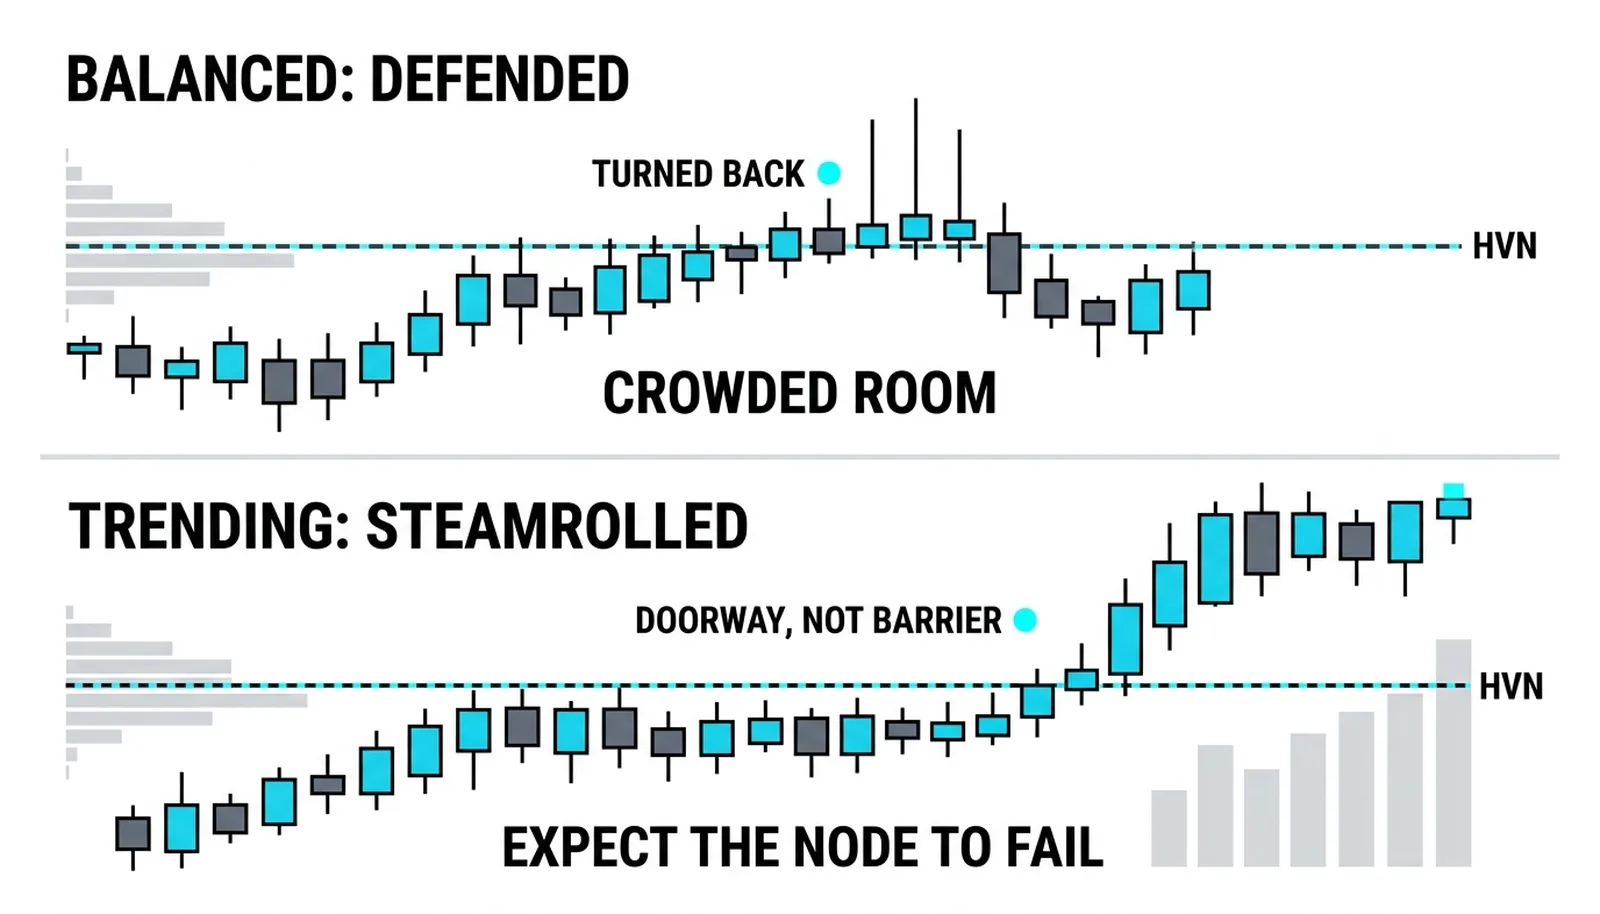
The defend-read belongs to balanced conditions. In a rotational market, a heavy zone acts like a crowded room: price enters, meets the crowd that built it, and gets turned back. That is the environment where nodes do their best work.
A heavy zone is not a wall. A genuine trend day draws a thin, elongated profile and slices straight through nodes that held for weeks. When the market is in imbalance, old congestion gets treated as a doorway, not a barrier. Check the current day's behavior before leaning on any old fat zone: if today's auction is directional and one-sided, expect the node to be steamrolled rather than respected.
The second honesty point is age. Nodes decay. Yesterday's node carries today's participants and today's prices, still fresh in the memory of everyone holding those positions. A node from three weeks back was built in a different auction entirely, by participants many of whom have already exited. The fresher the congestion, the more honest the read.
Put both checks together before trusting any heavy zone. Is the market balanced right now? Is the node recent? Two yes answers justify the defense trade. One no answer demands a smaller size or a skipped trade.
The Naked Point of Control That Held
Every number here is invented to show the mechanics, nothing more.
A stock breaks out above 412 and rallies to 417.6 over three sessions. A trader anchors a volume profile at the breakout and reads it: the heaviest congestion sits between 413 and 414.5, and the single heaviest price, the point of control, is 413.8. Price has not returned to 413.8 since the breakout. That is a naked point of control.
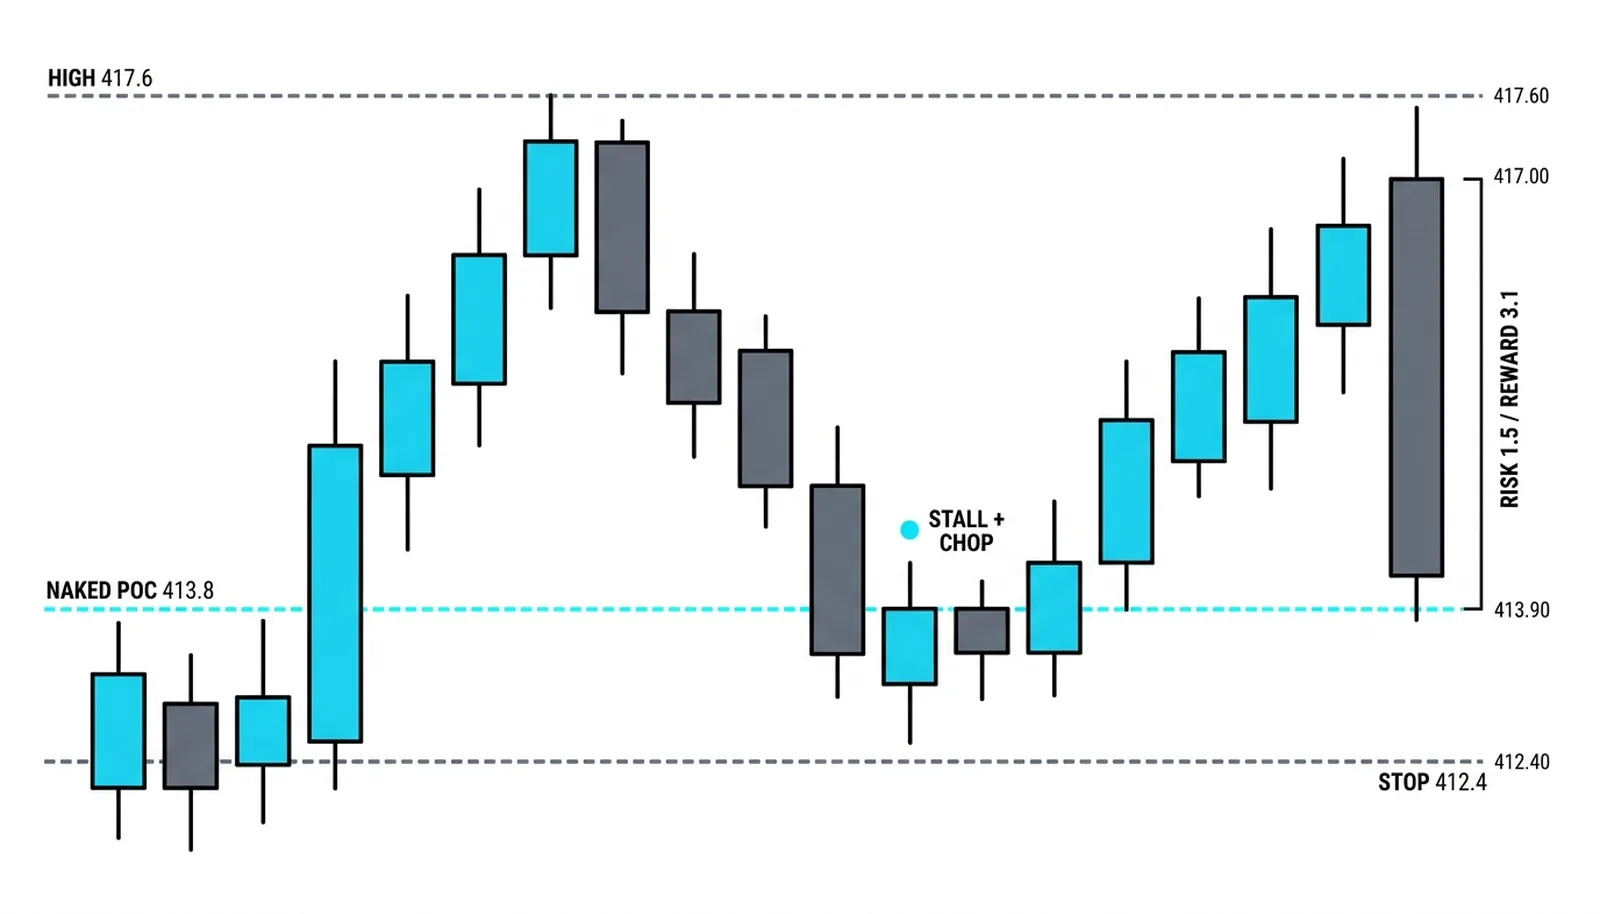
Three days later the pullback arrives. Price slides into 413.8, stalls, and spends two sessions chopping in a tight band around the line. Sellers push, buyers absorb, and no close prints below the congestion. Then price turns back up.
The trader buys the retest at 413.9. The stop goes at 412.4, just below the congestion band, because acceptance below that zone would mean the defense failed and the idea is dead. The target is the 417 highs. Risk is 1.5 points, reward is 3.1 points, a clean two-to-one setup built entirely off the profile.
Read each stage for what it confirmed. The stall at 413.8 showed the old participants defending their price. The two sessions of chop showed acceptance at the line rather than rejection through it. The turn higher confirmed the defense worked. And the invalidation was defined in advance: a close accepted below 412.4 would have ended the idea with a small, planned loss instead of a hopeful hold.
| Level | What Built It | Expected Behavior on Return | What Would Invalidate It |
|---|---|---|---|
| 413.8 point of control | Heaviest single price of the breakout auction | Stall and first-touch reaction | Clean close below with acceptance |
| 413 to 414.5 congestion band | Institutional position-building during the breakout | Absorption of pullback selling | Price slicing through without pausing |
| 412.4 stop zone | Lower edge of the heavy zone | Holds as the line the idea depends on | Acceptance below ends the trade |
| 417 highs | Prior rally peak, supply from the top | Profit-taking and possible resistance | Failure to reach it weakens the reward case |
High Volume Nodes, Answered
What is a high volume node in trading?
A high volume node is the fattest band on a volume profile, a price zone where an outsized share of the period's transactions took place. It marks where large participants built positions, and markets tend to return to those prices and defend them.
What does a high volume node tell you?
It tells you where the market reached agreement with real size behind it. Heavy congestion means both buyers and sellers did serious business at that price, so a return to the zone often reactivates the positions anchored there.
Do high volume nodes act as support and resistance?
They do in balanced conditions, especially when the node overlaps a classic support or resistance level on the price chart. In a strong trend, though, price cuts straight through old nodes, so the read depends on the current day's behavior and the node's age.
What is a naked point of control?
A naked point of control is a past period's fairest, most-traded price that later sessions have never returned to touch. Traders track these untouched lines as draw targets and as reaction zones when price finally comes back to test them.
With the fat zones and the point of control in hand, the next step is watching how the profile behaves over time: how the point of control migrates from session to session, and what that drift says about whether the auction is building value higher, lower, or going nowhere at all.