Market Profile vs Volume Profile
The Market Profile sorts the day's trading by time: one letter per half-hour period, stamped at every price that period touched. The volume profile sorts the same day by size: bars showing how many contracts changed hands at each price. The first records where the market lingered. The second records where the business was done. They do not always point at the same price.

Think of a library read two ways: one count of how long chairs were occupied on each floor, another of how many books were checked out on each floor. The first measures lingering, the second measures activity, and the busiest chair is not always in the busiest aisle. The volume profile block you just finished owned the size side of this split in full. This lesson opens the Market Profile block with the original tool, and the rest of the level builds on it.
What the Market Profile Records
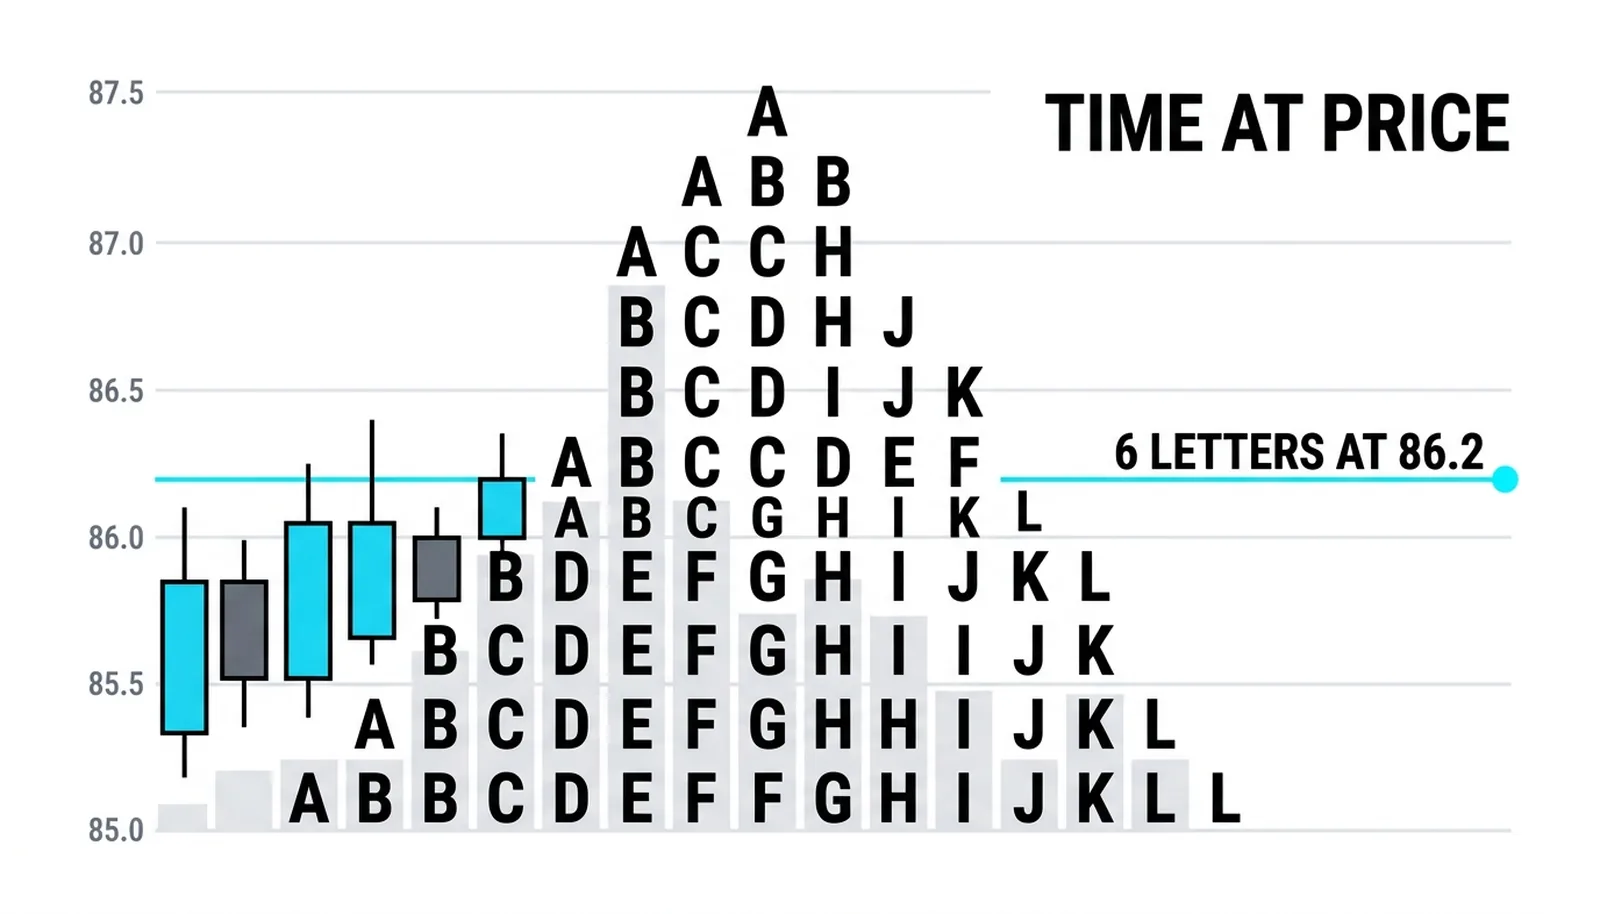
The Market Profile divides the session into half-hour periods and assigns each one a letter. The first period gets A, the second gets B, and so on. Every price a period trades at gets that period's letter printed beside it. Stack the letters and you get the day's signature shape.
The count that matters is the TPO count. TPO stands for time-price opportunity: each letter is one half-hour's opportunity to trade at that price. A row with eight letters means the market spent four hours accepting that price. A row with one letter means the market passed through and never came back.
This is a tool about time. It answers one question: where did price spend its half-hours? It says nothing directly about how many contracts traded. A row can hold six letters on modest turnover, and the profile will still show it as the day's fattest point.
The origin explains the design. The Market Profile was developed at the Chicago Board of Trade in the early nineteen-eighties. Tick-level volume data did not exist on retail screens back then. Time-stamped prices did. So the tool counted what was available: time at price, as a proxy for acceptance. Decades later the proxy still earns its place, because time at price carries meaning that raw volume does not.
Time implies acceptance. When the market sits at a price for two hours, both sides had repeated chances to walk away and chose to keep dealing there. That is information about agreement, and agreement is what support and resistance are made of.
What the Volume Profile Records
The volume profile ignores the clock. It bins every contract by the price where it traded and draws a horizontal bar for each price level. Long bar, heavy trade. Short bar, thin trade. Nothing else enters the calculation.
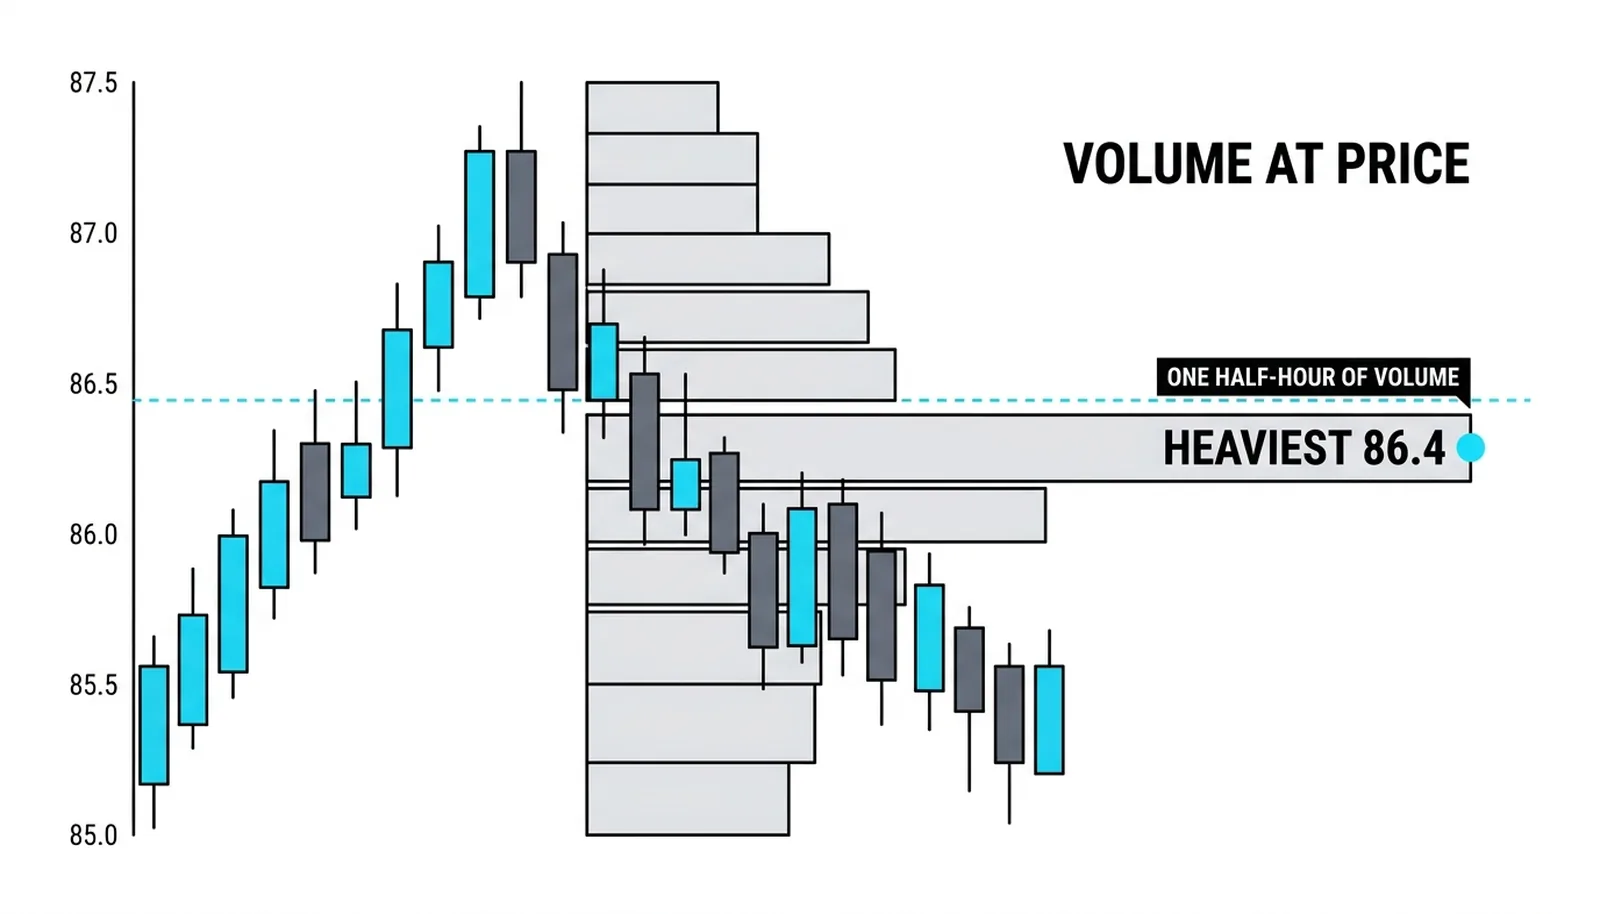
This answers a different question: where did contracts actually change hands? Volume is execution. It is proof that real positions opened and closed at that price, with real money committed. Time can be spent idling. Volume cannot.
That proof cuts both ways. A price with enormous volume is a price where large interests did business, and those interests tend to defend their levels later. A price with heavy time but light volume is a price where the market agreed in principle without committing much in practice. The first kind of level tends to hold harder.
You already know the volume side from the previous block: the histogram, the high-volume nodes, the low-volume gaps. Nothing about it changes here. What changes is that you now have a second, older instrument reading the same session from a different angle.
When They Disagree and Why It Matters
First honesty beat: on most ordinary sessions, the two tools agree. The time bulge and the volume bulge sit in the same rows, because a normal day concentrates both activity and duration near the same prices. Arguing between the two tools on such a day is a waste of attention. Read either one and move on.
Second honesty beat: they disagree exactly when it matters. Each tool has a blind spot the other covers, and the disagreement is the signal.
Consider thin-volume time. A price can hold for an hour on almost nothing traded. The Market Profile stamps two fat letters there and shows acceptance. The volume profile shows a sliver. Which is true? Both. The market accepted the price, but nobody committed size, so the level may be softer than the letter stack suggests. Time alone can fool you here.
Now consider spread-out volume. An open-drive session trends hard from the first bell. Volume spreads thin across many prices because price never sits still. The volume profile shows a long, flat smear with no obvious node. The Market Profile still shows structure: one or two letters per row early, then a cluster where the drive finally stalled. Time alone would have missed the energy of the move; volume alone would have missed where it ended.
The fast rotation is the mirror case. Price whips up and down through the same range in minutes. Letters pile up on every row because each half-hour touched many prices. Volume, though, may be modest. The Market Profile shows a wide, busy day. The volume profile shows a quiet one. A trader reading only letters would overrate the session's conviction.
The practical split follows from all of this. Day-type structure reads cleanest on the Market Profile, because day types are defined by how time distributes across the session. Level placement reads cleanest on the volume profile, because levels are defended by executed size. Most modern platforms show both, and there is no good reason to choose only one.
One Session, Sorted Two Ways
Here is a hypothetical session with round numbers, invented for illustration. A stock trades between 84 and 88 across a full day.
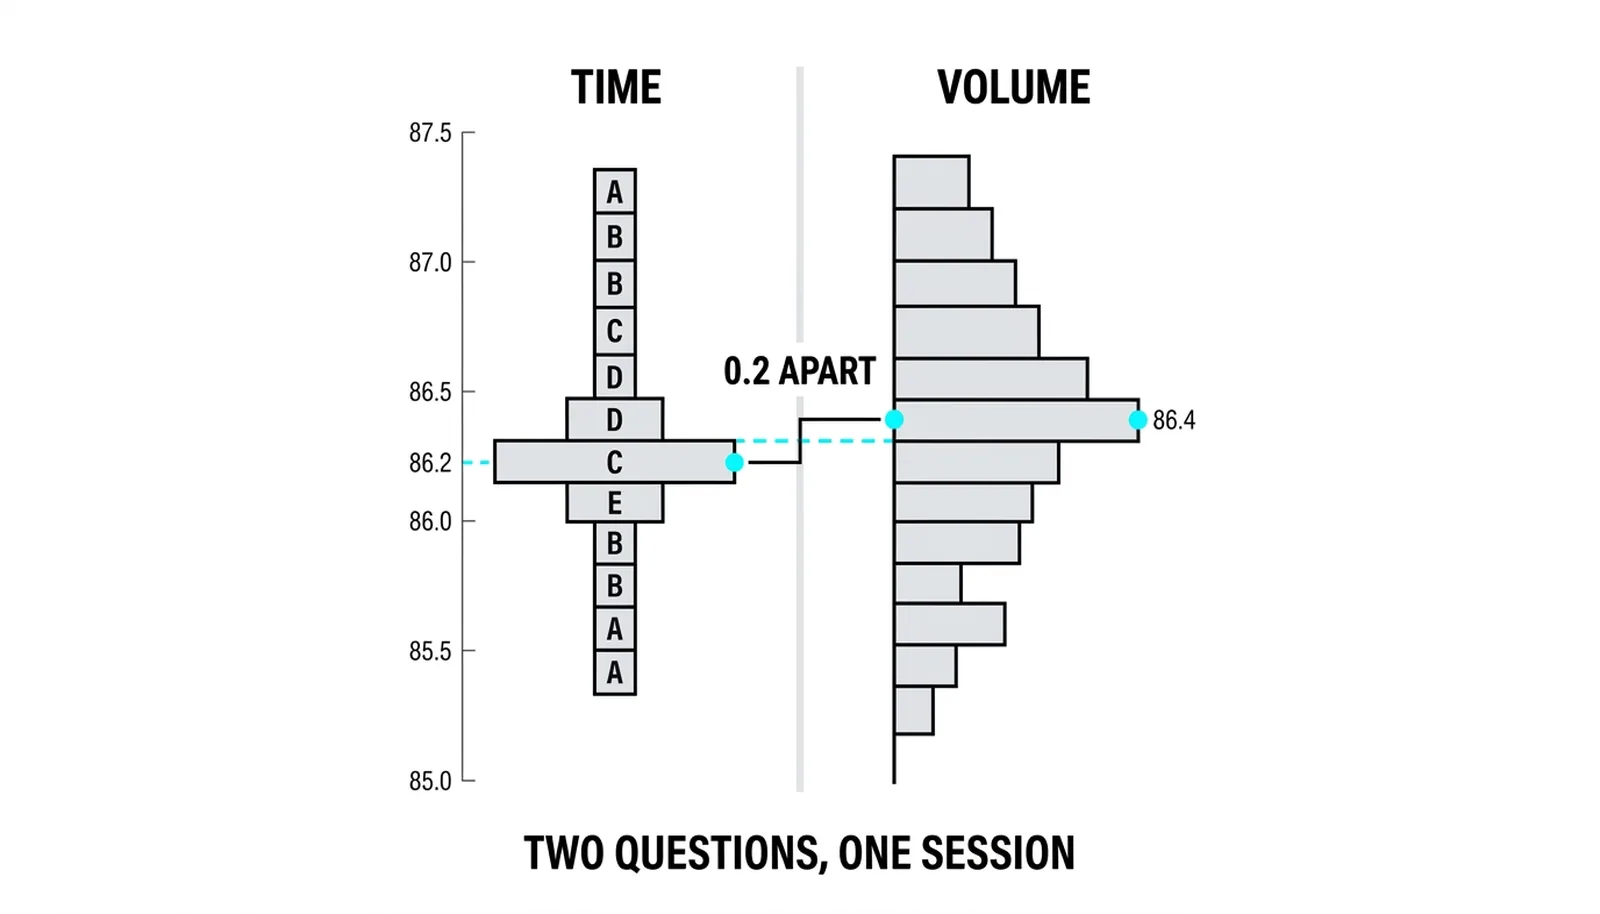
The Market Profile of that session shows its fattest row at 86.2. Six of the day's thirteen half-hour letters stacked there. That is the time bulge: the market spent nearly half its day accepting 86.2.
The volume profile of the same session puts its heaviest bin at 86.4. One violent half-hour of trade crossed more contracts at that price than the rest of the morning combined. That is the volume bulge: a burst of execution, not a long stay.
Read each sort on its own terms. The time bulge at 86.2 says acceptance. The market kept coming back, hour after hour, and both sides dealt willingly. That is a candidate for a level that holds on a quiet retest. The volume bin at 86.4 says a burst. Someone large did business there once, in size, and then the moment passed. That is a candidate for a level that gets defended if those same interests are still in the market.
Now read what each sort missed. The Market Profile treated the violent half-hour as one letter among thirteen, no heavier than a sleepy midday period. It understated the single most important event of the day. The volume profile treated the six hours of patient dealing at 86.2 as a modest bar, because the contracts were spread thin across time. It understated the day's dominant agreement.
A trader placing levels wants both numbers. The time bulge marks where the crowd agreed. The volume bin marks where the money committed. On this hypothetical day those are two different prices, twenty cents apart, and a stop placed by reading only one tool sits blind to the other.
| Question | Market Profile Answer | Volume Profile Answer | Which Tool to Trust |
|---|---|---|---|
| Where did price spend its time? | TPO letter count per row | Does not answer this | Market Profile |
| Where did contracts actually trade? | Does not answer this | Volume histogram bins | Volume profile |
| What kind of day was it? | Letter distribution shows the day type | Smear or bulge gives only hints | Market Profile |
| Where should key levels sit? | Time bulge suggests, can be fooled by thin trade | Executed size proves commitment | Volume profile |
Market Profile vs Volume Profile, Answered
What is the difference between Market Profile and volume profile?
The Market Profile sorts the session by time, stamping one letter per half-hour at each price touched, while the volume profile sorts the same session by size, binning contracts by the price where they traded. One measures where the market lingered, the other measures where business was done.
Which is better, Market Profile or volume profile?
Neither is better in general; each is better at a specific job. Day-type structure reads cleanest on the Market Profile, and level placement reads cleanest on the volume profile. On most ordinary sessions they agree anyway, so the choice only matters on the unusual days.
What does TPO mean in trading?
TPO stands for time-price opportunity: one letter representing one half-hour period trading at one price. The TPO count per row tells you how much time the market accepted that price, which is the Market Profile's core measurement.
Can you use Market Profile and volume profile together?
Yes, and most modern platforms display both on the same chart. Use the Market Profile to read the day's structure and the volume profile to place levels, and pay closest attention on the days when the two disagree, because each tool then covers the other's blind spot.
The next lesson stays inside the Market Profile block and gets mechanical: how the TPO letter chart is actually built, period by period, from the opening print to the close.