Volume Divergence: Price and Volume Split
Volume divergence is the condition where price and volume stop agreeing across swing points: price presses to a new extreme while the volume behind that extreme shrinks swing over swing, and the split is a warning that the move is running on leftover fuel rather than fresh participation. Price makes the claim. Volume grades the claim. When the grades keep getting worse while the claims keep getting bolder, something underneath the move has changed.

Think of it like a fire that has burned low while the room still holds its heat. The warmth you feel is leftover fuel, not new fire. The room can stay warm for a while after the flames shrink, and price can keep rising for a while after participation thins. Neither condition lasts on its own.
The previous lessons in this level taught the effort-versus-result law at the bar and trend level: effort should produce result, and when it does not, pay attention. Volume divergence is that same law measured across swing points instead of single bars. The unit of comparison changes. The logic does not.
One boundary matters before going further. This is not the oscillator divergence family from Level 8. RSI, MACD, and stochastic divergences compare price against a derivative of price. Volume divergence compares price against a second, independent data stream: actual traded participation. An oscillator can only repackage what price already did. Volume reports what other traders actually did. That makes the disagreement between them a different kind of evidence, and often a stronger one.
Bearish Divergence: Higher Highs on Fading Volume
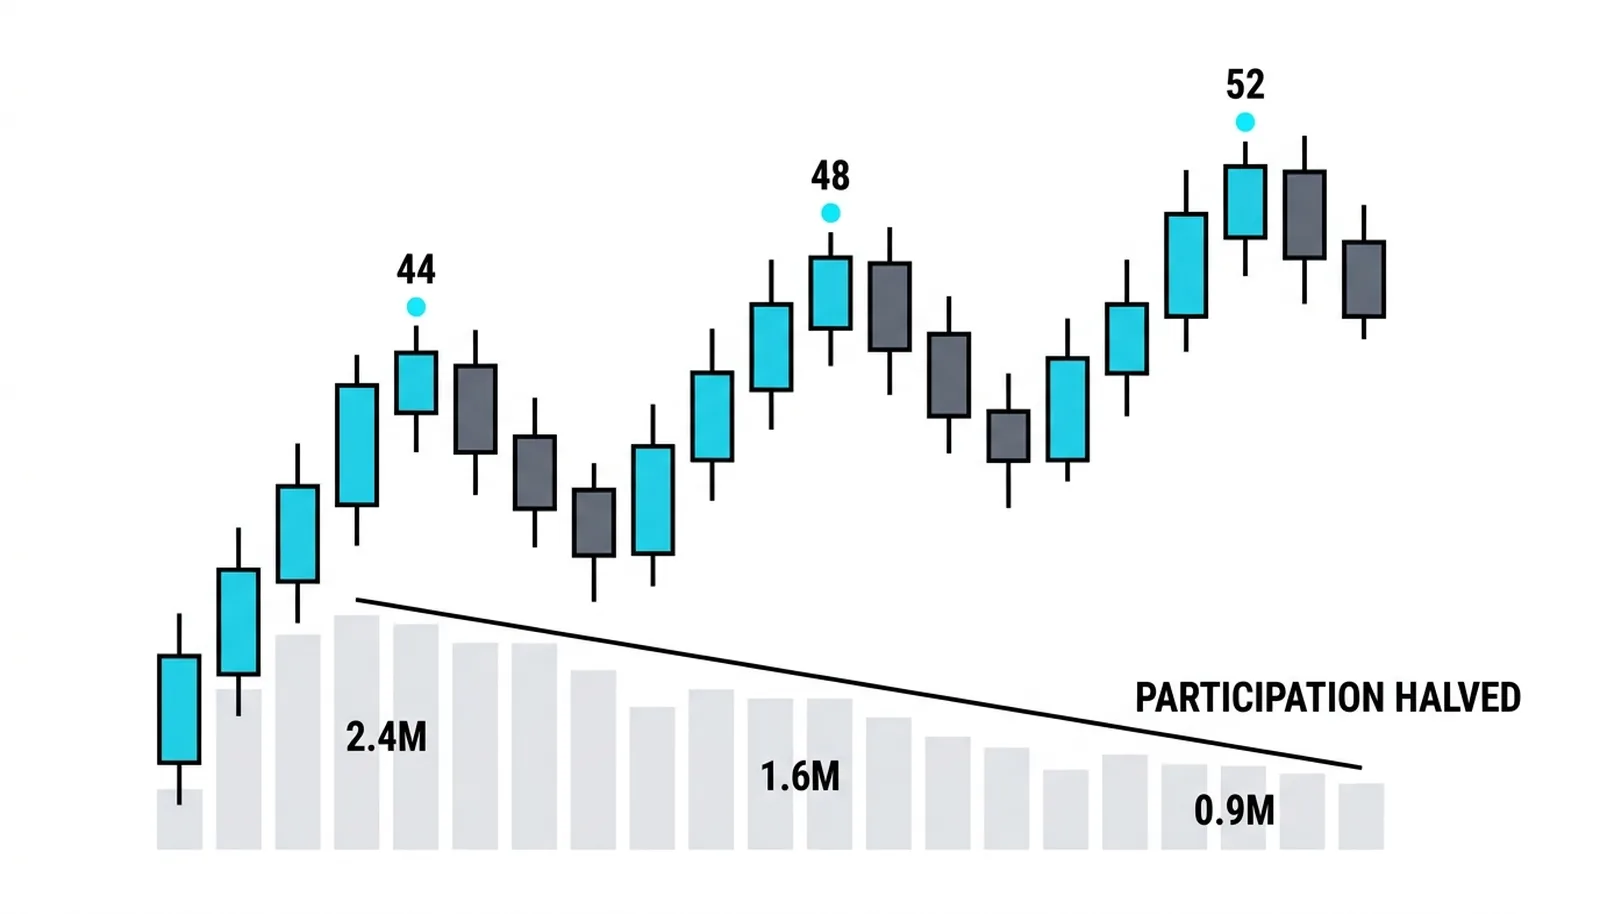
The bearish form shows up in uptrends. Price makes a new swing high, and the volume behind that push is lighter than the volume behind the previous swing high. Then it happens again. Each new high is being bought by fewer participants than the one before it.
Read that plainly: the pool of willing buyers at higher prices is shrinking. The move continues because holders are not selling yet, not because new buyers are arriving in force. Price can drift higher on thin demand far longer than most traders expect, which is exactly why this pattern fools people.
You will see this most often late in established uptrends and as price pushes into old resistance. The early legs of a trend attract fresh money. The late legs run on holders who refuse to sell and a dwindling group of latecomers. When price reaches a level where sellers previously appeared, and it arrives there on the lightest volume of the whole advance, the setup deserves respect.
The check is mechanical. Mark the swing highs. Compare the volume traded across each push. If swing three's high came on clearly less participation than swing two's, and swing two's came on less than swing one's, the divergence is on the chart whether anyone likes it or not.
Bullish Divergence: Lower Lows on Drying Volume
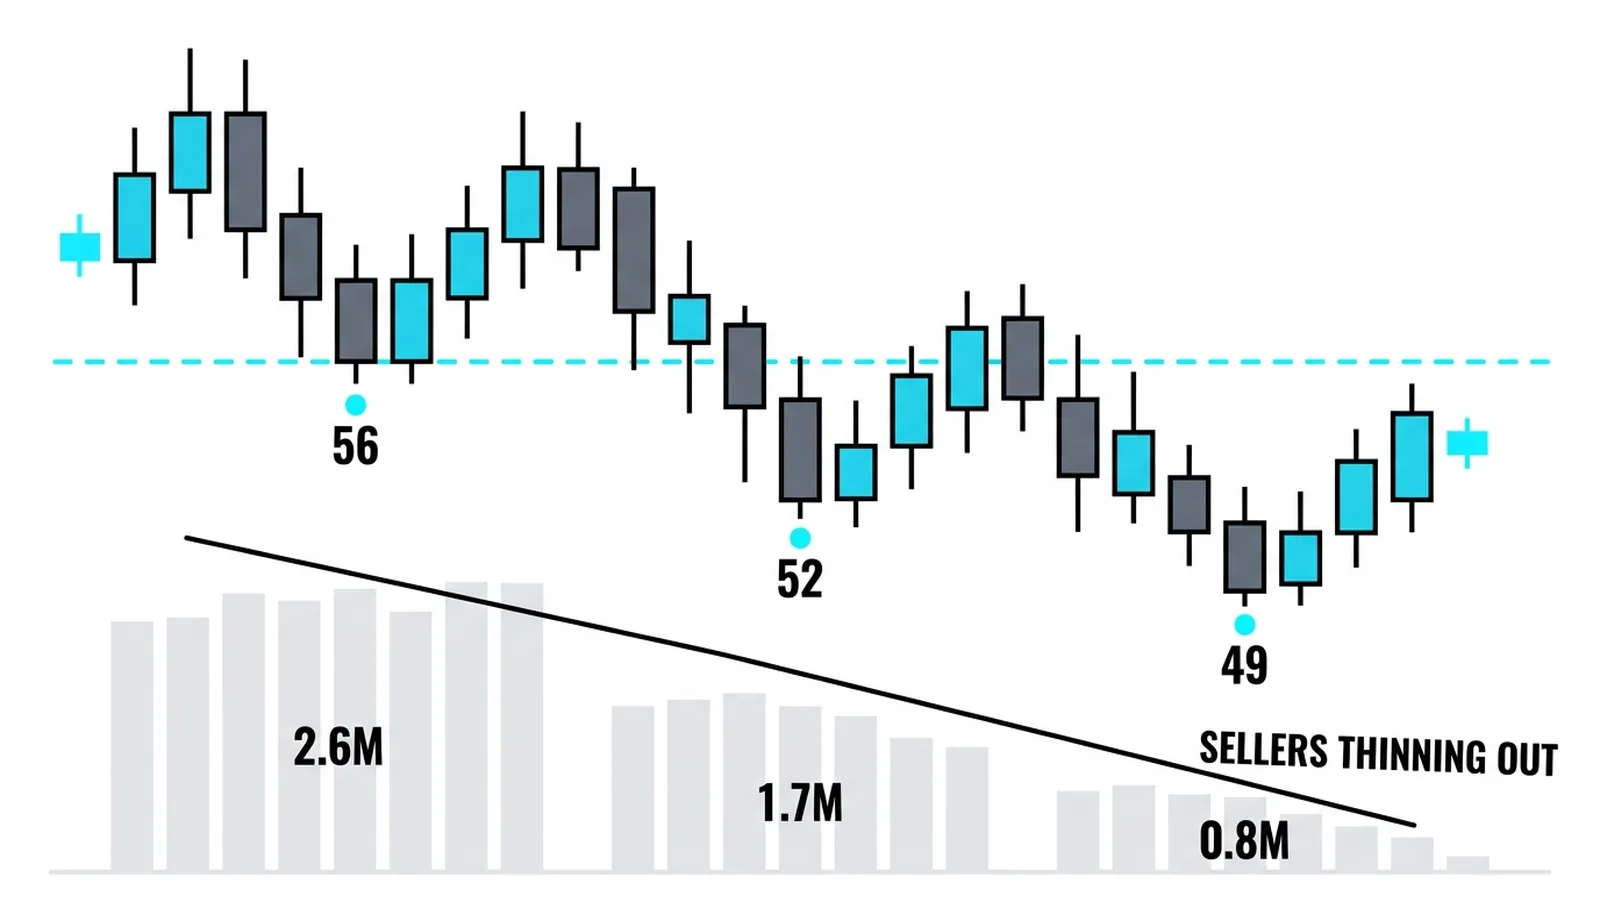
The mirror image appears in downtrends. Price makes a new swing low, but the volume behind the decline is lighter than the volume behind the prior low. Then another new low, on still less volume. Each push down is being sold by fewer participants.
This says the selling pressure is exhausting itself. The traders who wanted out have largely gotten out. What remains is a thinning stream of late sellers and forced exits, and thin supply can be absorbed quickly once any real demand shows up.
The blunt version: the last seller is more important than the last price. A new low means little if almost nobody is left willing to sell at it. Price marks where the final trade happened. Volume tells you how many traders were still in the fight when it happened.
Bullish volume divergence does not mean the bottom is in. It means the downward pressure is losing its fuel source. The turn still needs buyers to actually arrive, and they announce themselves with expanding volume on up-moves, not with hope.
Divergence Is a Warning, Not a Trigger
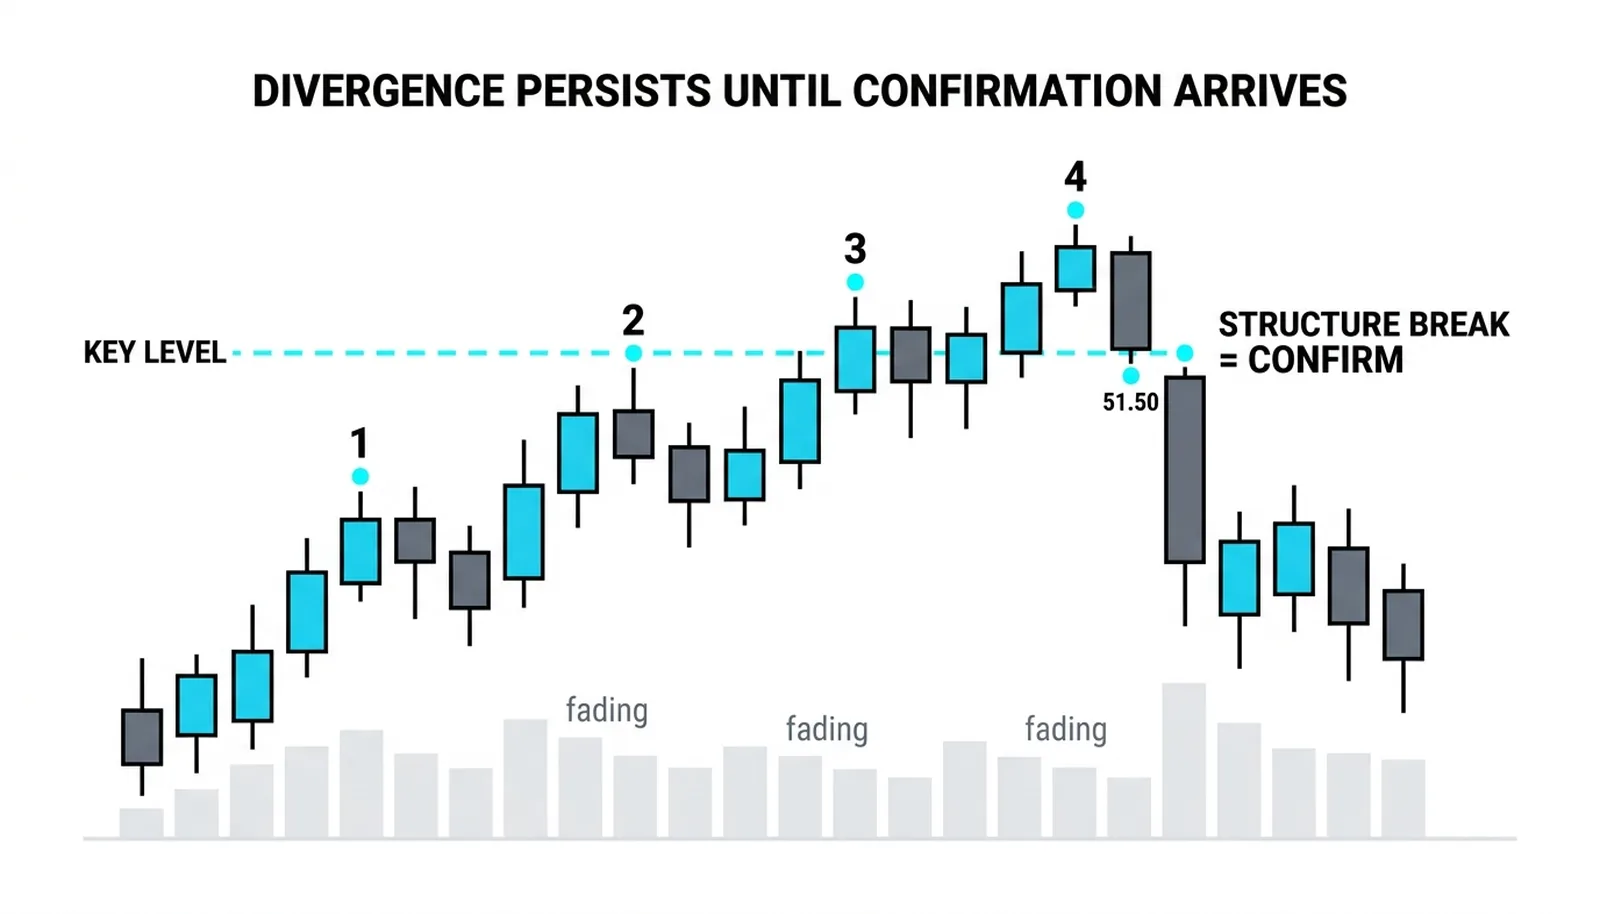
Divergences persist. Sometimes for many swings. A trend can print four or five consecutive highs on shrinking volume and keep going, because a trend does not need new fuel to coast. Traders who short the first divergence they see learn this expensively.
The honest rule: act on the confirmation, not on the split itself. The divergence tells you to change your posture. The confirmation tells you to change your position.
Confirmations worth waiting for:
- A climax bar. A sudden burst of very heavy volume after a long run of fading volume often marks the final flush of the remaining participants, buyers or sellers alike.
- A structure break. Price takes out the prior swing low in an uptrend, or the prior swing high in a downtrend. The divergence said the move was weakening; the break proves the structure has actually given way.
- A test that holds. Price returns to a broken level and fails to reclaim it. The old support acts as resistance, or the old resistance acts as support, and the divergence has done its job.
Any one of these converts the warning into something actionable. Without one, the divergence is context, and context alone is not a trade.
How to Measure It Without Overfitting
Compare swing volume to swing volume on the same feed, same instrument, same session type. Mixing data sources or comparing a holiday session against a normal one manufactures divergences that do not exist.
Use two or three swings as the minimum. One quiet push against one active push is noise more often than signal. A single quiet bar is not divergence at all; divergence is a swing-level pattern, and it needs swing-level evidence.
Keep the judgment coarse. You are looking for an obvious, visible step-down in participation across swings, not a two percent difference measured with a ruler. If you need precision to see it, it is probably not there.
Know what kills the call. A new swing on expanding volume invalidates the divergence. Fresh participation arriving at a new extreme means the fuel tank refilled, and the warning is off until the pattern rebuilds.
Three Highs, Three Verdicts
Here is a hypothetical illustration with round numbers. A stock climbs from 40 to 52 across three distinct up-legs, and each leg trades on roughly 40 percent less daily volume than the one before it.
| Swing | Price High | Daily Volume | Verdict |
|---|---|---|---|
| Leg one | 44 | 2.4 million shares | Healthy participation, trend well supported |
| Leg two | 48 | 1.6 million shares | New high on thinner demand, first caution |
| Leg three | 52 | 0.9 million shares | Divergence confirmed, move running on leftovers |
Price gained twelve points while participation fell by more than half. Every new high was bought by a smaller crowd than the one before.
The honest reading of that table is not "short it." It is a stop-trusting signal. The trader holding a long from lower down tightens stops, stops adding to the position, and waits. Either a new leg arrives on expanding volume and repairs the split, or price breaks structure and the divergence collects its debt. Both outcomes are tradable. Guessing which one comes first is not.
Volume Divergence, Answered
What is volume divergence in trading?
Volume divergence is the disagreement between price and trading volume measured across swing points. Price makes a new high or low while the volume behind that move shrinks compared to the previous swing, signaling that the move is continuing on declining participation rather than fresh commitment.
How is it different from RSI divergence?
RSI divergence compares price against a derivative of price, so both inputs come from the same source. Volume divergence compares price against an independent data stream, actual traded participation, which makes it evidence from outside the price series rather than a repackaging of it.
What does bullish volume divergence look like?
It looks like a downtrend printing new lows on progressively lighter volume. Each push lower is sold by fewer participants, which tells you selling pressure is exhausting itself even while price keeps making new lows.
Should I trade on a volume divergence alone?
No. A divergence is a warning, never a trigger, and divergences can persist for many swings before price responds. Wait for a confirmation such as a climax bar, a structure break, or a test that holds before acting on it.
Volume behaves differently depending on the environment it sits in, and a divergence read inside a range means something different from the same read inside a trend. The next lesson in this level covers volume in trending versus ranging markets, and it will sharpen every call you make with this one.