RSI Divergence: Bullish and Bearish
RSI divergence is price printing a new extreme that the indicator refuses to confirm. Price makes a higher high while RSI makes a lower high, or price makes a lower low while RSI makes a higher low. The mismatch tells you momentum is fading before the chart shows it.

Think of a runner still edging forward while each stride gets shorter. The stop arrives quietly, before anyone calls it. That is divergence in one image: movement continues, but the energy behind the movement is shrinking.
The earlier RSI lesson in this level covered construction, the overbought and oversold zones, and the range shift. This one builds straight on it. And the momentum lesson already flagged this exact situation: divergence is momentum refusing to confirm price, the mismatch that lesson warned about.
One honest note before anything else: in strong trends, RSI pins high and apparent divergence is a recurring trap. The regime check from the zones lesson always comes first.
Bearish Divergence: The Rally Losing Breath
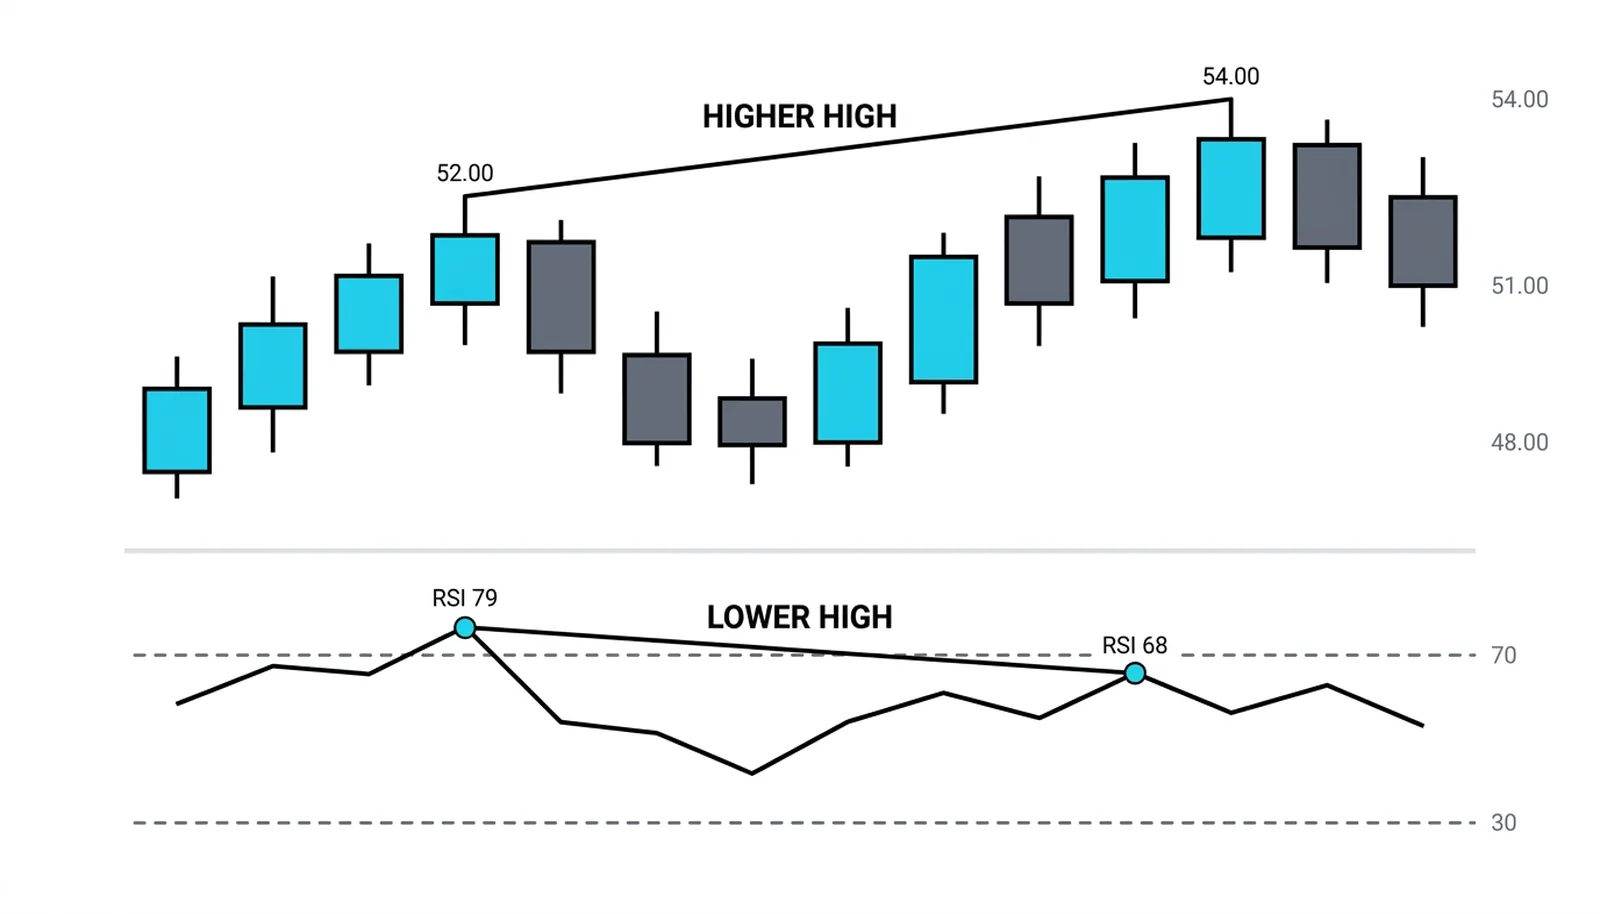
Bearish divergence prints when price makes a higher high but RSI makes a lower high. The chart reaches a new peak. The indicator does not.
Read it as effort versus result. Each push higher adds less than the one before. Buyers are still in control of price, but the force behind each push is smaller.
Price is the vote count. RSI is the energy behind the voters. When the count rises while the energy falls, the rally is running on leftovers.
What it does not tell you is timing. A rally can show bearish divergence for weeks while price grinds higher. The signal says the fuel is thinning, not that the tank is empty.
So the correct response is attention, not action. Tighten your read on structure. Mark the last swing low. Wait for price itself to agree.
Bullish Divergence: The Decline Running Out of Sellers
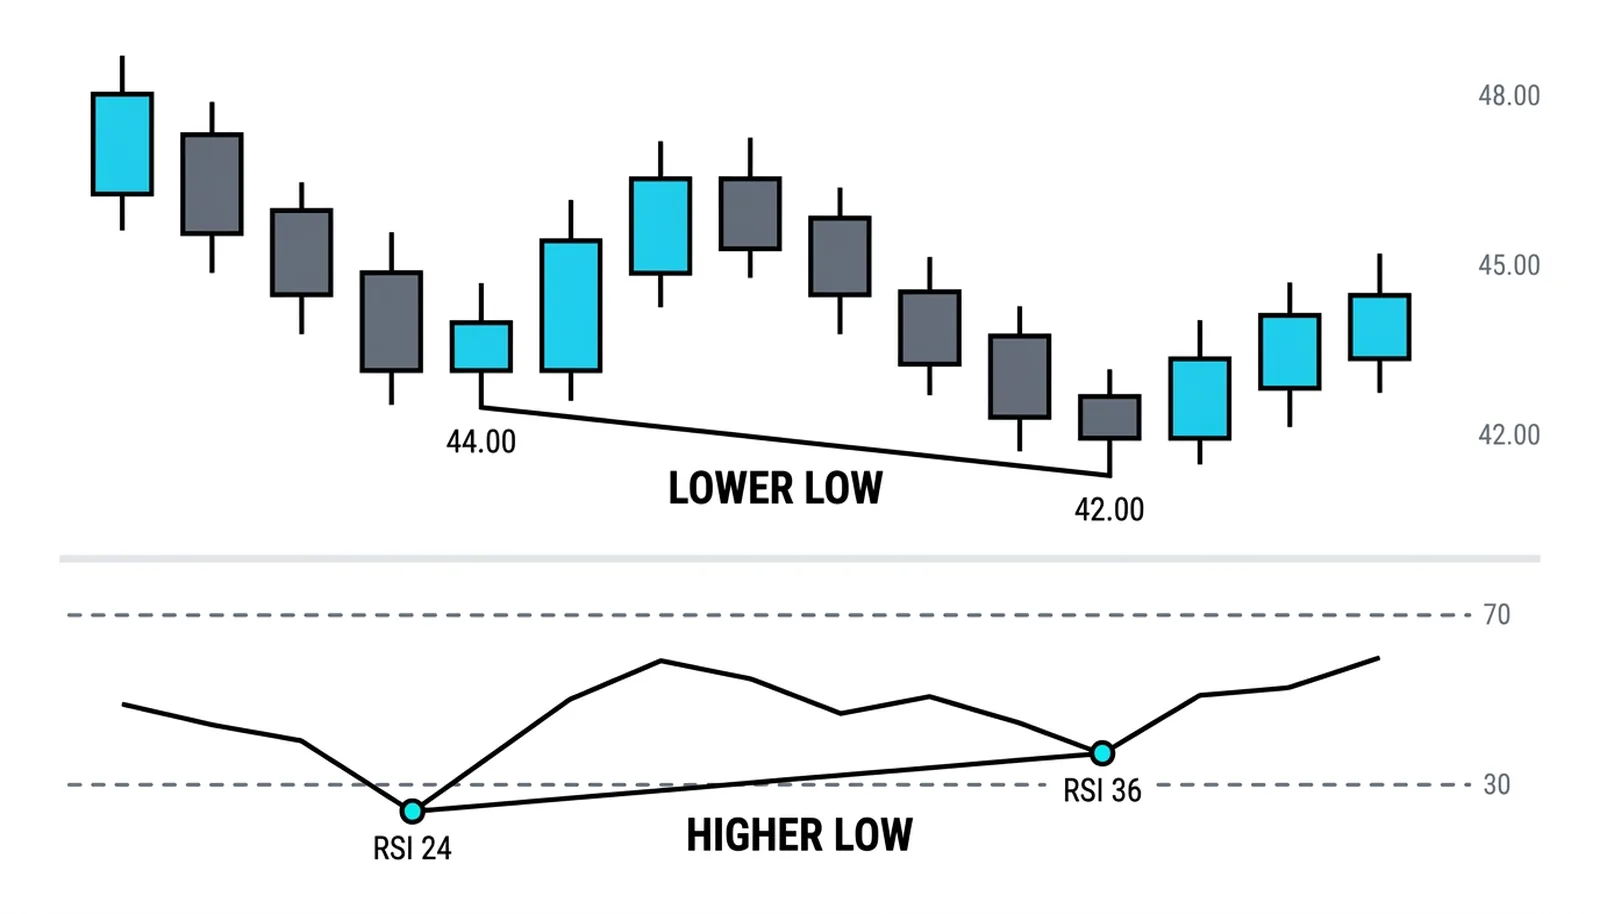
Bullish divergence is the mirror image. Price makes a lower low while RSI makes a higher low.
Sellers still press price to new lows. But each push does less damage than the one before. The indicator registers the weakening even while the chart still looks heavy.
This is often the harder of the two to trust emotionally. A falling chart with a rising RSI feels wrong. That discomfort is exactly why many traders skip it, and why the ones who wait for confirmation get paid for patience.
Same rule applies as on the bearish side. The divergence is a warning that selling pressure is fading. It is not a buy order. Price must confirm through structure before the idea becomes a trade.
Why Divergence Fails in Strong Trends
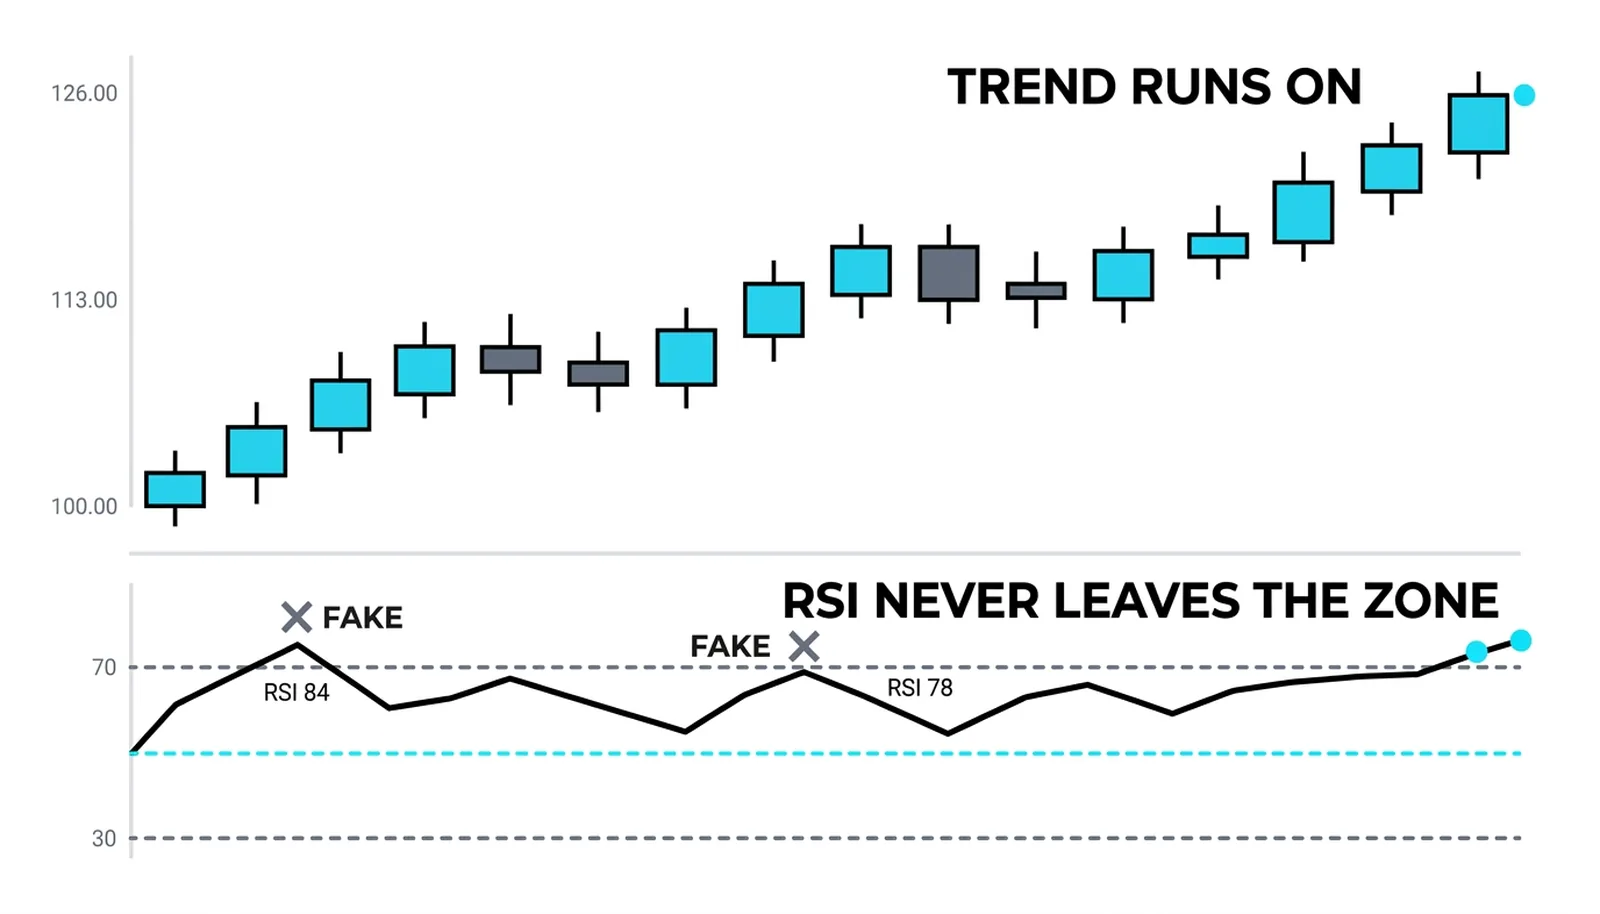
Strong trends saturate RSI. In a powerful uptrend, the indicator can sit above 70 for days or weeks while price keeps running. Every new high produces a slightly lower RSI reading, and every one of those looks like bearish divergence.
Most of them are noise. A lower high in RSI is trend-normal behavior as long as the indicator holds above the 40 floor. The oscillator cools off between pushes without the trend ever breaking.
This is where traders get hurt. They short a strong trend three separate times because RSI "diverged," and the trend runs over them three separate times.
The fix is sequencing. Run the regime check before the divergence check. Ask first: is this market trending hard, with RSI pinned in a zone? If yes, discount divergence heavily or ignore it entirely. Divergence earns its keep in ranges and in tiring moves, not in vertical trends.
One blunt sentence: most divergence losses come from skipping the regime check, not from misreading the pattern.
Using It Without Overusing It
Divergence is a warning, not a trigger. Treat it as a reason to pay closer attention, never as a reason to enter on its own.
Wait for price to confirm. That usually means one of two things: a break of structure, like the last swing low giving way after a bearish divergence, or a close through a level that mattered. Once price agrees with the indicator, the idea has teeth.
- Spot the divergence and mark it.
- Check the regime: trending hard, or tiring?
- Identify the level or swing that would confirm.
- Act on the confirmation, not on the divergence.
Keep count of how often you act on it. If divergence is showing up in every chart you open, you are forcing it. Real divergence at meaningful swing points is uncommon.
Divergence is also a universal oscillator signal. The same price-versus-indicator mismatch shows up in MACD, Stochastic, and others, and the later mastery lessons in this level generalize the idea across all of them.
Two Highs, Two Stories
All numbers here are invented round figures for illustration.
A stock peaks at 52 with RSI at 79. It pulls back to 48, then rallies to a new high at 54. But on this second push, RSI only reaches 68. Price made a higher high; RSI made a lower high. That is textbook bearish divergence.
The honest play: this is a warning, not a short. The trader marks the pullback low near 48 and watches. Days later, price closes back below 50, breaking the short-term structure. That close is the confirmation. The trade follows the confirmation, and the divergence explains why the second push to 54 felt weak the whole way up.
Now the trap case. A different stock is in a strong run. RSI reads 84 at one high, then 78 at the next higher high. That looks like divergence. But price runs another 15 percent from there, with RSI holding above 60 the entire time. The regime was a powerful trend, the lower RSI high was normal cooling, and anyone who shorted the "divergence" paid for it.
| Pattern | What price does | What RSI does | What it honestly means |
|---|---|---|---|
| Bearish divergence | Higher high | Lower high | Buying force is fading; a warning, not a sell |
| Bullish divergence | Lower low | Higher low | Selling force is fading; a warning, not a buy |
| RSI pinned in a trend | Repeated new extremes | Stays high or low, small dips | Trend-normal saturation; divergence signals are unreliable |
| No divergence | New extreme | Confirming new extreme | Momentum agrees with price; no warning present |
RSI Divergence, Answered
What does bearish RSI divergence mean?
It means price made a higher high while RSI made a lower high, so the momentum behind the rally is shrinking even as price climbs. It warns that the move is weakening, but it does not say when the move will end.
Is RSI divergence a sell signal?
No. It is a warning, not a trigger. The disciplined approach is to wait for price to confirm through a break of structure or a close through a meaningful level before acting.
Why does RSI divergence fail in strong trends?
Because strong trends saturate the indicator. RSI can hold above 70 for extended periods while price keeps rising, producing lower RSI highs that are normal cooling, not real weakness. Run the regime check first and discount divergence in pinned, trending conditions.
Which timeframe is best for RSI divergence?
Higher timeframes tend to produce more reliable divergence because each swing represents more committed buying and selling. Lower timeframes generate more signals and more false ones. Match the timeframe to your holding period, and demand price confirmation regardless.
The natural next step is failure swings, where RSI itself breaks its own structure before price does. That lesson takes the confirmation idea from this one and builds it directly into the indicator.