Continuation or Reversal? Reading the Turn
Continuation and reversal are the two outcomes every trend eventually faces: continuation is a trend pausing and resuming in the same direction, while reversal is a trend ending and flipping the other way. In real time, the difference comes down to structure. Continuation keeps the swing sequence intact. A reversal breaks that sequence and starts building the opposite one.

That sounds clean on paper. On a live chart it rarely feels clean, because every reversal begins life disguised as an ordinary pullback. Your job is not to guess which one you are looking at. Your job is to read the structure and let it tell you.
What Continuation Looks Like
A healthy trend breathes. It pushes, rests, and pushes again. Continuation is what you call the rest when the push resumes in the same direction.
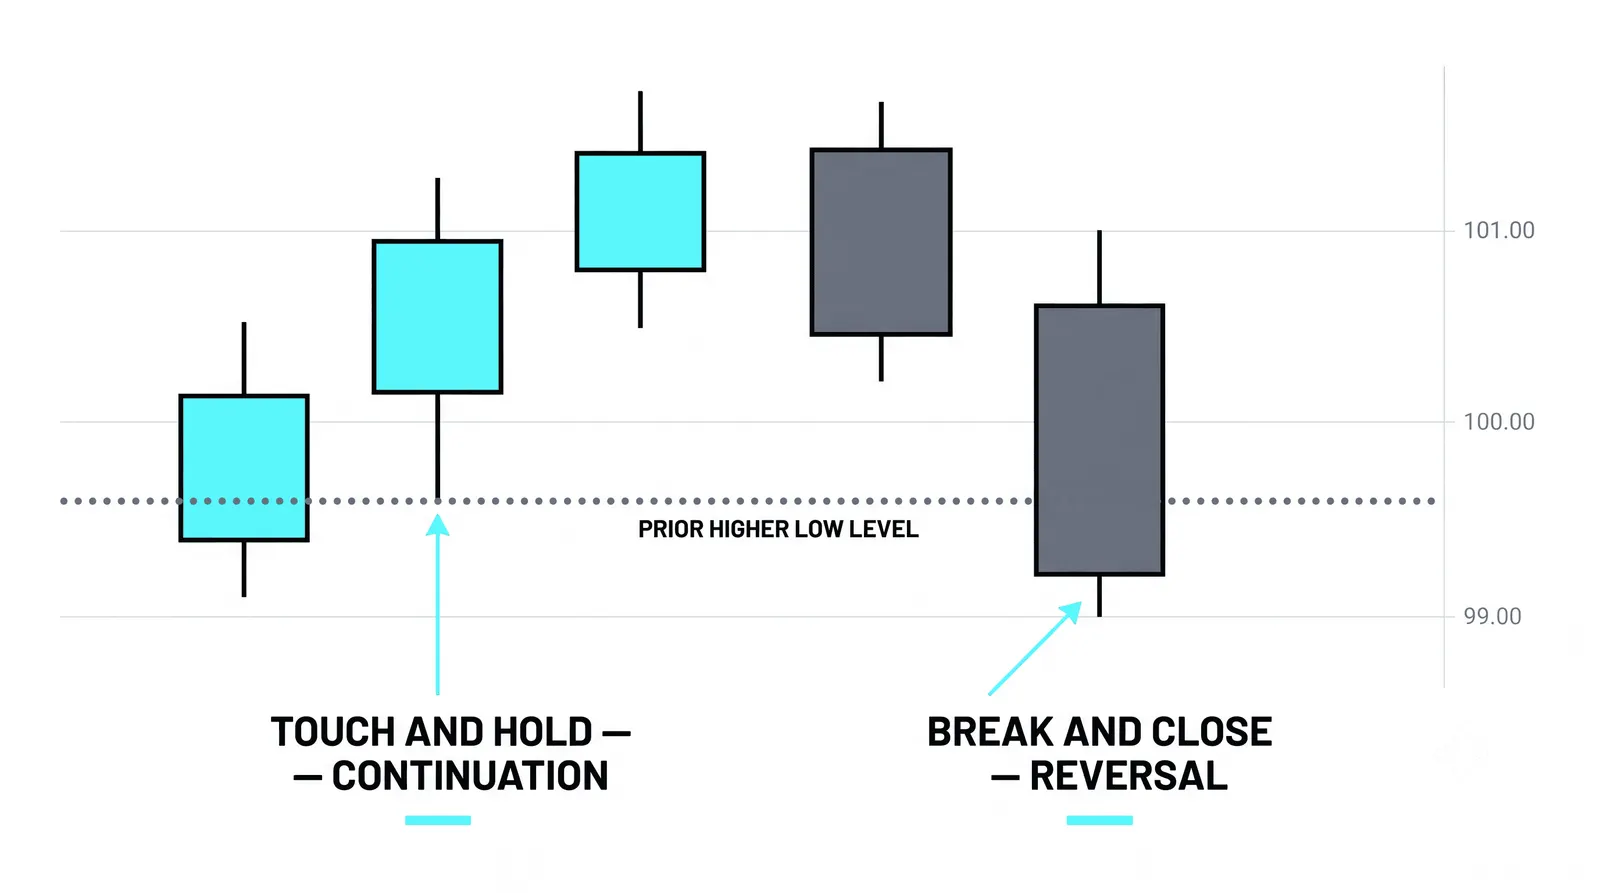
The defining feature is the swing sequence. In an uptrend, price keeps printing higher highs and higher lows. Pullbacks stay shallow and orderly. Sellers show up, but they never take out the prior swing low. The moment a pullback holds above that low and price turns up again, the sequence is confirmed as intact.
Watch the rhythm of the pauses too. As a trend matures, the pauses often shorten. Buyers stop waiting for deep discounts and step in earlier. Flags get tighter, consolidations get shallower, and breakouts come faster. That impatience is a sign of strength, not weakness.
Continuation patterns, like flags, pennants, and tight ranges, resolve in the trend's direction most of the time. They are not magic shapes. They are just the market catching its breath while the underlying order flow stays one-sided.
What Reversal Looks Like
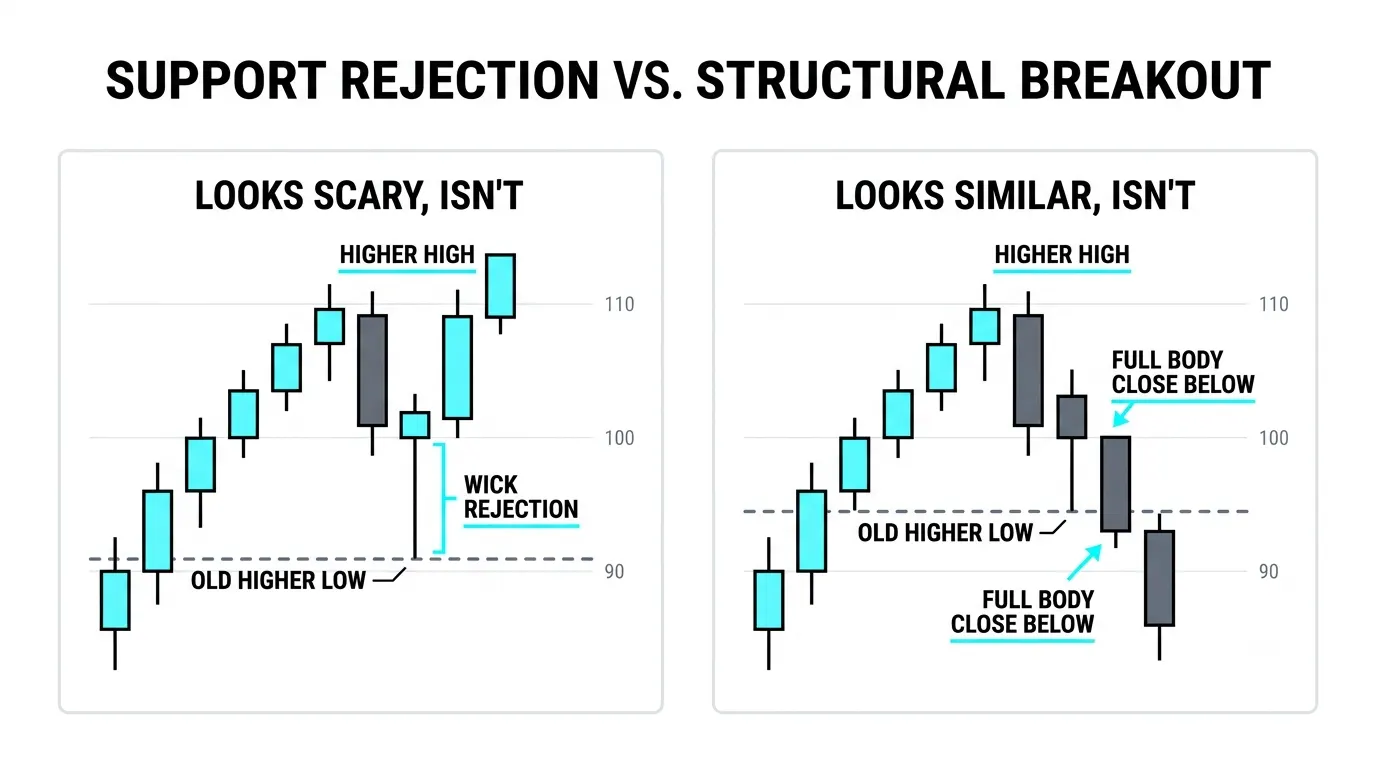
A reversal announces itself through a broken sequence. In an uptrend, the first warning is a higher low that fails. Price drops through the prior swing low instead of holding above it. That single event changes the conversation.
One broken low is not yet a downtrend. The confirmation comes next: price rallies, but the rally stalls below the old high and prints a lower high. Now you have both halves of a new sequence, a lower low and a lower high. The uptrend is no longer the working assumption.
Major levels matter here. When a key support breaks, watch the retest. In a reversal, price comes back up to that broken level and gets rejected. The level that held as support now acts as resistance. That flip is one of the most reliable tells you will get.
Momentum often thins before the structure breaks. Price keeps pushing to marginal new highs, but each push covers less ground and takes longer. Think of it like a rest stop on a road trip: from the passenger seat, a rest stop looks exactly like turning around, and only the direction after the stop tells you which it was.
Why Real Time Is Hard
Every reversal begins as a pullback that looks exactly like the last healthy one. The pullback that held at 108 and the pullback that broke to 105 looked identical for the first half of the move. Nobody rings a bell at the dividing line.
This creates two ways to be wrong. Call the reversal early and you pay for it in repeated small losses, shorting every dip in a trend that keeps resuming. Call it late and you give back open profit waiting for proof while price slides against you.
Both errors come from the same root: trying to be certain before the chart is certain. The honest middle is waiting for the sequence to break. You accept that you will not catch the exact top, and in exchange you stop donating money to every ordinary pullback.
Blunt truth: you will never consistently pick the turning point in advance, and neither will anyone else.
Same Pullback, Two Endings
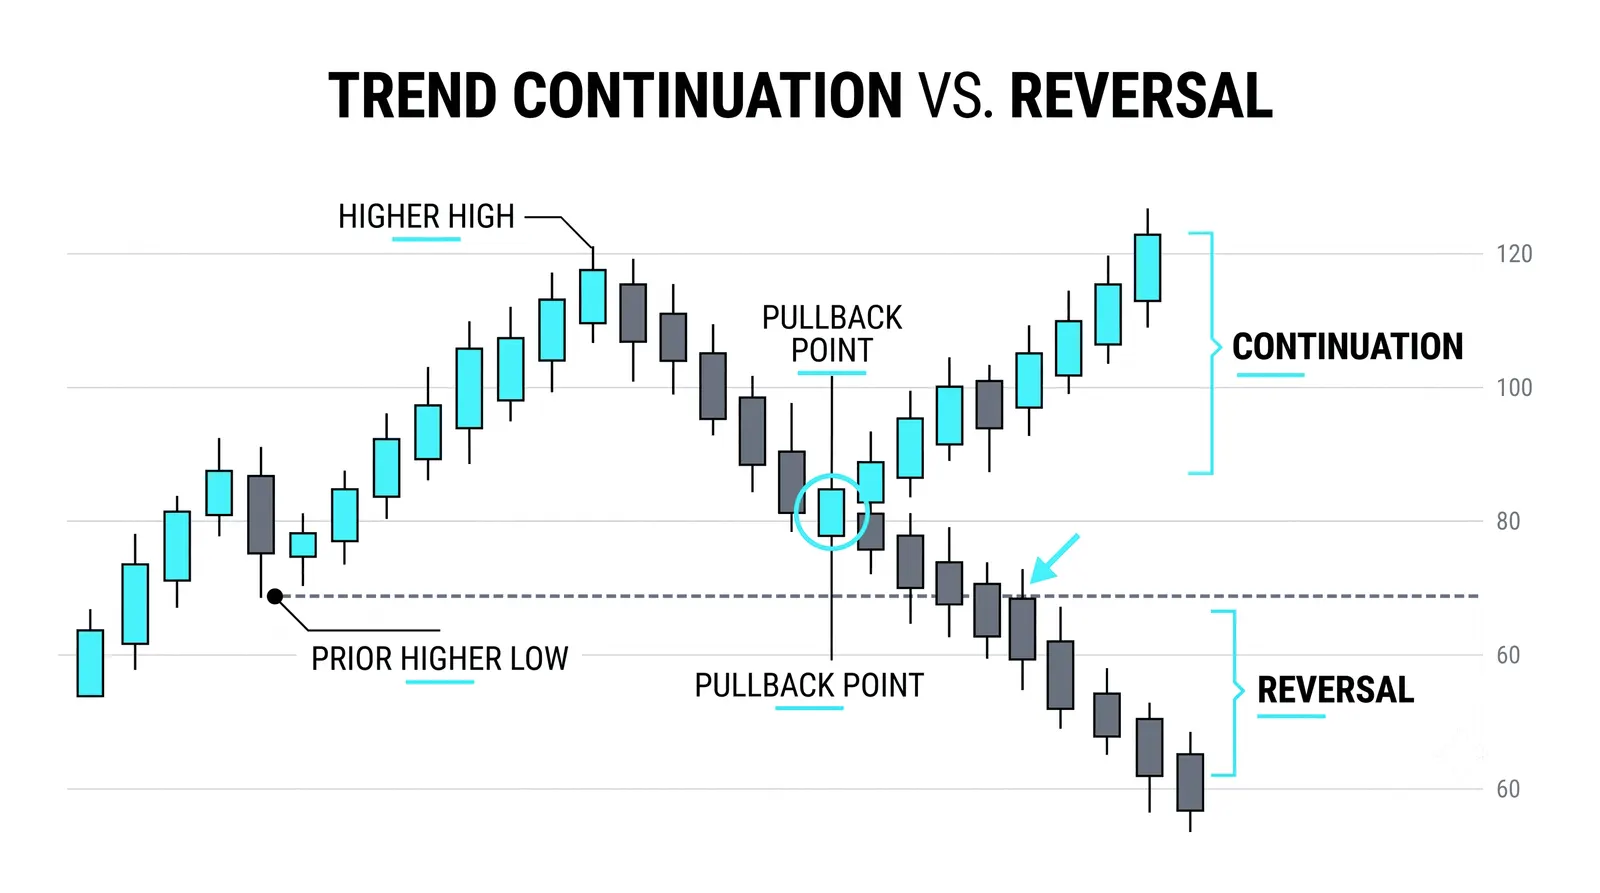
Here is a hypothetical with round numbers. An uptrend runs from 100 to 120. Along the way it left a prior swing low at 108. Price now pulls back from 120. Two charts, same setup, different endings.
Chart A: Price dips to 112. That holds four points above the prior low at 108, well short of a sequence break. Buyers step in, price turns up, and the dip prints a higher low. Price then pushes through 120 and makes a new high. Every element of the sequence survived. The pullback was continuation, and the entry logic was simple: the structure never broke, so the trend remained the default.
Chart B: Price slices straight through 108 and hits 105. The higher-low sequence is now broken. That alone does not confirm a reversal, so you wait. Price rallies, but it only reaches 111 before stalling. That is a lower high. Then price breaks 105. Now you have a lower low and a lower high. The uptrend is finished as the working assumption, and the reversal has structural proof.
Notice what each swing told you. In chart A, the hold above 108 said buyers still controlled the structure. In chart B, the break of 108 was the warning, the weak rally to 111 was the evidence, and the break of 105 was the confirmation. You did not need to predict anything at 120. You only needed to read what each swing did at the levels that mattered.
Probabilities, Not Predictions
Continuation is the statistical default. A trend in motion keeps moving until structure proves otherwise. This is not optimism; it is base rates. Most pullbacks resolve in the trend's direction, which is why fading every dip is a slow way to lose money.
So treat reversal as a claim that needs evidence. Your checklist has three items:
- The sequence. Are highs and lows still progressing in the trend's direction, or has the order broken?
- The depth of the pullback. Shallow and orderly favors continuation. Deep and impulsive raises the question.
- The key level. Does the prior swing low (in an uptrend) hold, and if it breaks, does the retest reject price?
When all three point the same way, you have a read you can act on. When they are mixed, you have a reason to wait. Waiting is a position too.
Continuation vs Reversal at a Glance
| Feature | Continuation | Reversal |
|---|---|---|
| Swing sequence | Higher highs and higher lows stay intact (uptrend) | Sequence breaks, then builds the opposite order |
| Pullback depth | Shallow and orderly, holds above prior swing low | Deep and impulsive, slices through prior swing low |
| Key level behavior | Support holds, price turns up from it | Support breaks and rejects price on the retest |
| Confirmation | New high after the pullback | Lower high followed by a new lower low |
Common Questions About Continuation and Reversal
How deep can a pullback get and still be continuation?
There is no fixed percentage, but the structural line is the prior swing low. As long as price holds above it in an uptrend, continuation is still on the table, even if the dip feels scary. Many traders use the 50% to 61.8% retracement zone as a comfort boundary, but the swing low is the level that actually defines the structure.
What single sign matters most for a reversal?
The break of the prior swing low in an uptrend, or the prior swing high in a downtrend. That is the moment the trend's sequence stops being intact. Everything before that break is noise; everything after it is evidence gathering.
Should I exit on every deep pullback?
No. Exiting on every deep pullback means exiting most trends long before they end, since deep pullbacks that hold are common. A better approach is to define your invalidation level in advance, usually the prior swing low, and exit only if structure breaks it. You will give back some open profit on true reversals, and that is the cost of staying in the big moves.
Do reversals need a pattern like head and shoulders?
No. Named patterns are just common shapes that a sequence break can take. A reversal needs only two things: the old sequence broken and the new sequence started. Sometimes that forms a head and shoulders, sometimes a double top, and sometimes an untidy mess. Read the swings, not the silhouette.
Once you can separate a pause from a turn, the next skill is timing your involvement around those structural levels. That means studying how breakouts and retests behave at the exact swing points where continuation and reversal get decided, which is where trade location stops being theory and starts being practice.