Trendline Breaks and What They Mean
A trendline break is a warning that the market's rhythm has changed, and what it means depends almost entirely on how the break happens. A wick poking through the line and a daily close through it are two different events, and treating them the same is one of the most common mistakes new traders make. This lesson walks through what a break can and cannot tell you, how to read each type, and how to respond without overreacting.

Think of a trendline like a dam with a crack: a seep is not a breach, but every breach starts as a crack worth watching.
What a Break Can and Cannot Tell You
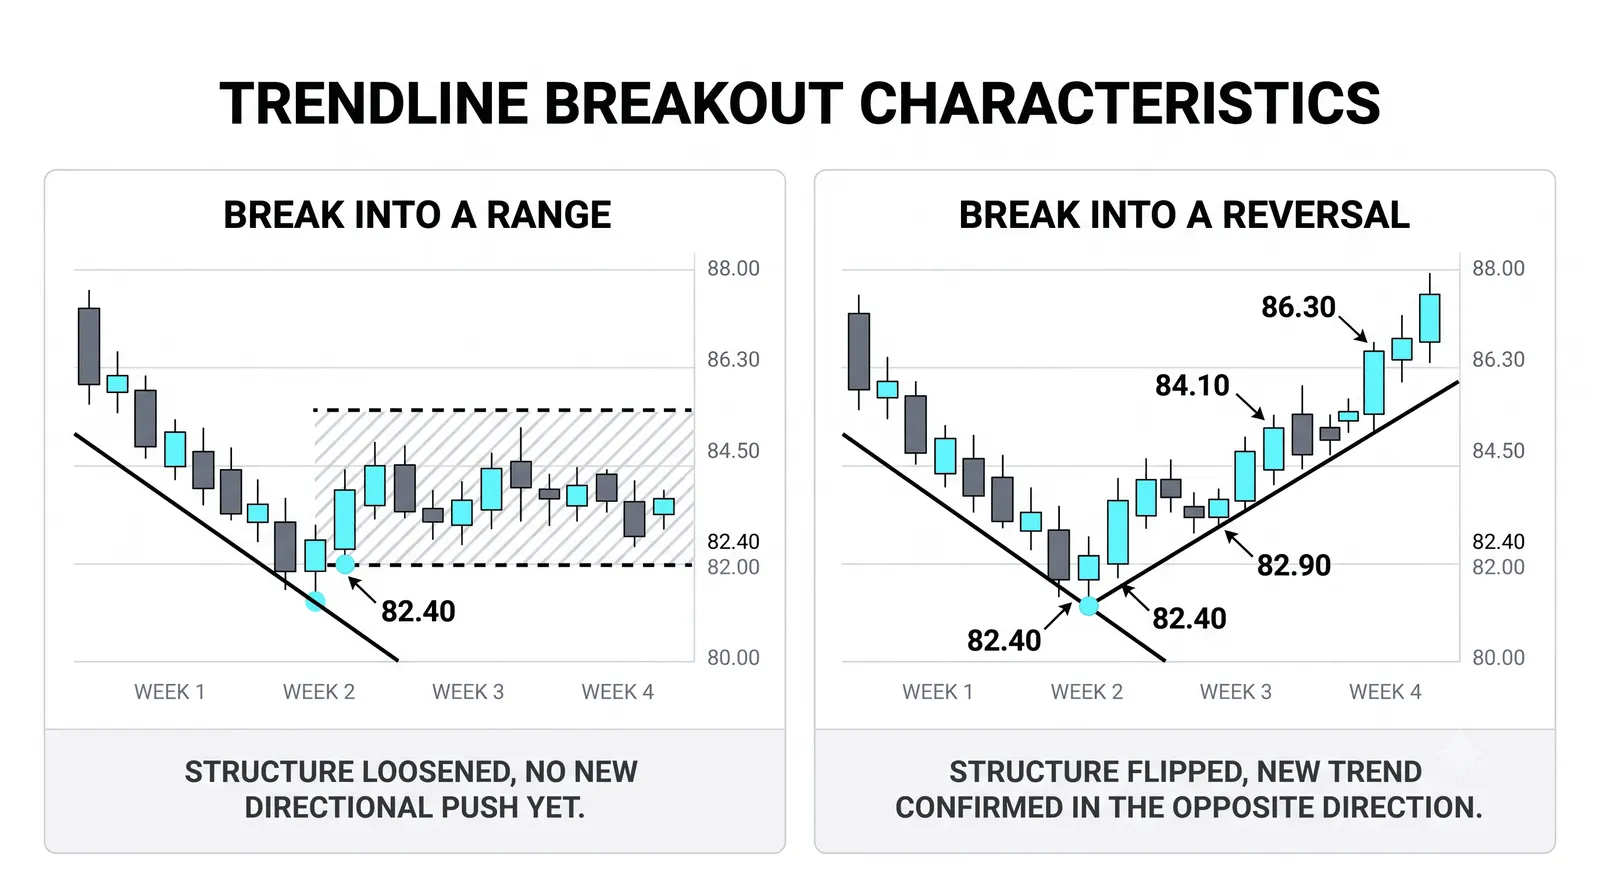
A trendline break tells you one thing clearly: the pace of the trend has changed. The line was drawn along the rhythm of the move, and when price stops respecting it, that rhythm is broken. Buyers are no longer stepping in as early, or sellers are pressing harder than before.
What it cannot tell you is how far price will travel. There is no measured move attached to a trendline break. No projection, no target, no formula. Anyone who promises you a specific destination from a broken line is guessing.
This matters because traders love targets. A break feels like it should come with a number. It does not. The break tells you the old conditions are gone; what replaces them is something you read from structure, support and resistance, and the next swing points, not from the line itself.
One more boundary. A trendline break is not the same as a structure break, where a swing low gets violated. That is a separate event with its own lesson on this site. A line can break while structure stays fully intact, and that combination is common.
The Wick Through the Line
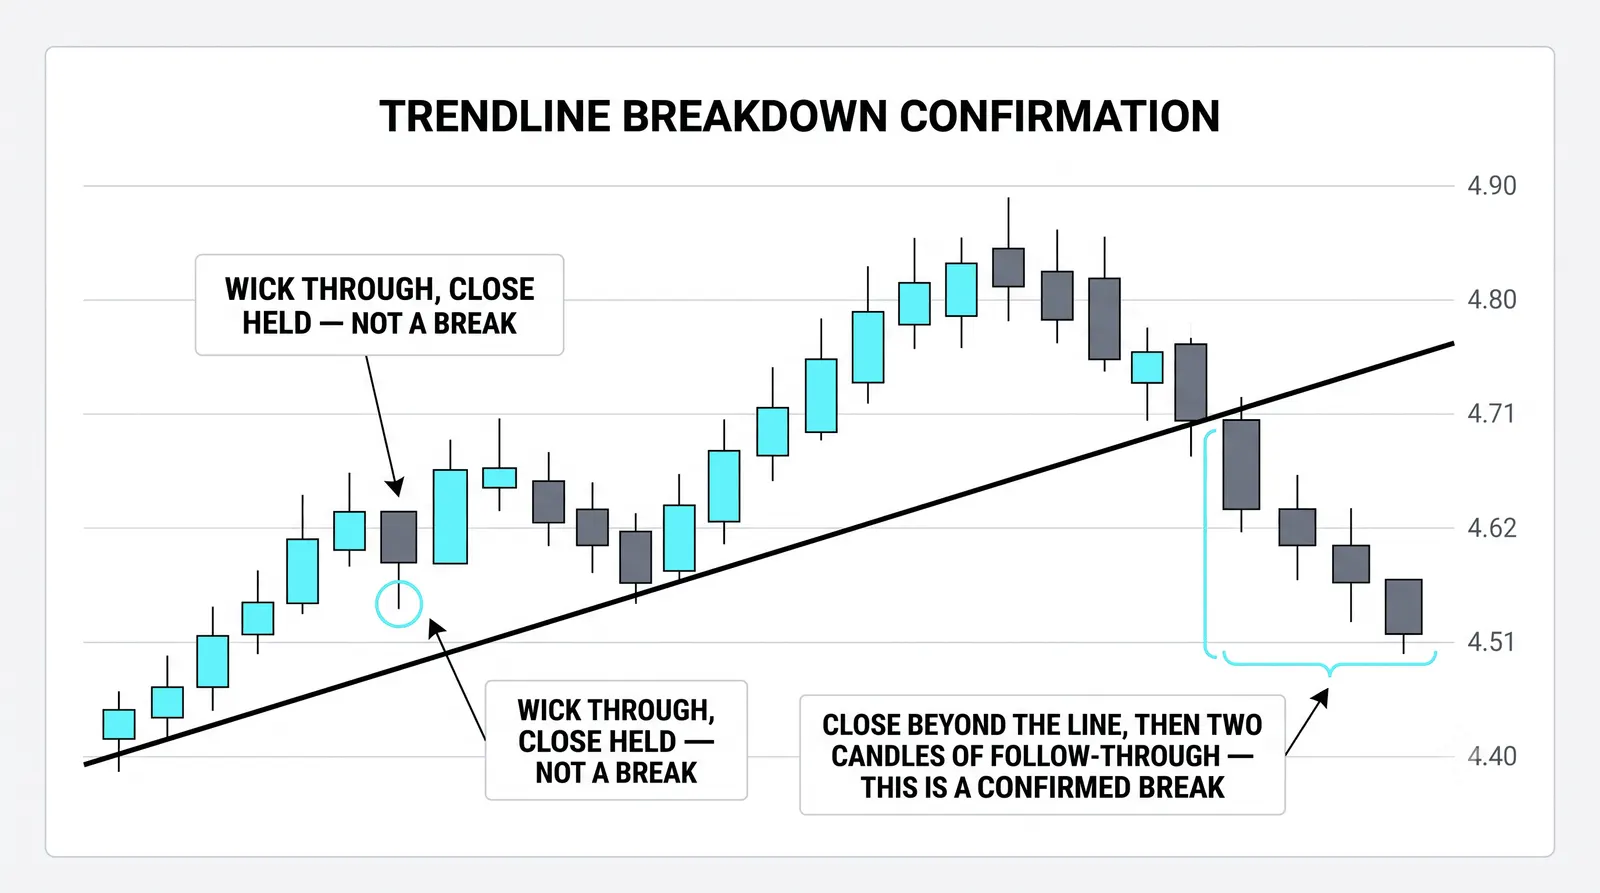
Intraday, price will often poke through a trendline. Sellers push hard, stops get triggered, and the line gets pierced for an hour or two. Then buyers return, and by the close, price is back on the correct side of the line.
That is a test, not a break. In fact, it is often the sharpest test a line survives. The market probed below, found no follow-through, and rejected the lower prices. The close back above the line is evidence the trend's defenders are still active.
Many strong legs begin exactly this way. The wick through the line flushes out weak hands, and the recovery becomes the launch point for the next push higher. If you exited every time a wick touched your line, you would sell at the bottom of these flushes over and over.
The practical rule: intraday penetration is information, not instruction. Watch it. Note it. Wait for the close.
The Close Through the Line
A close beyond the line is a settled decision. The market had all day to recover and chose not to. That carries weight a wick never can.
When this happens, the line has done its job. It described the trend while the trend was alive, and now the trend's rhythm has changed. Retire the line. Do not redraw it to fit the new price action so it still looks intact. Redrawing to avoid admitting a break is how traders talk themselves into holding losing positions.
A close through the line does not mean the trend is dead or that price must collapse. It means the old pace is over. Price might reverse, might go sideways, might resume the trend at a slower slope. Your job after the close is to read what comes next, not to predict it from the line.
The False Break Trap
Sometimes price closes beyond the line and then snaps back within a day or two. The break fails. This is not a reason to distrust closes; it is a signal of its own.
A close below a rising trendline that gets reclaimed quickly often marks exhaustion of the counter-move. Sellers had their shot, pushed price through the line, and could not hold it. That failure tells you the selling was a flush, not a shift.
The failed break is frequently the stronger signal. A trend that survives a genuine close through its line and reclaims it has proven something a quiet trend never has to. Traders who treat every close through the line as a reason to short get run over by these snap-backs. Give a break a day or two to prove itself before treating it as decisive.
Slope Changes Come Before Breaks
Breaks rarely arrive without warning. The early signal is in the slope.
Watch what happens when a trend starts flattening into its line. The rallies get shallower. The pullbacks reach the line faster. Touches of the line get closer together in time. The trend is losing momentum, and the line is catching up to price instead of price bouncing away from it.
This compression is the quiet early warning that precedes most breaks. You will not catch every break in advance, but if you see touches accelerating and the angle flattening, you can tighten your attention before the break happens rather than reacting after.
The Wick and the Close
Here is a hypothetical example with round numbers to make the distinction concrete.
Suppose a rising trendline runs under swing lows at 52, 55, and 58. The trend is healthy, and the line connects those lows cleanly.
One day, price dips hard and prints a low of 57.20. That low pierces the line, which sits near 57.80 at that point. Intraday, the line is broken. But buyers step in, and the day closes at 58.90, comfortably back above the line. That is a test, not a break. The wick probed below, the close rejected it, and the trend continues higher over the following sessions.
Weeks later, the picture changes. Price sells off and closes at 56.40, below the line. The market had the full session to recover and did not. That is a break. The line is retired.
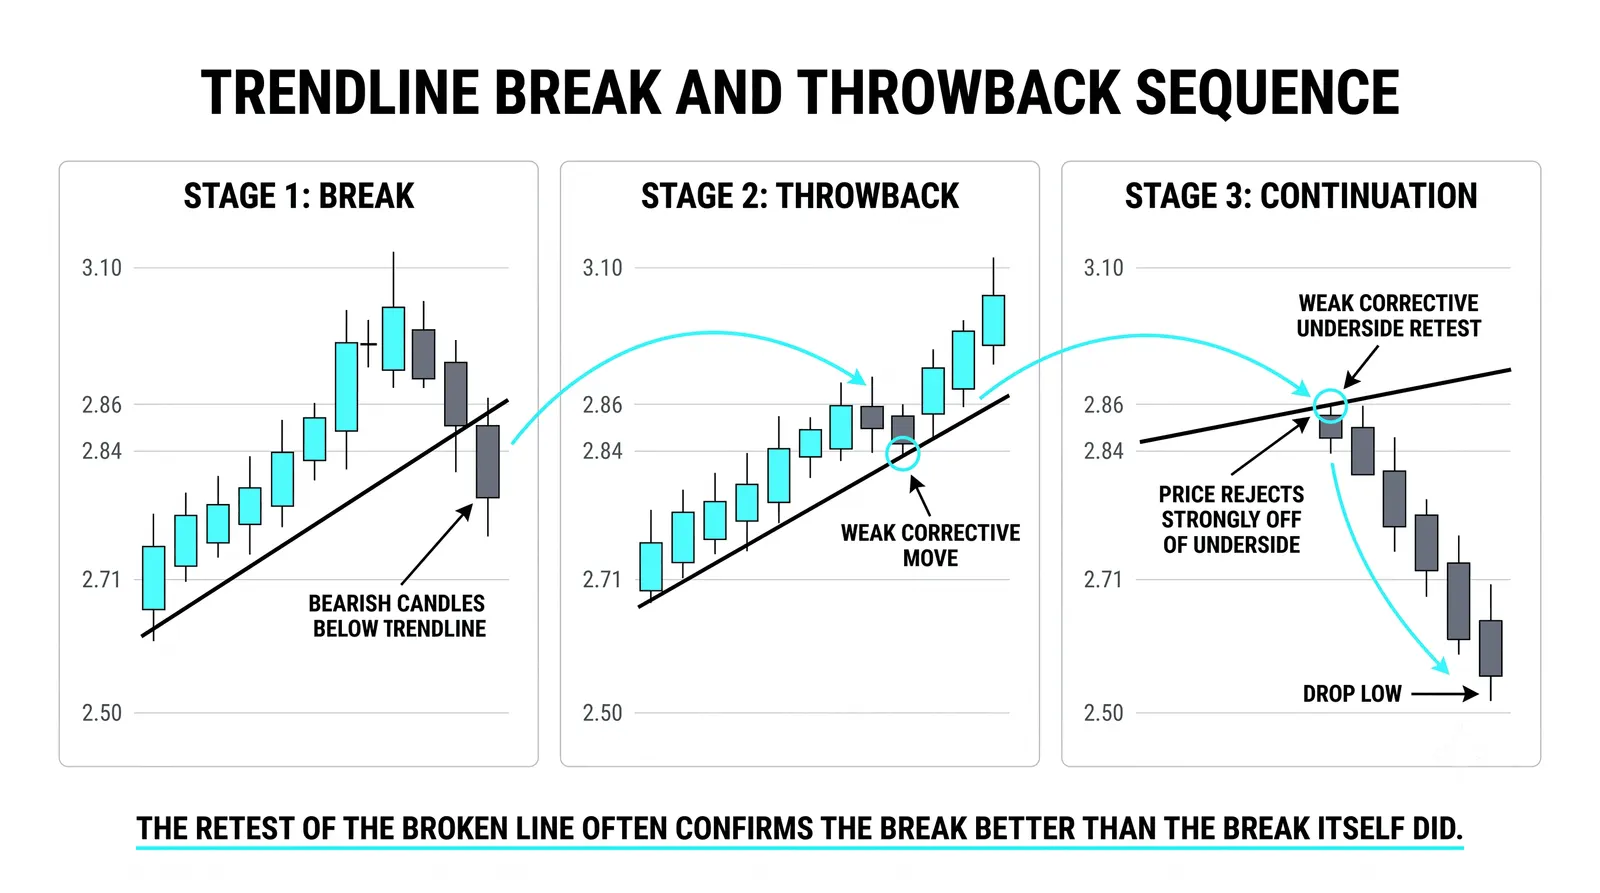
Then comes the confirmation. Price rallies back toward the retired line, stalls near the old swing low at 58, and cannot reclaim it. The level that acted as support now acts as resistance. That retest, with price failing to reclaim the line, confirms the rhythm has genuinely changed. A trader who waited for this sequence, break plus failed retest, has far more evidence than one who reacted to the first close alone.
Notice what the example does not include: a price target. The break at 56.40 said nothing about how far price would fall. The next clues come from structure and prior support, not from the line.
Trendline Breaks, Answered
Does a trendline break give me a price target?
No. A trendline break carries no measured move and no projection. It tells you the trend's pace changed, and nothing about distance. Anyone selling you a target derived from a broken line is guessing.
What if the close beyond the line is tiny?
A marginal close, a few ticks past the line, is a weak signal and deserves patience. Wait for the next session. If price snaps back inside quickly, you are likely looking at a false break. If price holds beyond the line and builds there, the break is real regardless of how small the first close was.
Should I exit my whole position on a break?
Not automatically. A close through the line is a reason to reduce risk, tighten stops, or take partial profits, not a command to flatten everything. Your decision should also weigh structure, the next support, and whether the break shows follow-through. Many traders scale out on the break and exit the rest only if the retest fails.
How is a trendline break different from a structure break?
A trendline break means price crossed a diagonal line drawn along the trend's rhythm. A structure break means price violated an actual swing low, a horizontal level the market created. Structure breaks are generally the heavier signal because they mark a real shift in who controls the swing points. A trendline can break while every swing low remains intact, which is why the two should never be treated as the same event.
Once you can separate wicks from closes and breaks from retests, the next skill is reading what replaces the old trend. That means watching how price behaves at prior swing levels after the line is gone, which is where structure reading takes over.