How to Draw Trendlines Correctly
Trendlines are drawn correctly when you anchor them on two clearly visible swing points that a stranger could find on the same chart, extend them forward, and let the third touch prove whether the line was real. Everything else is decoration. If you need to hunt for your anchor points, the line is not worth drawing.

Think of it like a tailor's chalk line snapped through two pins: the pins decide where the line goes, and the cloth decides whether it fits. Your job is to place good pins. The market's job is to confirm or reject the line. Most beginners get this backwards and spend their energy adjusting the chalk.
Another lesson on this site, Valid vs Invalid Trendlines, already covered how many touches make a line trustworthy. This post is the hands-on part: which points qualify as anchors, whether to use wicks or closes, how steep is too steep, and when to redraw versus leave the line alone.
Choosing the Anchor Points
A trendline is only as significant as the points that define it. Anchor on major swings, the highs and lows that stand out without squinting. If you zoom out and the point still jumps off the chart, it qualifies. If you have to zoom in and argue with yourself, it does not.
The test is simple. Could another trader, given the same chart and no instructions, mark the same two points within a few seconds? If yes, you have real anchors. If no, you have a private line that only you can see, and the market does not respect private lines.
Connecting minor wiggles produces lines that break for no reason. Two small dips inside a larger pullback might line up beautifully, but they carry no weight because few participants acted at those exact prices. When the line breaks, you learn nothing, because the line never meant anything.
Major swings are different. A major low is where sellers genuinely ran out and buyers took over with force. Thousands of decisions happened there. A line through two such points connects two moments of real commitment, which is why the market often reacts when price returns to it.
Wicks or Closes
Wicks mark where extremes reached. Closes mark where the market settled. Both carry information, and they rarely line up perfectly, which is why traders argue about this endlessly.
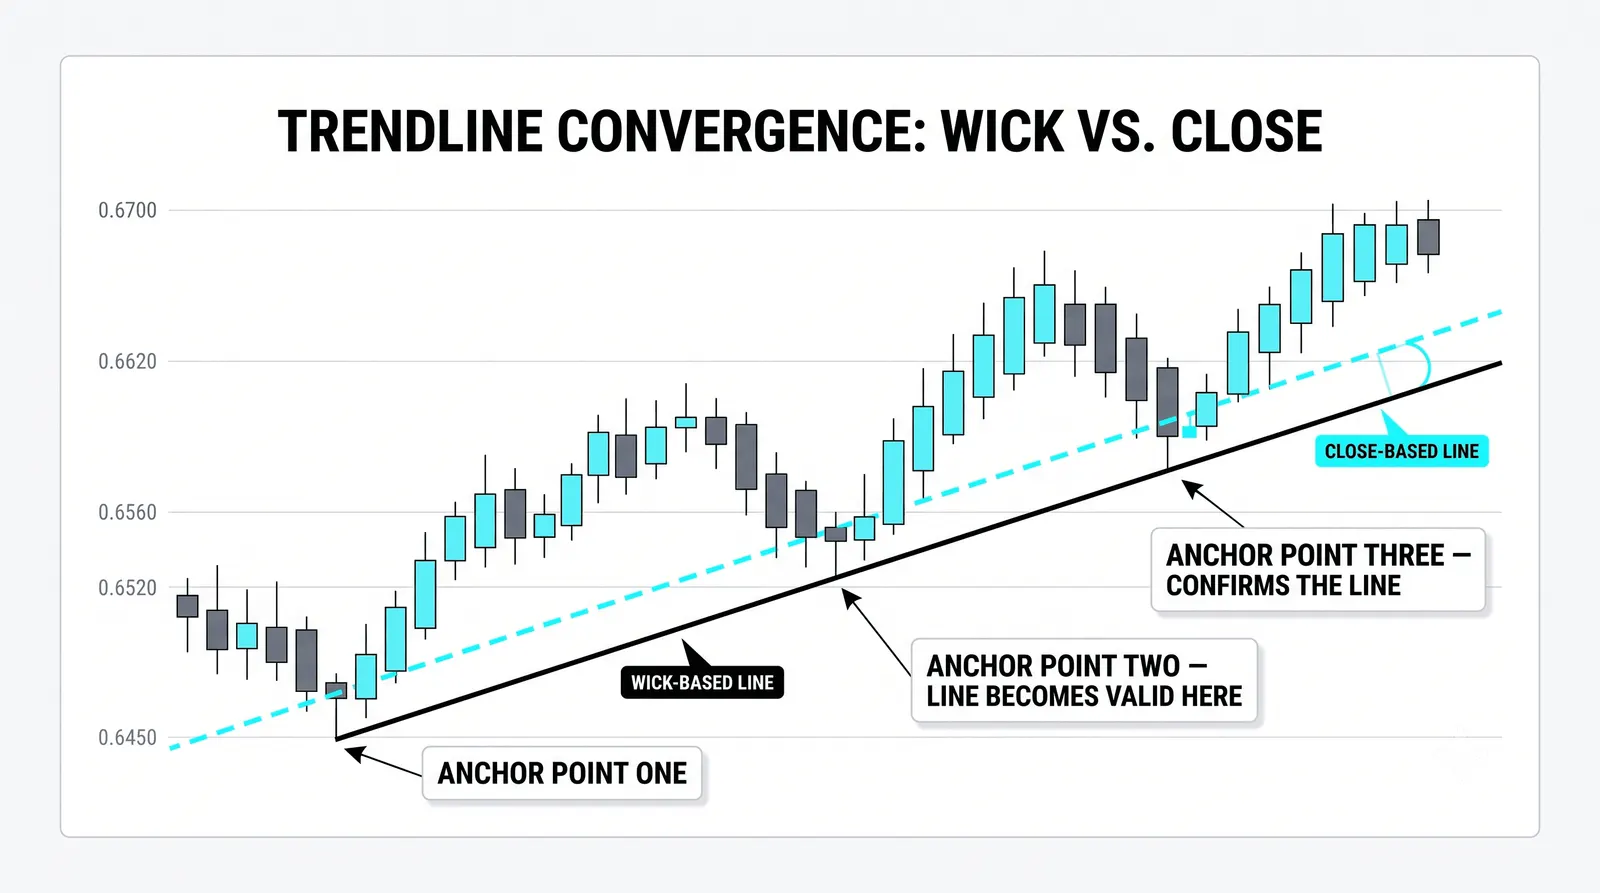
Here is the practical rule. Anchor the line on the clearest extremes, which usually means the wick tips of the major swings. Then judge validity by the closes. A wick poking through the line intraday is noise. A close through the line is the market telling you something changed.
Treat the area between the wick version and the body version as a zone rather than a single pixel-thin barrier. Price is not a laser. On a liquid chart, the difference between the two lines might be a fraction of a percent, and expecting precision finer than that is asking the market to behave more politely than it ever will.
So the workflow looks like this:
- Draw through the wick extremes of the two major swings.
- Note where the body-only version of the line would sit.
- Watch how price behaves inside that band on the next approach.
- Count a break as real only when a candle closes beyond the zone.
The Steepness Problem
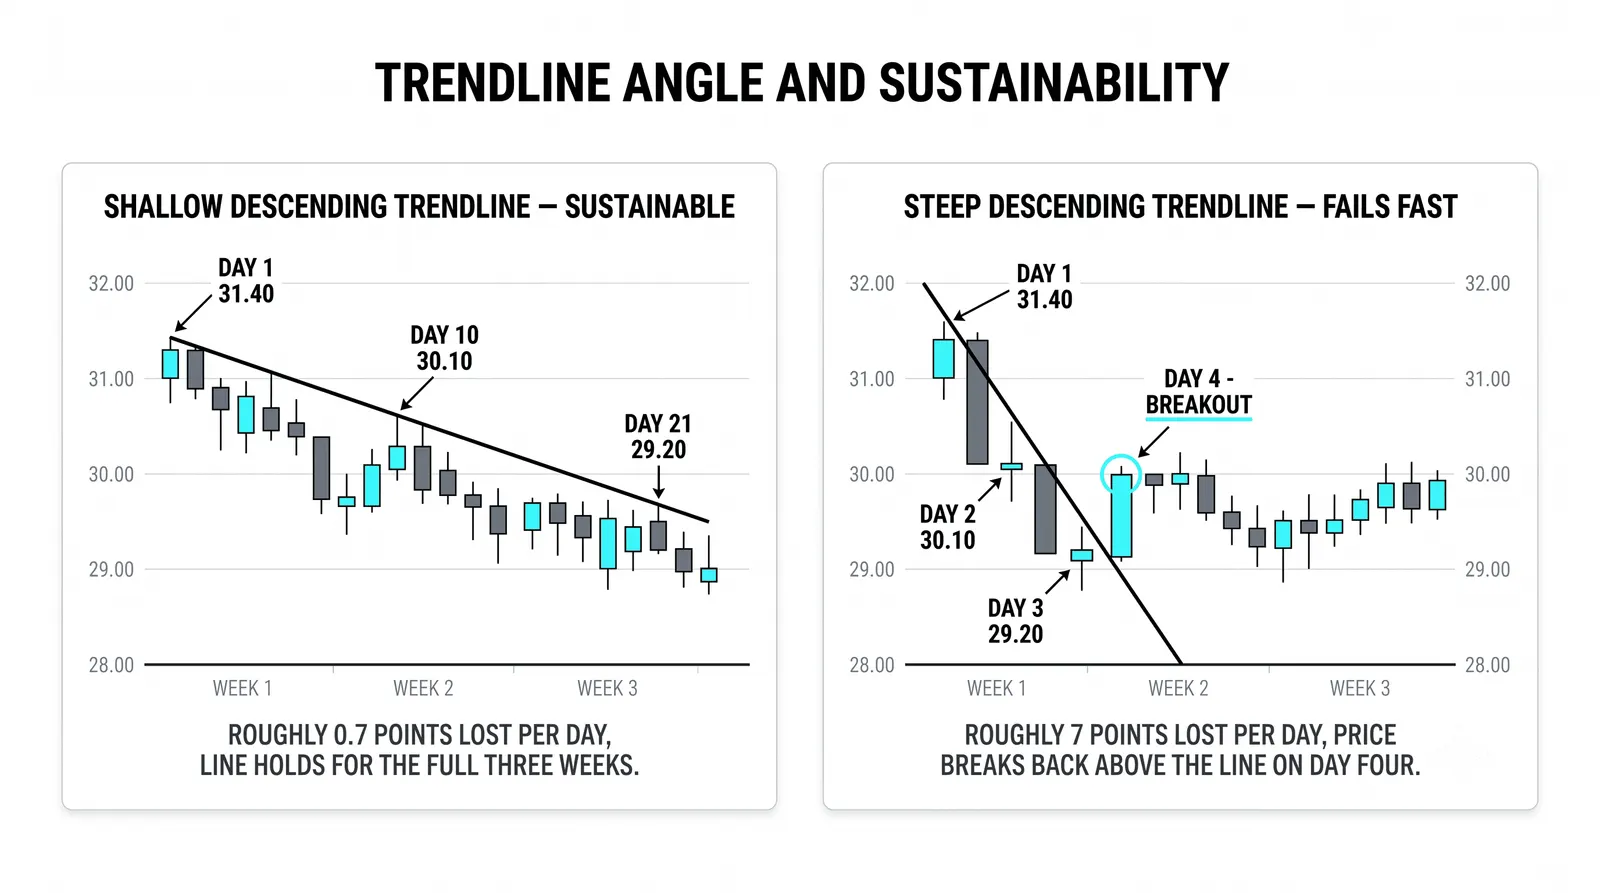
A line so steep that price can only ride above it for a few days will break soon, and the break will mean little. Steep lines describe bursts of emotion, not durable structure. When the excitement cools, price falls through the line even though the larger trend is perfectly healthy.
Watch for this after strong news or a vertical rally. Traders connect the launch point to the first pullback, get a line with a dramatic angle, and then feel betrayed when it breaks a week later. Nothing was betrayed. The line described a sprint, and sprints end.
When the market's rhythm changes, the steep line gets replaced by a flatter one anchored on the newer swings. This is not cheating. The market made a new major point, and the new point carries more current information than the old geometry. A flatter line through well-spaced major swings tends to survive longer and break only when something genuinely shifts.
A useful habit: after drawing any line, ask how long price could realistically stay above it at the current pace. If the honest answer is "a few sessions," expect a redraw in your future and size your confidence accordingly.
Drawing, Erasing, Redrawing
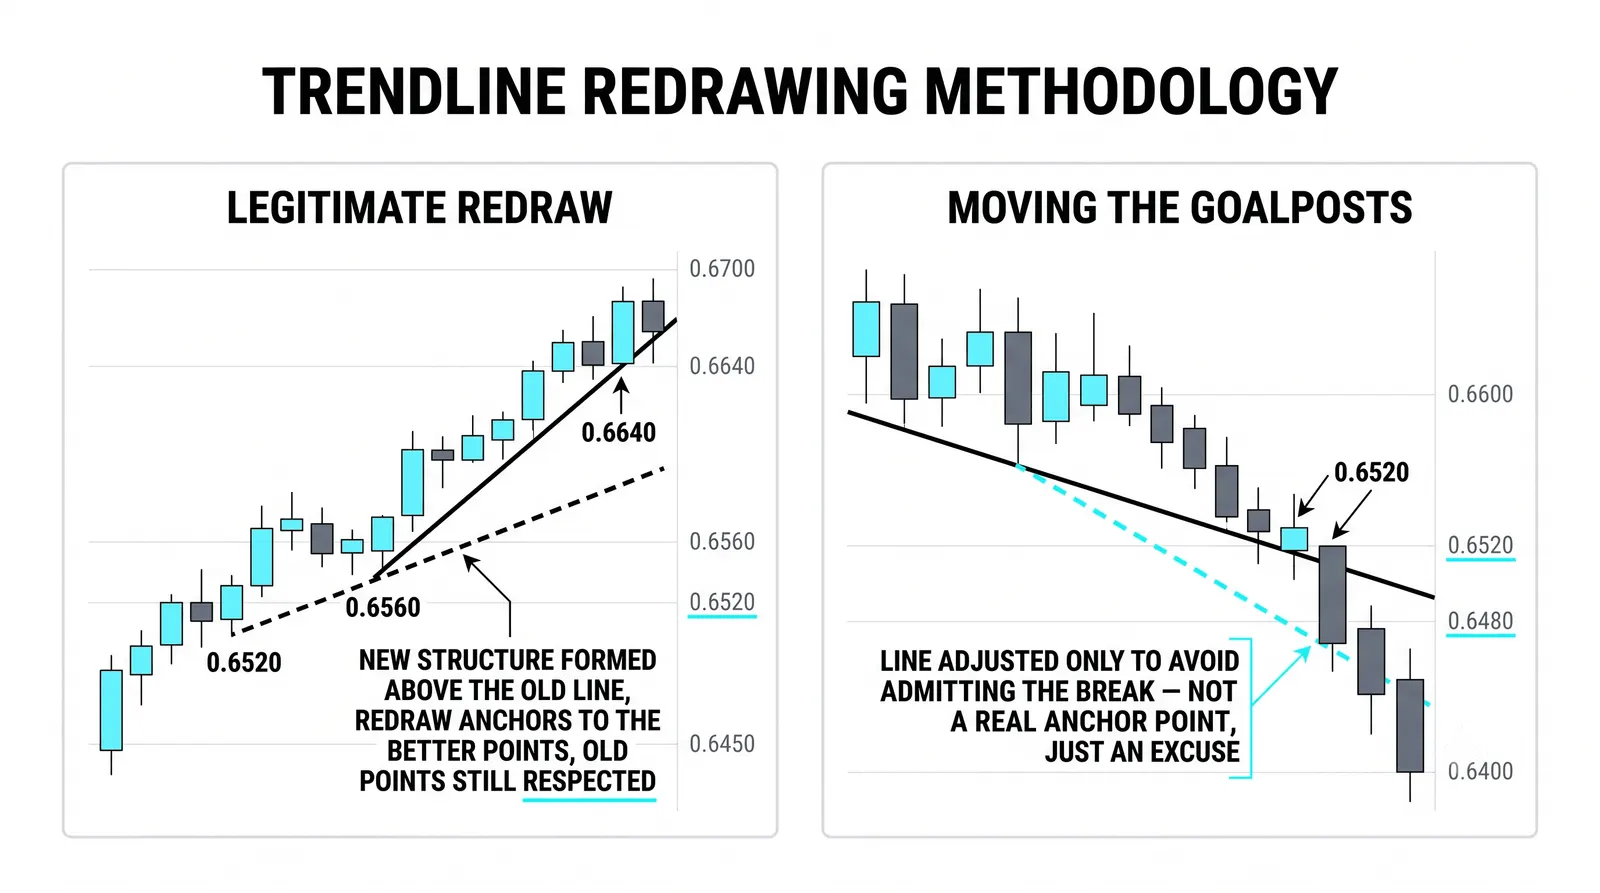
The trap is connecting any two points and redrawing all day. Every time price pokes through your line, you nudge it. After a week, the line fits the chart perfectly and predicts nothing, because you have been reverse-engineering the past instead of testing a hypothesis.
A disciplined trader redraws only when the market makes a new major swing, and can say why out loud. "Price made a new higher low at a level everyone can see, so the line now runs through the two most recent major lows" is a reason. "The line broke so I moved it" is not.
Keep the old lines visible for a while before deleting them. Broken lines often act as reference on the way back, and watching how price treats your discarded lines teaches you faster than any rule list. Erasing instantly hides your mistakes, and your mistakes are the tuition you already paid.
Drawing One Line, Start to Finish
Here is one hypothetical line from birth to redraw, with round numbers.
Step one. A stock sells off and prints a major low at 100. The reversal is violent and obvious. That is anchor one.
Step two. Price rallies to 120, then pulls back and prints a clear higher low at 104 before turning up again. That is anchor two. Both points pass the stranger test.
Step three. Draw the line through 100 and 104 and extend it forward. The line rises four points over the span between the anchors, so you can project where it sits on any future date.
Step four. Weeks later, price pulls back a third time. It dips to 113.50 intraday, right into the projected line, and closes the day at 115. Wick touched, close held above. The line has now been proven by a third touch, and the close confirms it.
Step five. The rally continues, then the market corrects harder and prints a new major higher low at 107. This is a new, obvious swing point. The honest redraw is the flatter line through 100 and 107, because those are now the two most significant anchors on the chart.
Step six. You keep the old 100-to-104 line on the chart lightly marked. If price ever returns to it, you watch the reaction. You did not move the line to fit price. You replaced it because the market handed you a better anchor, and you can say exactly why.
Disciplined vs Careless Drawing
| Habit | Disciplined drawing | Careless drawing |
|---|---|---|
| Anchor points | Two major swings a stranger could find | Any two wiggles that line up |
| Touch handling | Wicks anchor the line, closes judge the break | Every intraday poke treated as a break |
| Redraw rule | Only after a new major swing, with a stated reason | Constant nudging until the line fits the past |
| What the line is used for | A hypothesis to test at the next touch | A prediction to defend |
Drawing Trendlines: Your Questions, Answered
Can I draw a trendline through two minor swings?
You can, but expect it to break without telling you anything. Minor swings carry little commitment, so a line through them measures noise. If you draw one anyway, label it as minor in your own notes and never make a real decision off it.
Should the line touch the wicks or the bodies?
Anchor on the wick extremes, then treat the space between the wick line and the body line as a zone. Judge breaks by where candles close, not by where they poke intraday. This one habit filters out most false breaks.
How far can I extend a line into the future?
Extend it as far as you like, but trust it less the farther out you go. A line's relevance decays as new swings form and the market's rhythm evolves. Once newer major points exist, the old extension is history, not structure.
What do I do after the line breaks?
First, confirm the break with a close beyond the zone, not a wick. Then do nothing with the line itself. Leave it on the chart, wait for the market to print a new major swing, and redraw only when that point exists. A broken line is information, not an emergency.
Once your lines are anchored honestly, the next skill is reading what happens at them: how the third touch behaves, what a strong rejection looks like versus a slow leak through, and how the higher timeframe's line can overrule the one on your working chart. That is where drawing turns into reading, and it is where the next lesson picks up.