Valid vs Invalid Trendlines
Valid trendlines need at least two touchpoints to exist and a third touch to prove they matter. Two points define a line, but they prove nothing about whether the market respects it. The quality of those touches, the angle of the line, and how price behaves around it decide whether the line earns a place on your chart or gets deleted.

Think of a trendline as a guardrail on a mountain road. It only means something if the road keeps touching it.
Most beginners draw too many lines and trust all of them. This post is about the opposite skill: knowing which lines deserve your attention and which ones are fiction.
The Two-Touch Minimum
Any two points on a chart can be connected with a straight line. That is geometry, not analysis. When you connect two swing lows in an uptrend, you have drawn a hypothesis, nothing more.
The hypothesis says: buyers have stepped in at rising prices twice, and they may do it again along this same slope. Until the market tests that idea, the line is a guess with a ruler.
The third touch is where the line starts to mean something. Price comes back down to the line, and buyers defend it again. Now you have evidence that other participants see the same structure you do. The line has gone from your idea to the market's behavior.
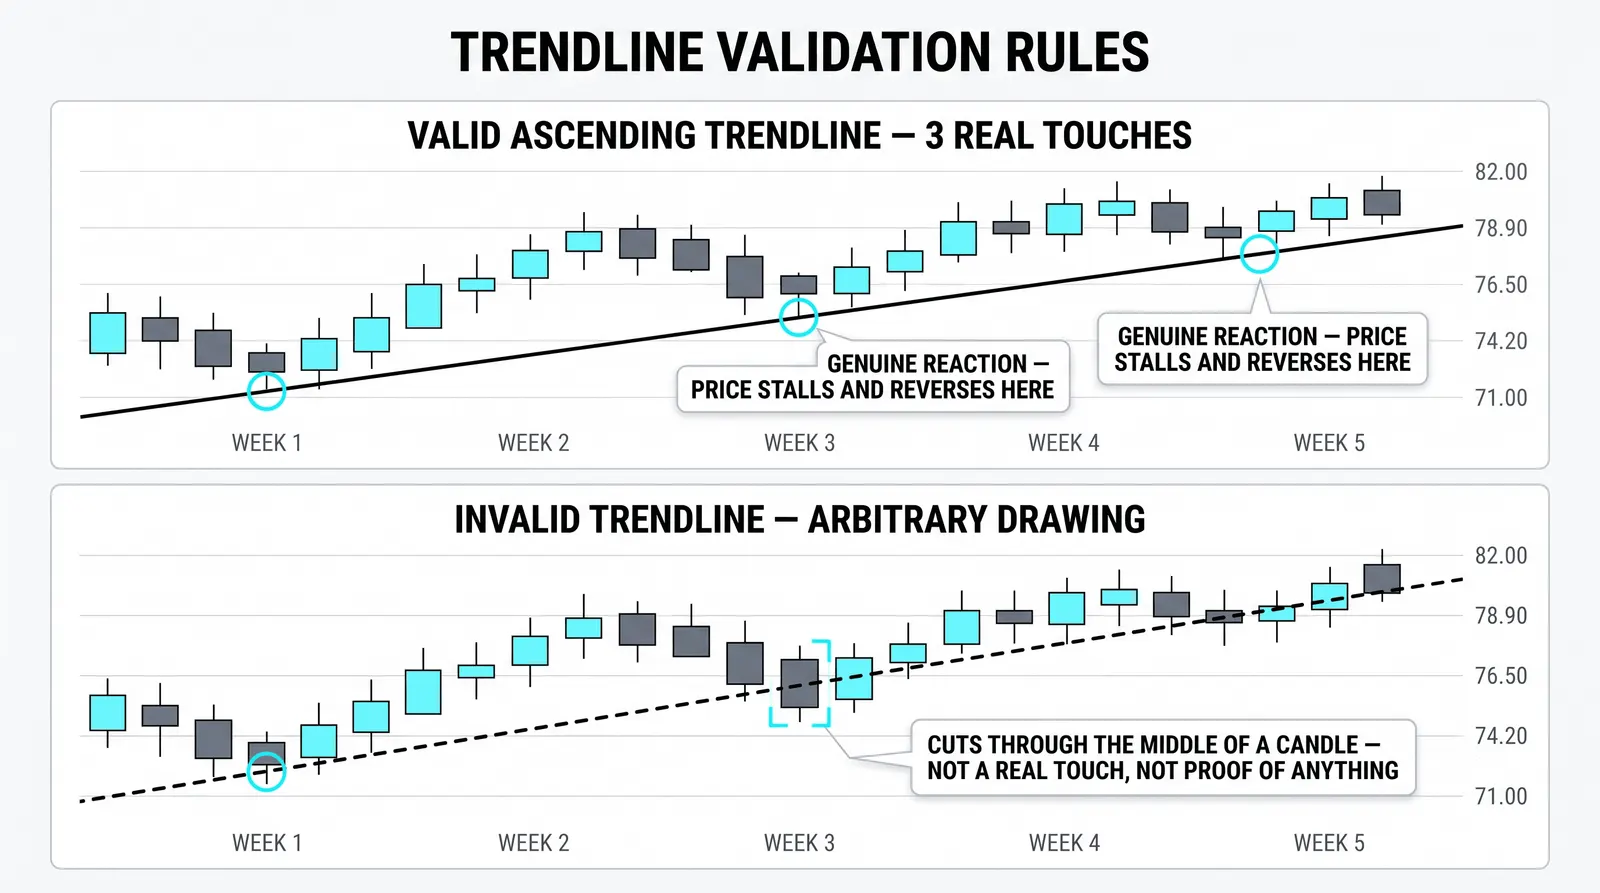
This is why experienced traders treat a two-touch line as a watch item and a three-touch line as a tradable reference. The third touch does not guarantee the line will hold forever. It tells you the line is real enough to plan around.
What Makes a Touch Count
Not every contact between price and line is a touch. A touch has to come from a distinct swing point, not from candles belonging to the same move.
If price rallies off a low and the next three candles all sit near your line, that is one touch, not three. The swings need separation. Price must leave the line, travel, and come back. Each return is a fresh decision by the market.
The quality of the rejection matters as much as the contact itself. A clean touch looks like this: price approaches the line, tags it, and moves away quickly. The fast move away shows urgency. Buyers or sellers were waiting there.
A weak touch looks different. Price drifts into the line, sits on it, grinds sideways, and slowly leaks through before wandering back. That behavior tells you the level is being absorbed, not defended. Count it as a touch if you want, but discount it heavily.
One blunt rule: a touch that produces no reaction is barely a touch at all.
Angle Matters
The slope of a trendline carries information about the trend's temperament. Ignore it and you will draw lines that break constantly and teach you nothing.
A very steep line, the kind you see in vertical rallies, breaks on ordinary noise. Price cannot sustain that climb rate, so the first normal pullback slices through the line. You redraw, it breaks again, and you learn nothing except that the move was fast. Steep lines describe excitement, not structure.
A very flat line has the opposite problem. If the slope is close to horizontal, you have not drawn a trendline. You have drawn a rough support zone with extra steps. Flat lines contain no information about the pace of the trend because there is barely a trend to measure.
The useful band sits in between. A moderate slope, the kind of grind where price makes steady progress with normal pullbacks, tends to produce lines that hold and retest cleanly. These lines survive because the trend behind them is sustainable.
When you catch yourself drawing a line that needs price to sprint or to stand still, stop. The line is describing a move that cannot last or a move that is not happening.
What Invalidation Actually Looks Like
A trendline is not broken because a wick poked through it. Invalidation requires a decisive close beyond the line by a real margin.
Wicks are where stops get hunted and where intraday noise lives. A single candle spiking through the line and closing back on the correct side is a test, not a break. Many strong trendlines survive several wick pokes over their lifetime.
A close beyond the line is a different statement. It means the market settled on the other side, not just visited. The margin matters too. A close a fraction of a percent past the line is ambiguous. A close of two or three percent beyond it, on a daily chart, is a statement you should take seriously.
Then watch the retest. After a genuine break, price often comes back to the line from the other side. If the old support now acts as resistance and price gets rejected, the break is confirmed. The line has flipped its role, and the trend structure has changed.
If price reclaims the line quickly and holds above it, the break was noise. That happens, and it is why you wait for the close and the retest instead of reacting to the first poke. Patience here saves you from being shaken out of good reads.
When to Redraw and When to Delete
Lines serve the analysis. The analysis does not serve the lines.
Redrawing is legitimate when the market gives you new information. A trend accelerates, a higher swing low forms, and the old line no longer describes the structure. Adjusting to clearly better swing points is honest chart work.
Redrawing becomes self-deception when you do it to avoid being wrong. Every time price breaks your line, you nudge it to fit the newest low. After a few rounds of this, your chart is full of lines that have never been tested and never predicted anything. That is how a chart fills with fiction.
A practical rule: a line gets one honest adjustment if the structure genuinely shifts. After that, it holds or it dies. Deleting a broken line is not a loss. It is the analysis working.
The Life and Death of One Line
Here is a hypothetical walkthrough with round numbers, so you can see each event and what it says.
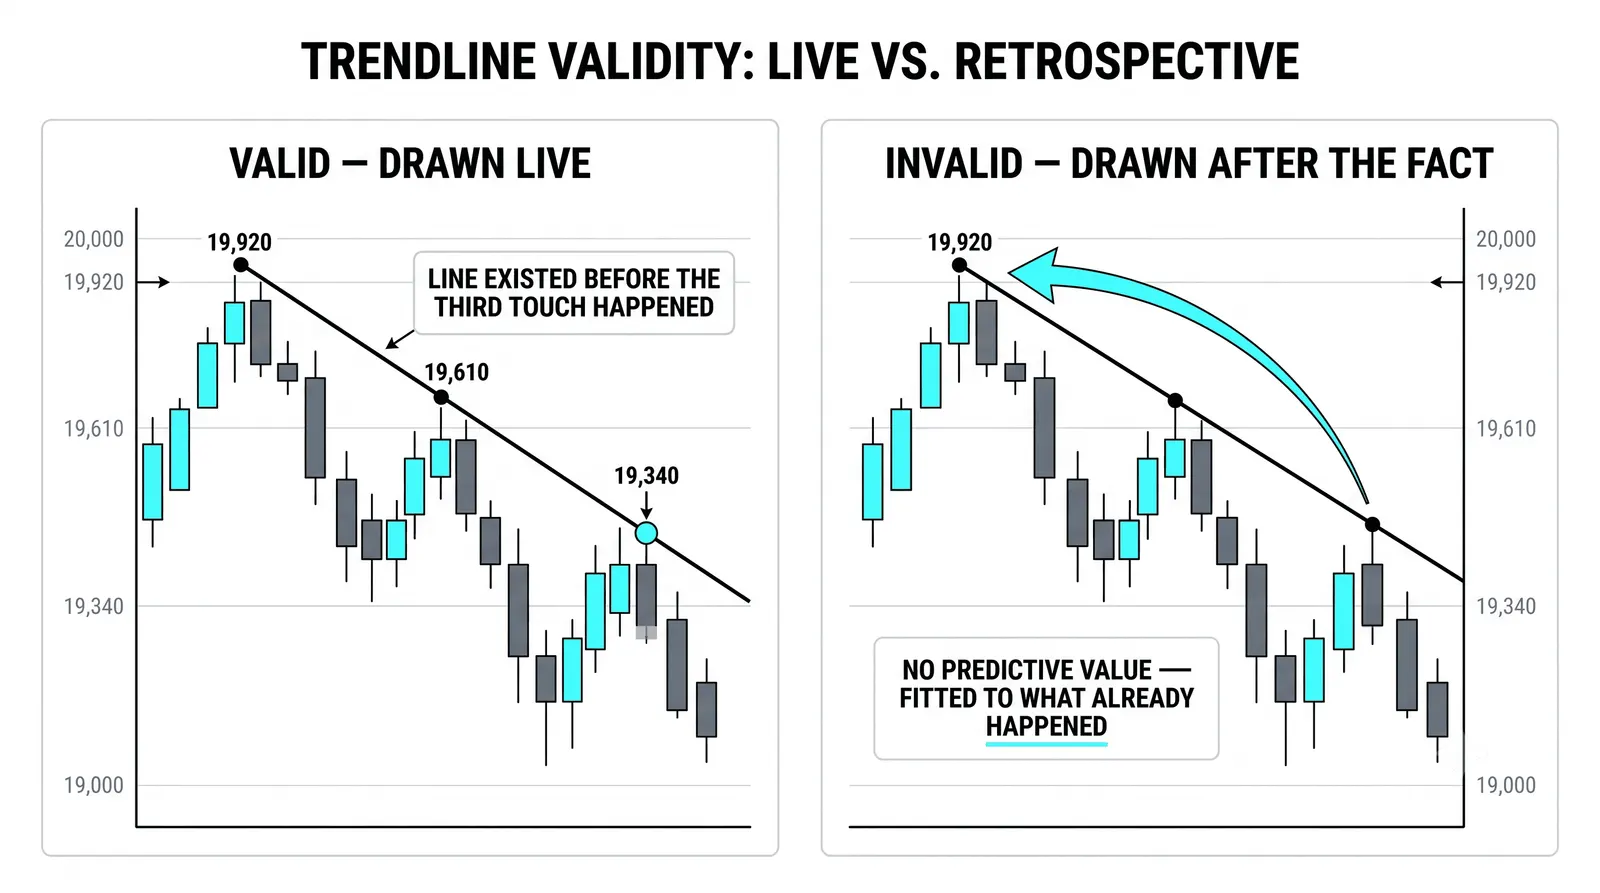
Price bottoms at 100 and rallies. It pulls back, finds buyers at 104, and rallies again. You connect the 100 and 104 lows. You now have a two-touch line and a hypothesis.
Weeks later, price pulls back a third time and tags the line near 107. It bounces fast, closing the week well off the low. The third touch held with a clean rejection. The line is now valid, and you can plan around it: longs near the line with risk defined below it.
Price climbs to 120. Then momentum fades. A daily candle closes at roughly 3 percent under the line. Not a wick, a close, with real margin. Your line is now under suspicion, and your open risk should reflect that.
Price drifts back up and retests the line from below. The retest is weak. Price stalls at the line, prints small candles, and rolls over. The old support is acting as resistance. The break is confirmed.
From there, price prints lower highs. The uptrend structure the line described is gone. You delete the line, not in frustration, but because it has finished its job. It told you when the trend was alive and it told you when the trend died.
A Short Checklist for a Valid Trendline
- Two distinct swing points define the line, with clear separation between them.
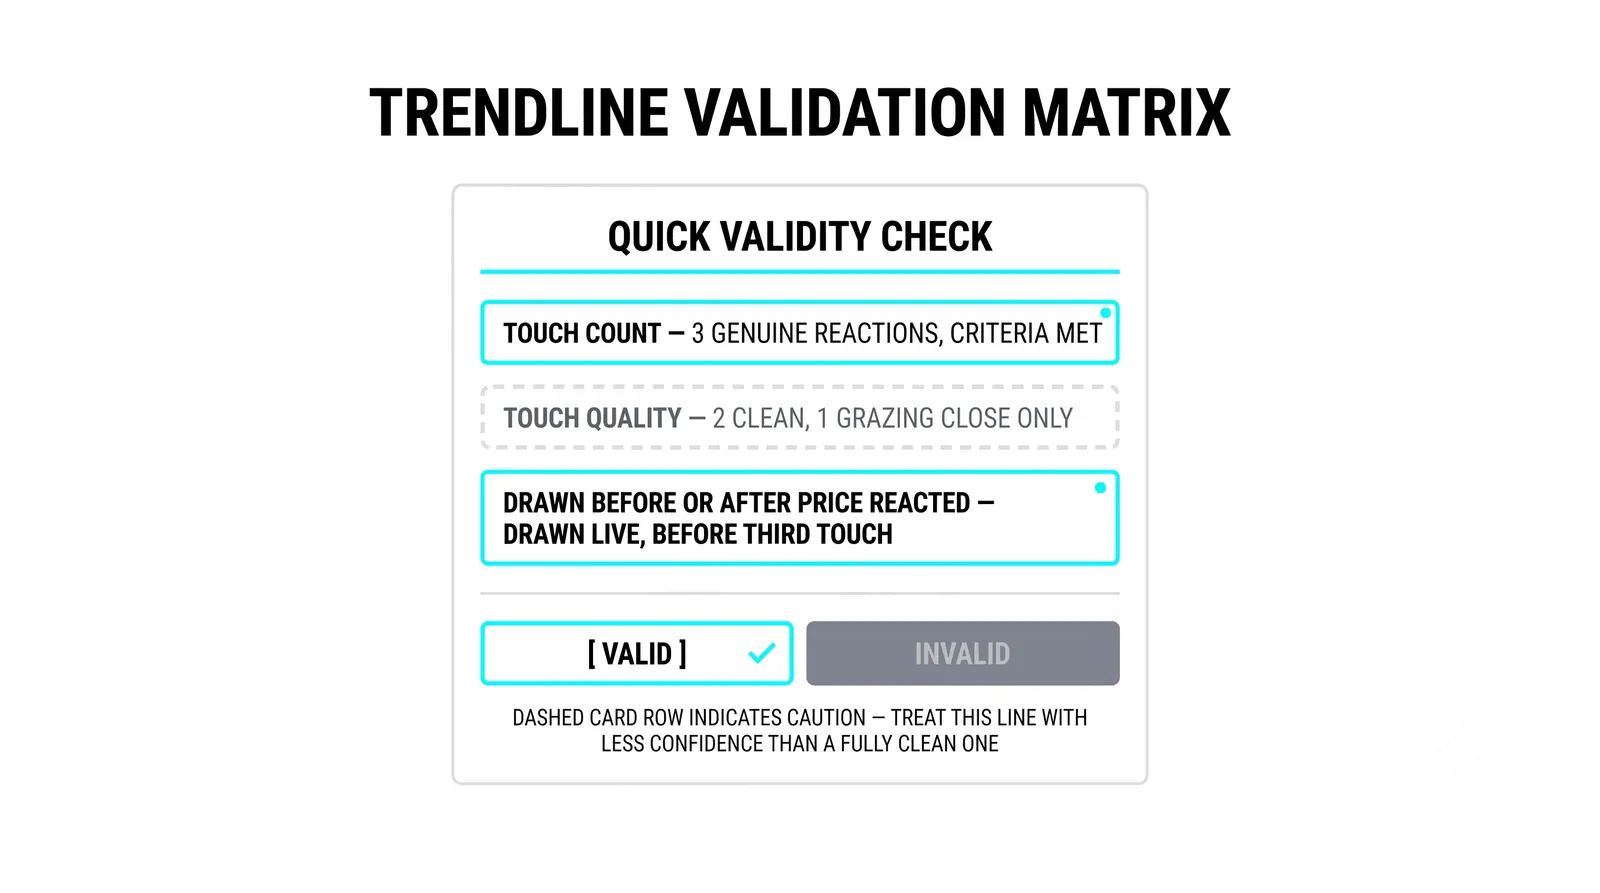
- A third touch confirms the market respects it, ideally with a fast rejection.
- Moderate angle that reflects a sustainable pace, not a vertical sprint or a flat drift.
- Clean reactions at the line, not slow grinds through it.
- Invalidation defined in advance: a decisive close beyond the line by a real margin, not a wick poke.
- A retest plan: failed retest confirms the break, a fast reclaim warns you it was noise.
- Willingness to delete the line when the structure it describes no longer exists.
Common Questions About Trendlines
How many touches make a trendline valid?
Two touches create the line and a third touch validates it. After three quality touches, the line has earned a place in your analysis. Additional touches can strengthen it further, but watch for diminishing reactions, because a line that gets touched often with weaker bounces each time may be wearing out.
Should trendlines use wicks or closes?
Draw the line off the extremes, meaning the wicks, because that is where price actually turned. But judge breaks by the close. Wicks define the line's position; closes decide its fate. Mixing these up in either direction causes problems: drawing from closes misses the real turning points, and treating wick pokes as breaks gets you shaken out of valid structures.
What if price slightly pierces the line?
A small poke through the line that closes back on the correct side is a test, not a break. Treat it as information: someone probed the level and the level held. Only a decisive close beyond the line, ideally followed by a failed retest, should make you treat the line as broken.
How steep is too steep?
If the line requires price to keep accelerating just to stay above it, it is too steep. A practical test is to ask whether the trend could survive one ordinary pullback without breaking the line. If the answer is no, the line is measuring a burst of momentum, not a structure you can trade against.
Once you can judge which lines deserve trust, the next step is combining them with swing structure on a higher timeframe, so a valid trendline on your chart is also pointing in the direction the bigger picture favors.