Lower Lows and Lower Highs
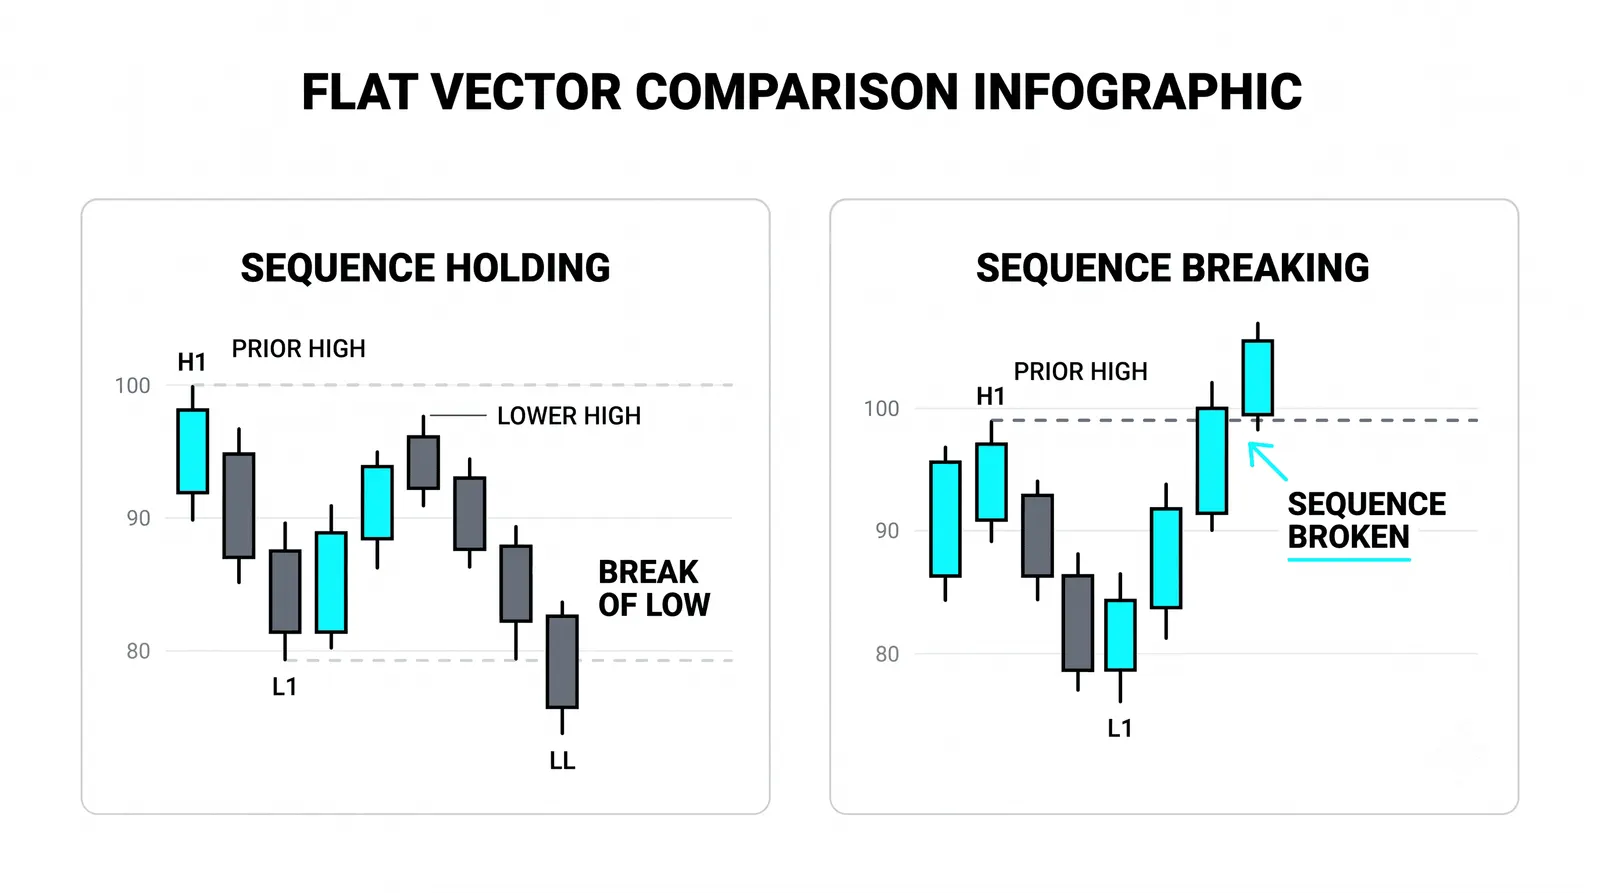
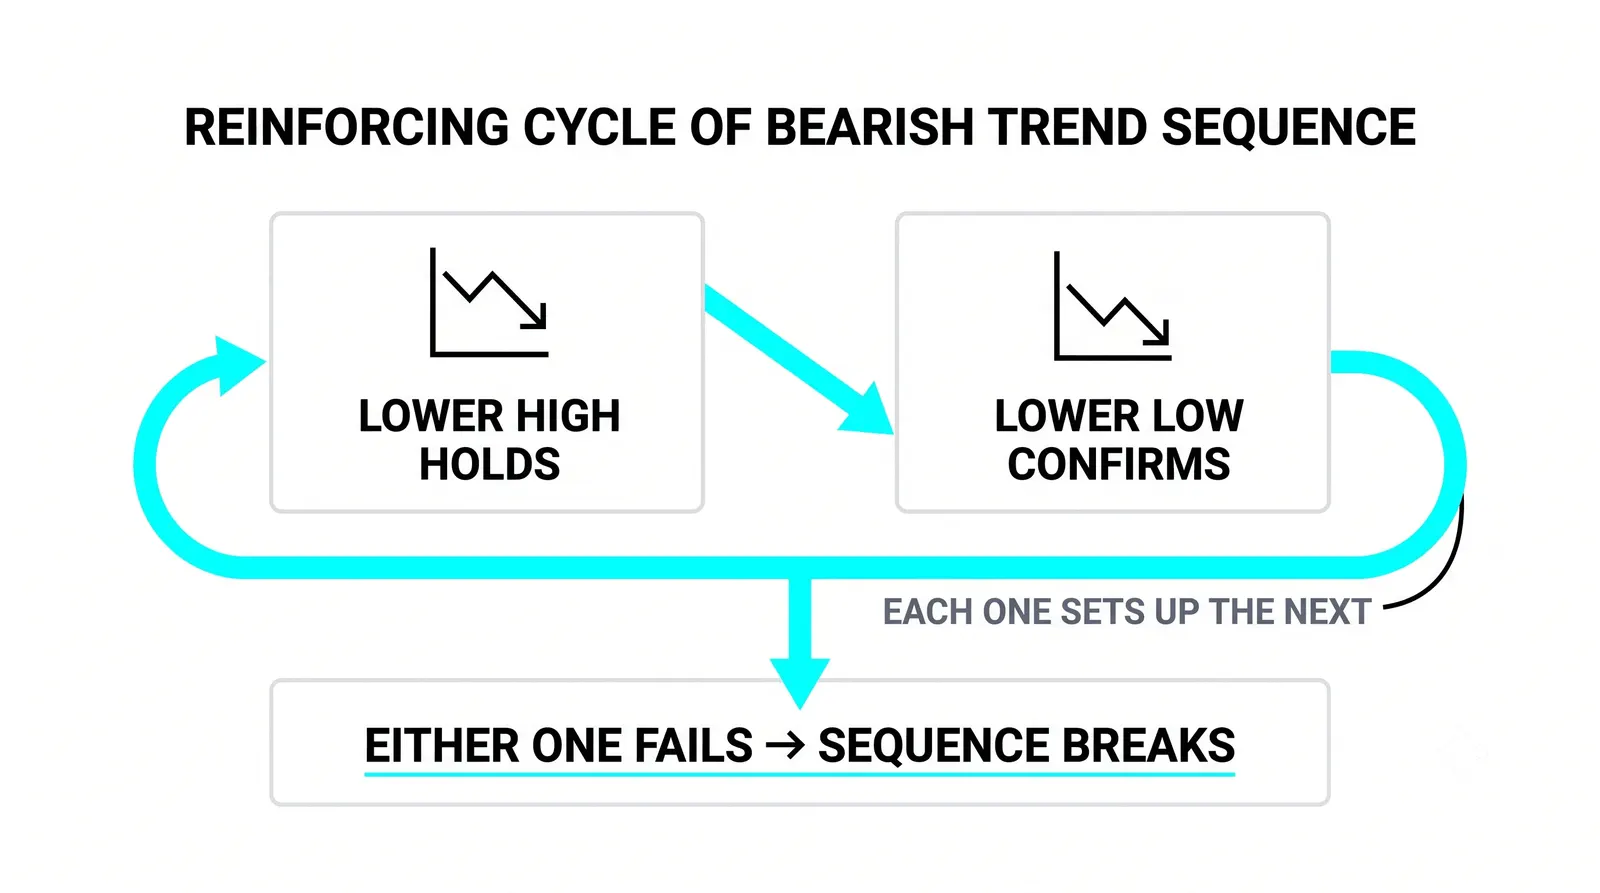
Lower lows and lower highs are the two prints that define a downtrend: each rally dies below the last high, and each decline undercuts the last low. As long as that sequence holds, the downtrend is alive. The moment it breaks, you have your first objective warning that something has changed.

Think of it like a store running successive sales, where each markdown undercuts the last and shoppers keep waiting for an even better one. Nobody pays full price when the pattern says a cheaper price is coming.
This post walks through what each print means, why the highs carry the real information, how breaks warn you, and how to avoid the common misreads.
What Lower Lows and Lower Highs Actually Are
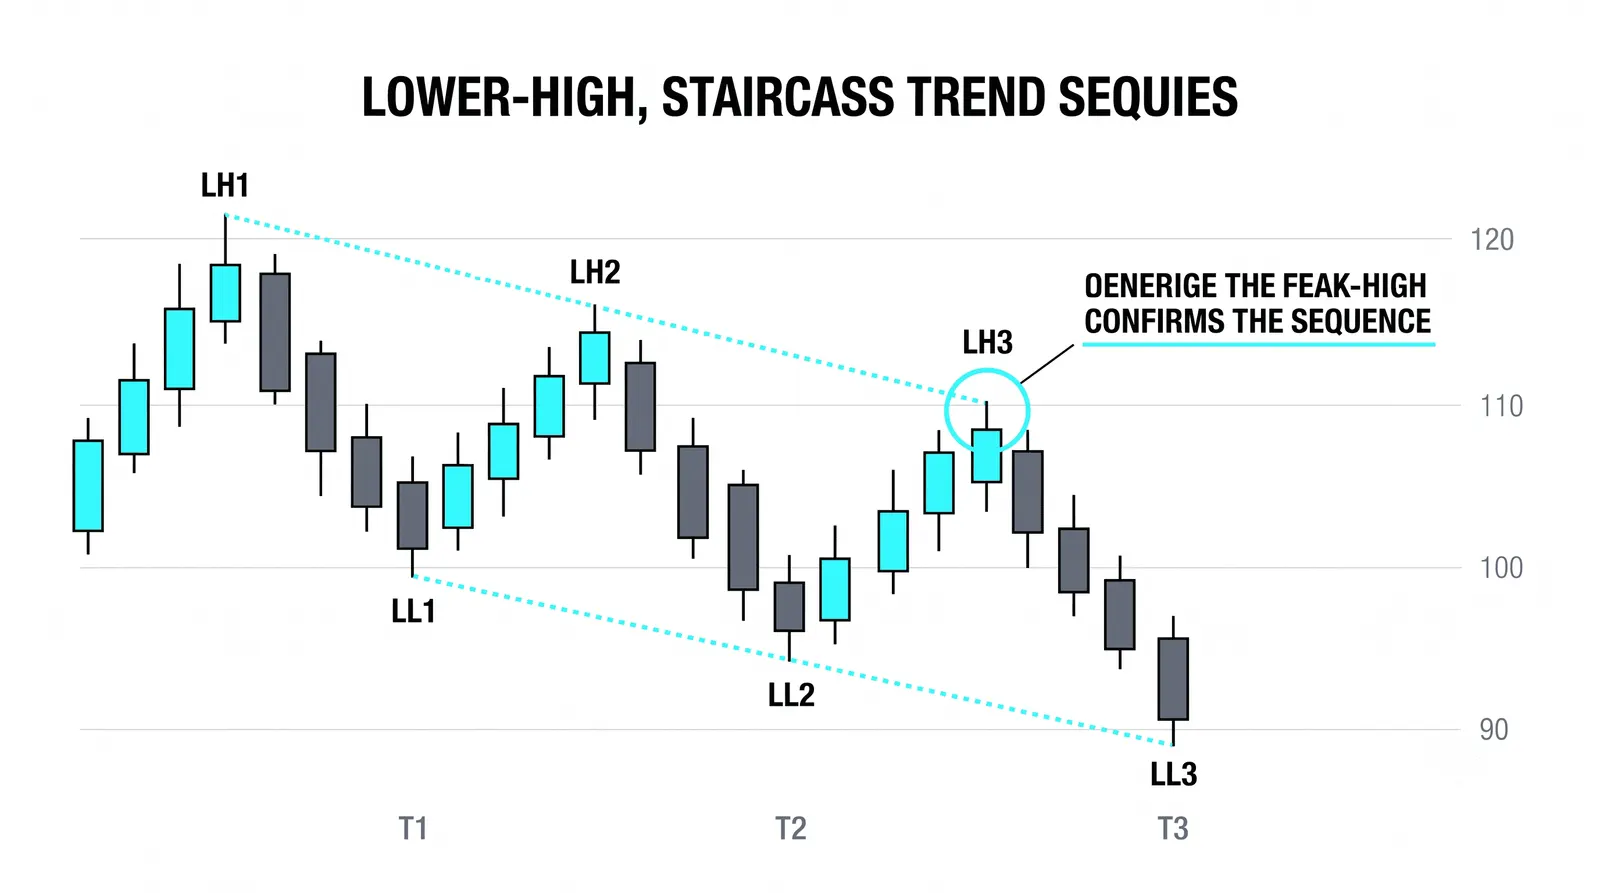
A lower low is a swing bottom that prints below the previous swing bottom. A lower high is a swing top that prints below the previous swing top. You need both, alternating, to have a downtrend.
Take a concrete ladder. Price drops from 100 to 96. That 96 is a low. Price bounces to 99. That 99 is a high, and it sits below 100, so it is a lower high. Price drops again to 94. That 94 undercuts 96, so it is a lower low. Price bounces to 98. That 98 sits below 99, another lower high.
Read what each print says. The drop to 96 tells you sellers were willing to push price well under the round number. The bounce to 99 tells you buyers showed up, but only with enough strength to recover three points, and they quit before reclaiming 100. The drop to 94 tells you sellers pressed harder than last time and buyers demanded a deeper discount before stepping in. The bounce to 98 tells you the buyers who entered at 94 took profit early, and sellers reappeared sooner than they did at 99.
Every number in that ladder is a vote. Sellers keep voting earlier and lower. Buyers keep demanding more before they commit.
Why the Sequence Defines the Trend
A trend is not a line on a chart. It is a behavior pattern, and this sequence is the behavior.
Each lower high means sellers accepted a worse price than last time rather than wait for a better one. That is urgency. A seller who dumps at 98 when the last bounce reached 99 is telling you they do not believe 99 is coming back soon.
Each lower low means buyers refused to step in until price got cheaper than last time. That is reluctance. The bid keeps moving down because nobody wants to catch something still falling.
Of the two, the highs carry the real information. This is the mirror of an uptrend, where the higher lows matter most because they show buyers paying up sooner. In a downtrend, the lower highs show sellers hitting bids sooner. Lows can get undercut by a single flush of panic. Highs require a sustained attempt to rally, and when that attempt keeps failing lower, the message is consistent.
The downtrend lives exactly as long as this pattern holds. Not one bar longer.
How Breaks of the Sequence Warn You
The first objective warning is a high that exceeds the prior high. If the last bounce topped at 98 and the next rally reaches 99.50, the sequence just broke. Sellers did not show up early this time. Buyers pushed further than they were allowed to before.
One broken high is caution, not confirmation. Trends often produce one overshoot before resuming. The confirmation comes when price then prints a higher low, a pullback that holds above the prior low. Broken high plus higher low means the sequence has flipped, and the downtrend is over until a new sequence forms.
So the ladder of evidence runs like this. Intact lower highs and lower lows: downtrend, treat bounces as suspect. One broken high: step back, tighten risk, stop assuming every rally fails. Broken high followed by a higher low: the downtrend is done, and you wait to see what replaces it.
What replaces it is not automatically an uptrend. Sometimes the market goes sideways and chops. A broken downtrend is an absence of sellers in control, not proof that buyers have taken over.
The Ladder Running Downhill
Here is a hypothetical worked example with round numbers. Stock XYZ trades at 100.
Leg one: price falls from 100 to 96. Sellers control four points of ground. Buyers appear at 96, but only after a real discount.
Bounce one: price recovers to 99. Buyers reclaimed three of the four lost points, then stalled. Sellers reappeared one point below where the decline started. That 99 is the first lower high, and it is the print that matters most so far.
Leg two: price falls to 94. The low at 96 gave way. Buyers who bought the 96 bounce are underwater, and some of them are now selling too, adding pressure. The new low at 94 confirms the lower low.
Bounce two: price recovers to 98. Notice the shrinking bounce. The first bounce recovered three points off the low. This one recovered four points off a lower low but still stopped below 99. Sellers are defending a descending line of highs: 100, 99, 98.
Leg three: price falls to 92. Another lower low. The ladder now reads 100, 96, 99, 94, 98, 92. Every high is lower than the one before it. Every low is lower than the one before it. The downtrend is intact, and the burden of proof sits entirely on the buyers.
Now suppose the next bounce reaches 99.50. That print breaks the descending line of highs. Nothing is confirmed yet, but the seller behavior that defined this trend just changed. If the following dip holds above 92, the sequence is broken both ways, and the honest read is that the downtrend is over.
Common Misreads
The most common mistake is calling every downswing a downtrend. It is not. One lower low without a lower high is often just a pullback inside an uptrend. If price makes a high at 105, dips to 101 under a prior low of 102, then rallies to 106, nothing bearish happened. The highs kept rising. Buyers kept paying up.
The second misread is mixing timeframes. A downtrend on the 15-minute chart can be a single pullback on the daily. Before you label anything, decide which timeframe you are reading, and count only the swing highs and lows that belong to it. A high that matters on the daily is a major swing, not every minor wiggle.
The third misread is treating a broken high as an instant buy signal. One overshoot can be a stop run, a news spike, or simple noise. Wait for the higher low to confirm. Patience here costs you a little of the move and saves you from many false flips.
The fourth is ignoring the lows entirely. Lower highs tell you sellers are eager, but if lows stop making new lows, the sellers are not gaining ground. Both prints together tell the story.
A Short Checklist for an Intact Downtrend
Before you treat a market as trending down, run through this list:
- At least two lower highs. One failed bounce is an event. Two establish a pattern of sellers arriving earlier each time.
- At least two lower lows. Sellers must actually gain ground, not just cap rallies.
- Alternation. High, low, high, low, in order. Two lows in a row without an intervening swing high is a messy read, not a clean trend.
- One timeframe. Every swing you count comes from the same chart. No borrowing highs from the hourly and lows from the daily.
- No broken high. The most recent rally still stopped below the prior swing high. If it did not, the trend is under question, not intact.
If all five boxes check, the downtrend is intact and rallies are suspect until proven otherwise. If any box fails, downgrade your conviction.
Questions About Lower Lows and Lower Highs
What breaks a downtrend first?
A rally that exceeds the prior swing high is the first break. That single print tells you sellers did not defend their line. It is a warning, not a confirmation. Full confirmation comes when the next pullback prints a higher low, because then both sides of the sequence have flipped.
Do lower highs matter more than lower lows?
Yes, slightly. Lower highs show sellers accepting worse prices rather than waiting, which is the active force in a downtrend. Lower lows can result from a single wave of panic. Watch the highs for the earliest sign of change, but never ignore the lows, because a downtrend that stops making lower lows is losing ground even if the highs still look heavy.
Can I short every lower high?
No. A lower high is a location to evaluate, not an automatic entry. You still need the broader context: where price sits relative to support, what the higher timeframe shows, and what your risk is if the high breaks. Shorting blindly at every lower high works until the one that breaks the sequence, and that trade can hand back several winners. Define your invalidation before you enter, and size so a loss is routine.
Which timeframe should I read?
Read the timeframe that matches your holding period. If you hold trades for days, the daily swing highs and lows are the ones that count, and intraday lower highs are just noise inside your trade. If you scalp, the 5-minute sequence is your trend. Pick one primary timeframe, mark its swings, and use a higher timeframe only for context on where your trend sits inside the bigger picture.
Once you can read this sequence fluently, the next skill is spotting where it interacts with support and resistance, because a lower high that forms exactly at an old support level is a far stronger signal than one floating in empty space.