Head and Shoulders — Anatomy of a Top
The head and shoulders is a three-peak topping pattern where the middle peak rises highest, and it becomes a signal only when price closes below the line connecting the two valleys between the peaks, called the neckline. That close is the trigger. Everything before it is a shape, not a signal.

Traders love spotting this pattern early. That enthusiasm costs money. A head and shoulders that never breaks its neckline is just three bumps on a chart, and the market produces those constantly. Your job is to read what each peak tells you, then wait for the market to confirm the story.
The Three Peaks and What Each One Means
Think of the pattern like a firework: the launch, the burst above everything else, and sparks that never reach that height again. Each peak is a stage in the same story of fading demand.
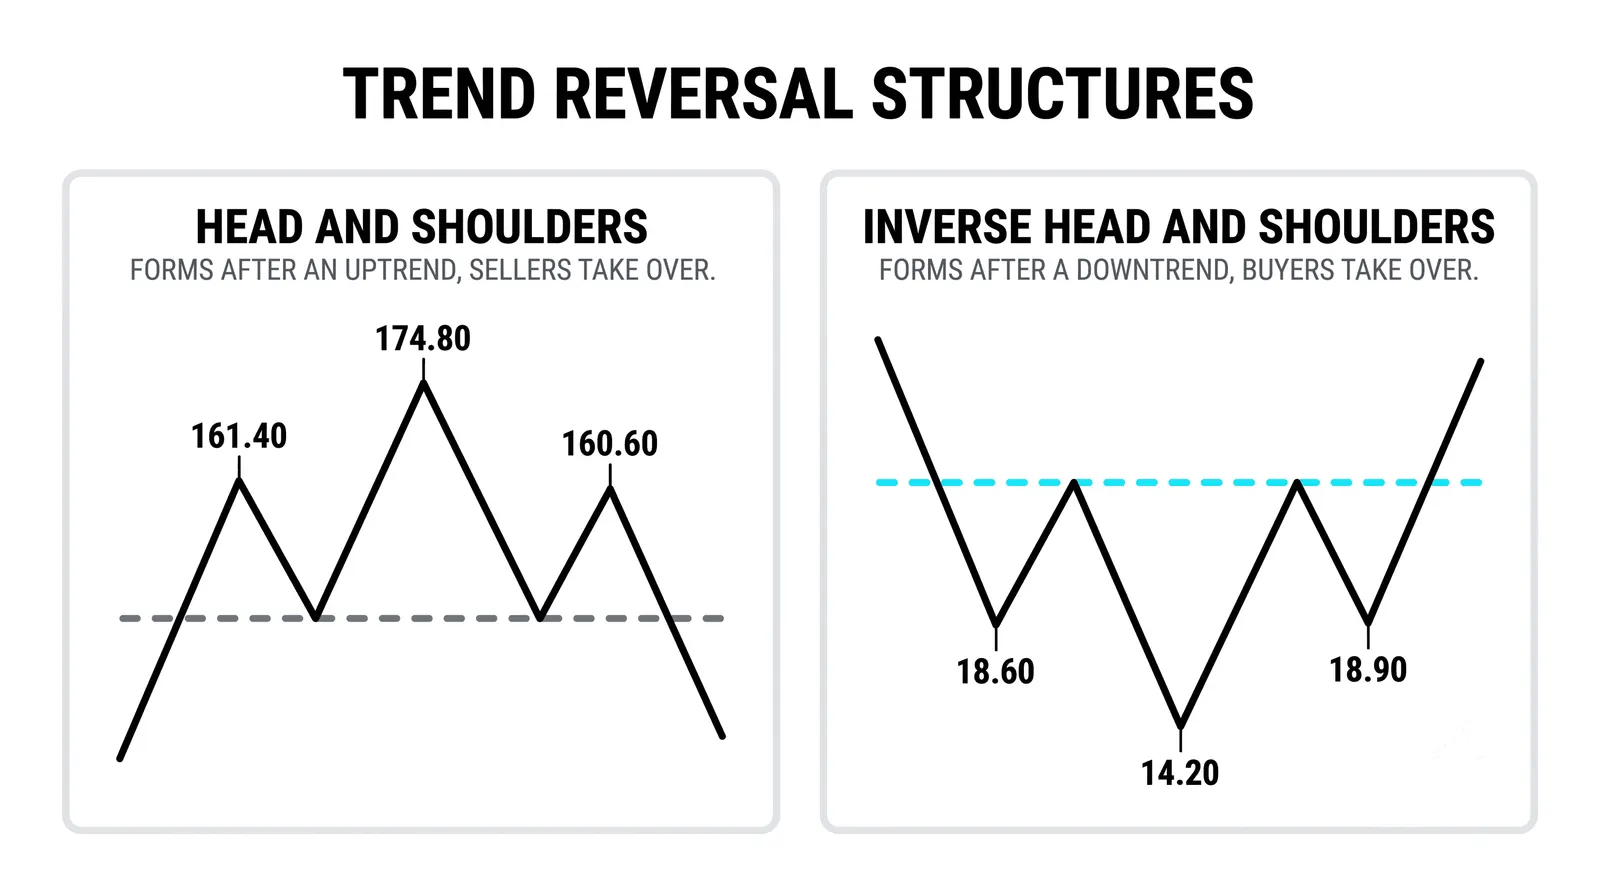
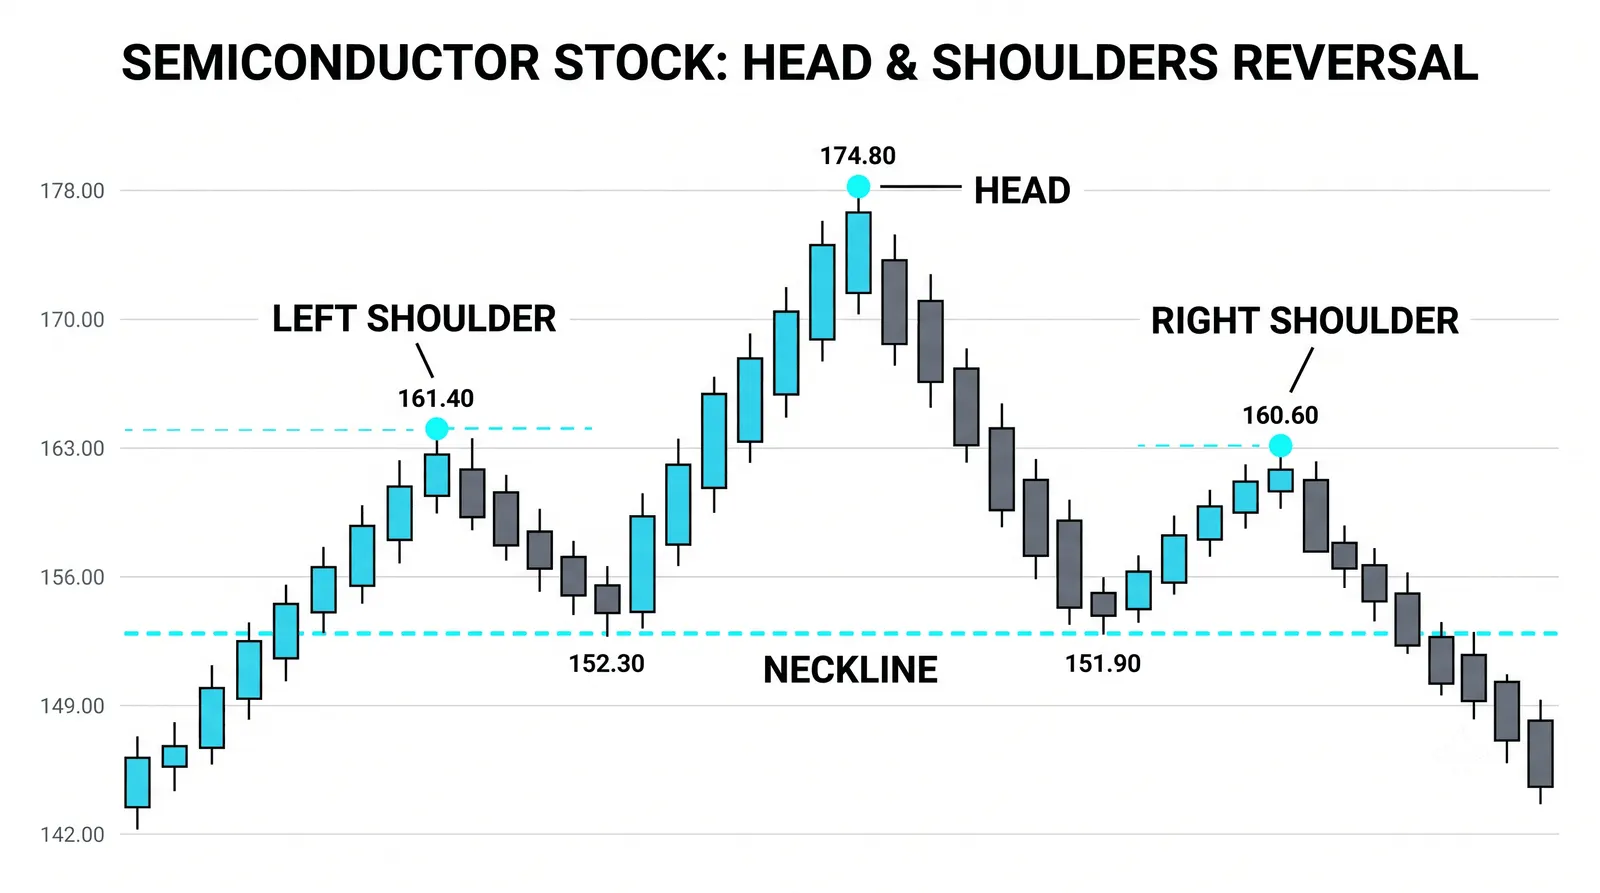
The left shoulder. Buyers are still strong here. Price pushes to a new high, then pulls back. Nothing about this looks bearish. Rallies pause all the time, and this pause looks like every healthy pullback that came before it.
The head. Price rallies again and exceeds the left shoulder's high. This is the last burst of demand, the highest high of the entire move. Late buyers pile in. On the chart it looks like strength, and at the time, it is strength. Only in hindsight does it become the top.
The right shoulder. Price rallies a third time and fails to reach the head's high. This is the first hard evidence of weakness. Buyers had a clear target, the old high, and could not get there. Demand is thinning.
You may have studied double tops elsewhere on this site: two failed attempts at one ceiling. The head and shoulders is a different animal. Three peaks instead of two, a defined neckline, and a measured move that the double top does not emphasize the same way. Do not confuse them.
The Neckline: Where the Pattern Becomes Real
Draw the neckline through the two valleys, the low after the left shoulder and the low after the head. Connect them with a straight line. It can slope up, slope down, or sit flat. All three are valid.
Until price breaks it, the neckline is support. Buyers have defended that zone twice already. Respecting it a third time would weaken the bearish case, not strengthen it.
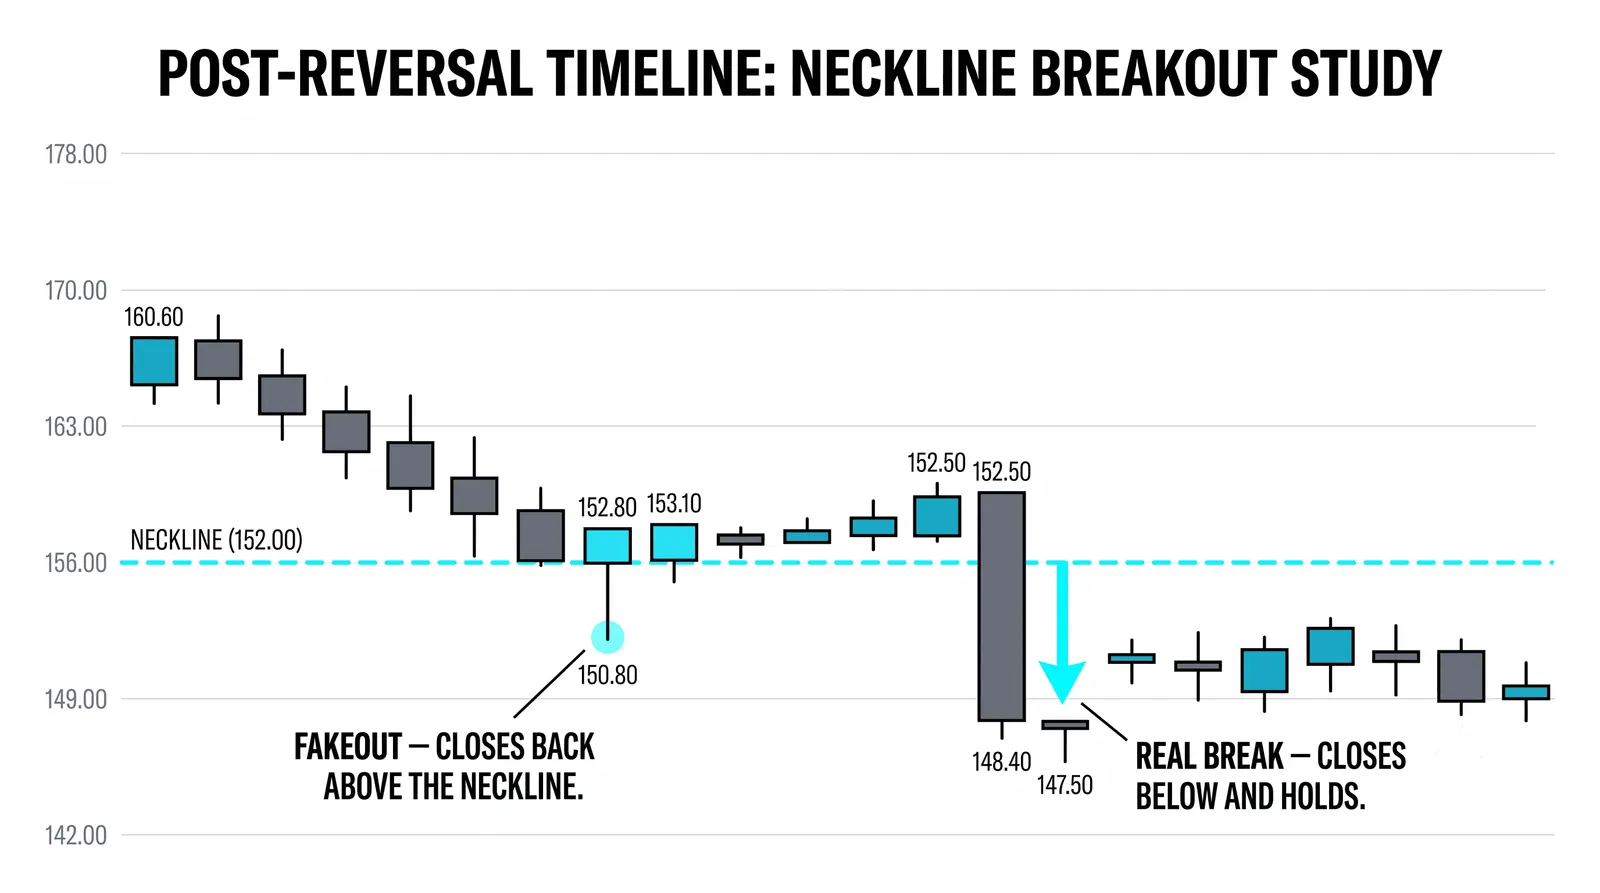
The pattern is not confirmed until a full close below the neckline. An intraday poke through that recovers by the close is a warning, not a trigger. Wick-throughs get faded by traders who know how often they fail, which is the core of reading a break properly.
Be blunt with yourself here: no neckline break, no trade. Traders who short the right shoulder because the pattern "looks complete" are guessing. Sometimes they get paid. Often they get run over by a market that was simply consolidating before another leg up.
The Measured Move
Measure the vertical distance from the head's high down to the neckline. Then project that same distance down from the breakout point. That gives you the measured target.
Treat it as a guide, never a promise. The measured move tells you what the pattern is "worth" if it plays out cleanly. Markets are not obligated to deliver it. Price can fall short, blow past it, or reverse halfway there.
Use the target to frame reward against risk, not as a prophecy. If the target sits 8 points below the break and your stop sits 3 points above it, the trade offers a sensible ratio. That is the right way to use the number.
The Inverse Head and Shoulders
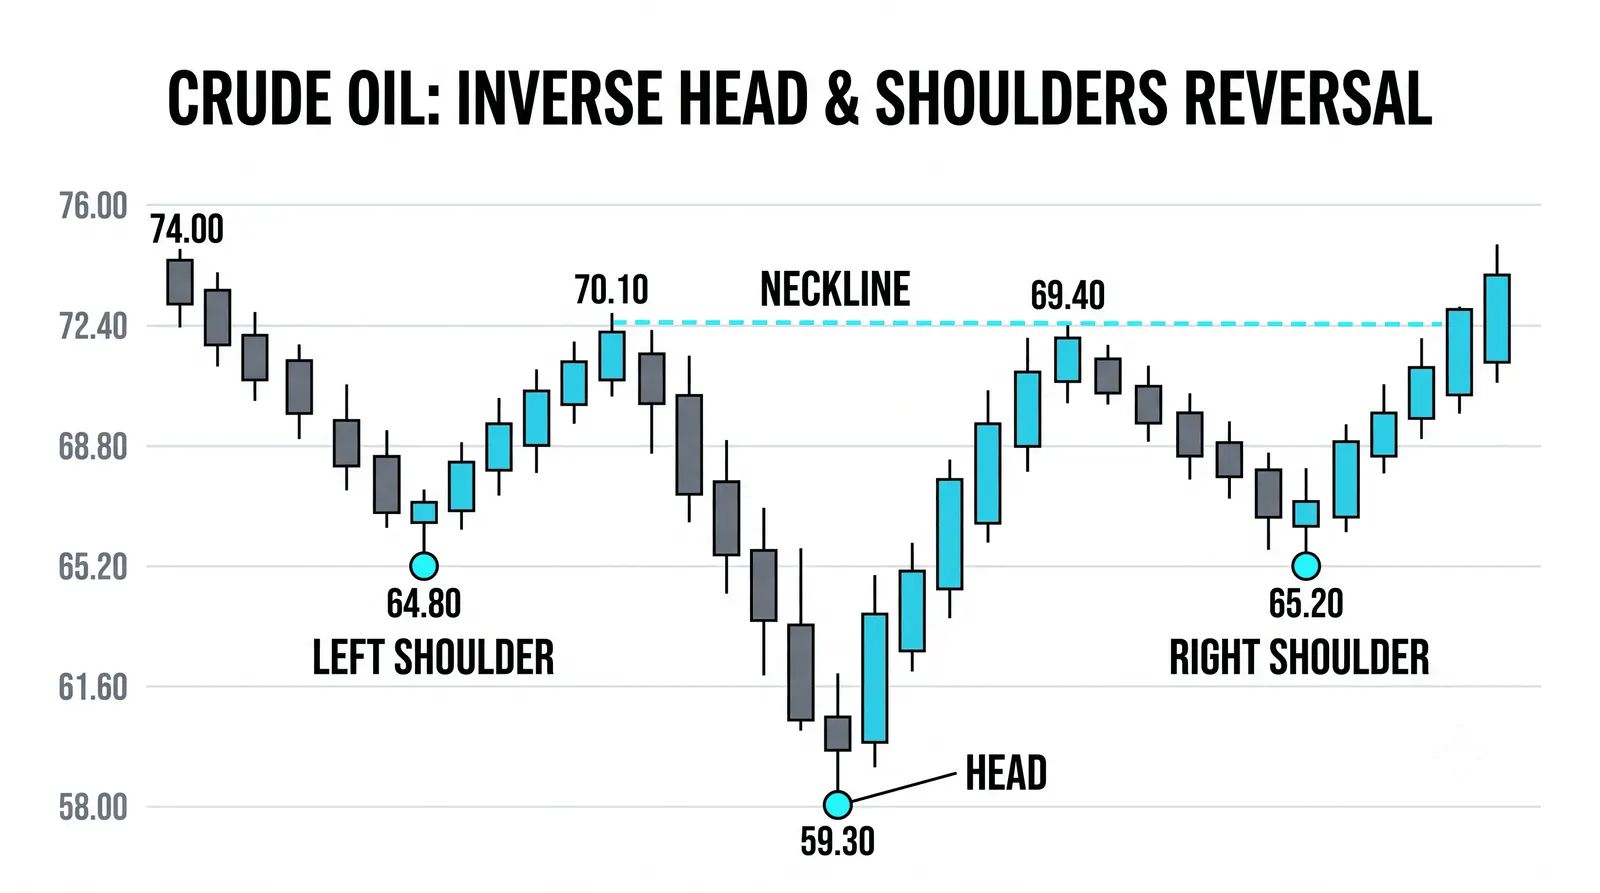
Flip the whole structure upside down and you get the inverse head and shoulders, a bottoming pattern. Two troughs with a deeper trough between them, and a neckline drawn across the two rallies. A close above the neckline confirms it.
The logic mirrors the topping version. The left shoulder shows sellers still in control. The head is the final flush of supply, the lowest low. The right shoulder shows sellers failing to push price back to that low, the first hard evidence that supply is drying up.
The inverse version often behaves better at real support, and there is a reason. Bottoms tend to form where genuine value buyers step in, and those buyers are patient and persistent. Tops, by contrast, can form on nothing more than exhausted enthusiasm, which makes them twitchier. When an inverse head and shoulders completes at a level that held on the weekly chart, it deserves extra respect.
The Firework Over 72
Here is a hypothetical walkthrough with round numbers. A stock rallies from 60 and the pattern unfolds like this:
- Left shoulder: price pushes to 68, then pulls back to 64. Buyers still look strong. Nothing alarming yet.
- Head: price rallies to 72, the highest high of the move, then falls back to 64.20. The last burst of demand.
- Right shoulder: price pushes to 68.50 and stalls, well short of 72. Buyers failed to reclaim the old high. First hard evidence of weakness.
- Neckline: drawn through the two valleys at 64 and 64.20, sitting roughly at 64.
- The break: price closes at 63.40, a full close below the neckline. The pattern is now confirmed, and only now.
Now the measured move. Head at 72, neckline at 64, so the distance is 8 points. Project 8 points down from the break at 64 and the target is 56.
Notice what the sequence required. A trader who shorted at 68.50 on the right shoulder was early and unconfirmed. A trader who waited for the close at 63.40 had a defined pattern, a defined target at 56, and a logical place to be wrong, back above the neckline. Waiting cost a few points of entry. It bought confirmation.
The Three Peaks at a Glance
| Peak | What It Shows | The Warning It Gives | Volume / Participation |
|---|---|---|---|
| Left shoulder | Buyers still strong, rally pauses | None yet; looks like a normal pullback | Usually healthy volume on the push up |
| Head | Last burst of demand, highest high | Hidden; only visible in hindsight | Often lighter volume than the left shoulder, a quiet clue |
| Right shoulder | Buyers fail to reach the old high | First hard evidence of weakness | Typically the lightest volume of the three |
The volume row deserves a second look. Shrinking participation across the three peaks is the pattern's fingerprint. Each rally attracts fewer buyers than the last. When you see that decline alongside the shape, the pattern carries more weight.
Head and Shoulders, Answered
Must the shoulders be exactly level?
No. Perfectly symmetric shoulders are rare, and demanding them will filter out most valid patterns. What matters is that the right shoulder clearly fails below the head. A right shoulder at 68.50 against a left shoulder at 68 is fine. A right shoulder that exceeds the head is not a head and shoulders at all.
What if price closes below the neckline but recovers?
That is a failed breakdown, and it happens often enough that you must plan for it. If price closes back above the neckline shortly after breaking it, the bearish case is damaged and any short should be reassessed or exited. Some of the sharpest rallies start from failed breakdowns, because trapped shorts become fuel.
Can a head and shoulders fail?
Yes, and more often than pattern books admit. The most common failure is a neckline that never breaks: price holds support and rallies to new highs, and the "pattern" turns out to be a consolidation. Even confirmed breaks fail sometimes. This is why stops exist and why no single pattern should ever carry your whole account.
Does the measured target always get hit?
No. The measured move is a projection based on the pattern's height, not a commitment from the market. Many completed patterns reach their targets, many fall short, and some overshoot dramatically. Use it to size up reward against risk, then manage the trade based on what price actually does.
Once you can read a head and shoulders peak by peak, the next skill is seeing it form across timeframes: a right shoulder on the daily chart that is itself a full topping structure on the hourly. That is where structure reading starts to compound, and it is where we go next.