Top-Down Fundamental Analysis
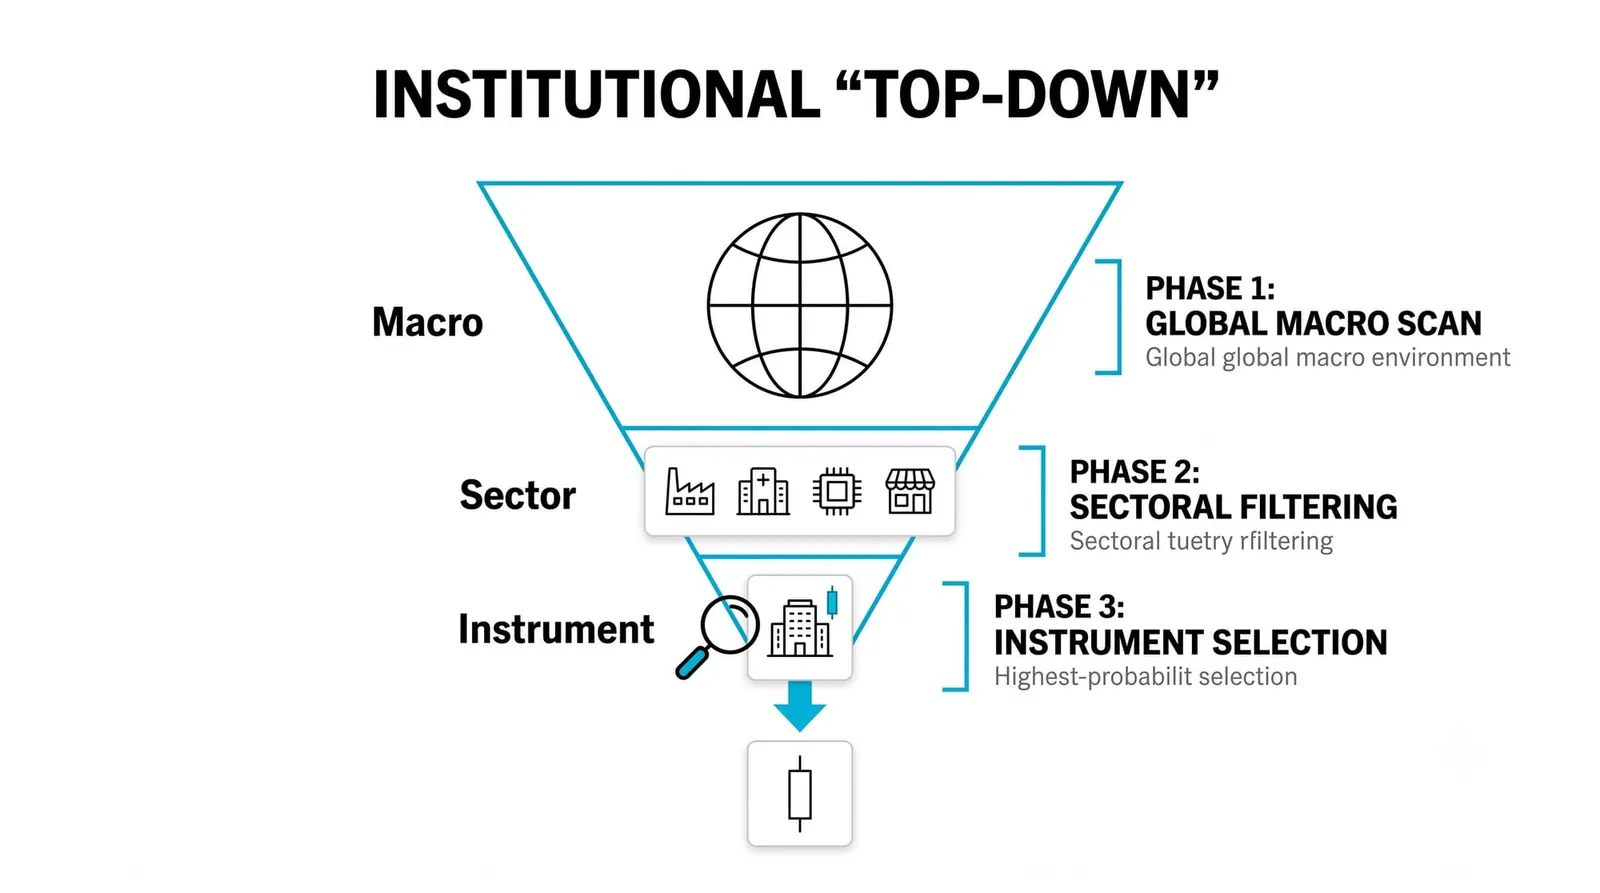
Top-down fundamental analysis starts from the widest picture, the global economy, and narrows step by step to a region, a sector, and finally one asset. The biggest forces choose the neighborhood first. Only then do you pick the house.

Top-down works like finding one line in a library: you pick the building, then the shelf, then the book, then the line. Each layer filters the one below it. If the building is wrong, the book search never happens. That ordering is the discipline, and it protects you from falling in love with a company sitting in a shrinking industry inside a weakening economy.
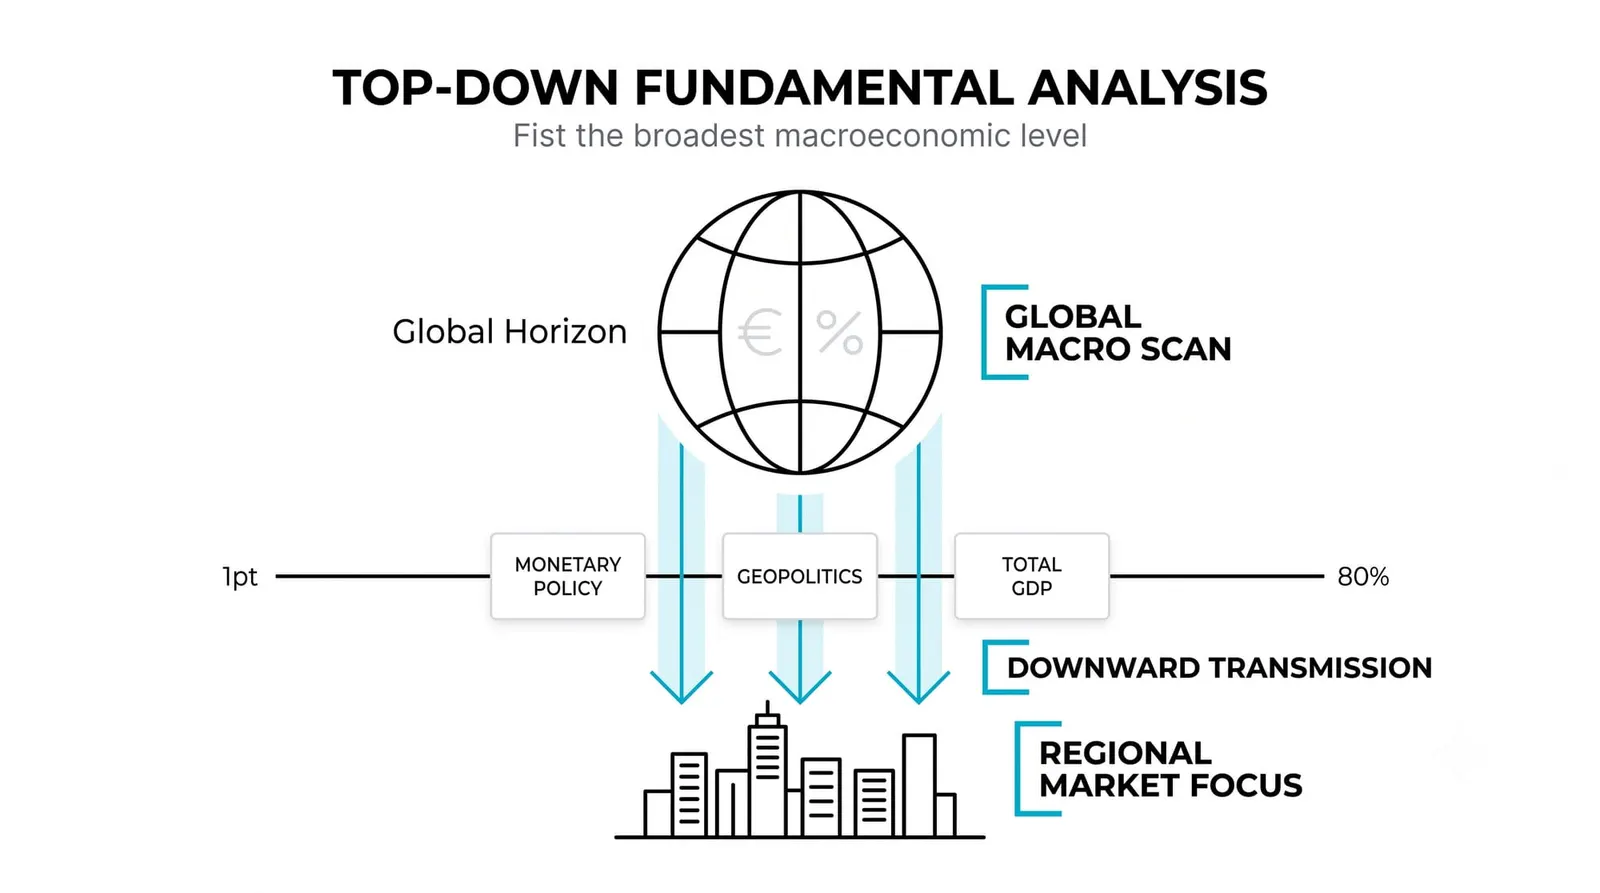
The mirror image of this method is bottom-up analysis, which starts with the single asset and widens outward. It gets its own lesson in this series. For now, hold one idea: the two are the same walk in opposite directions, and skilled traders eventually learn to walk both.
Narrowing In: From Economy to Sector
The first layer is the economy itself. Three forces dominate it: interest rates, growth, and the direction of inflation. Rates set the price of money. Growth tells you whether activity is expanding or contracting. Inflation's direction shapes what central banks will do next, which feeds straight back into rates.
You do not need to forecast these forces. You need to read them. A central bank holding rates high is a fact. An economy whose output has contracted for two straight quarters is a fact. Your job at this layer is to describe the weather accurately, not to predict next season.
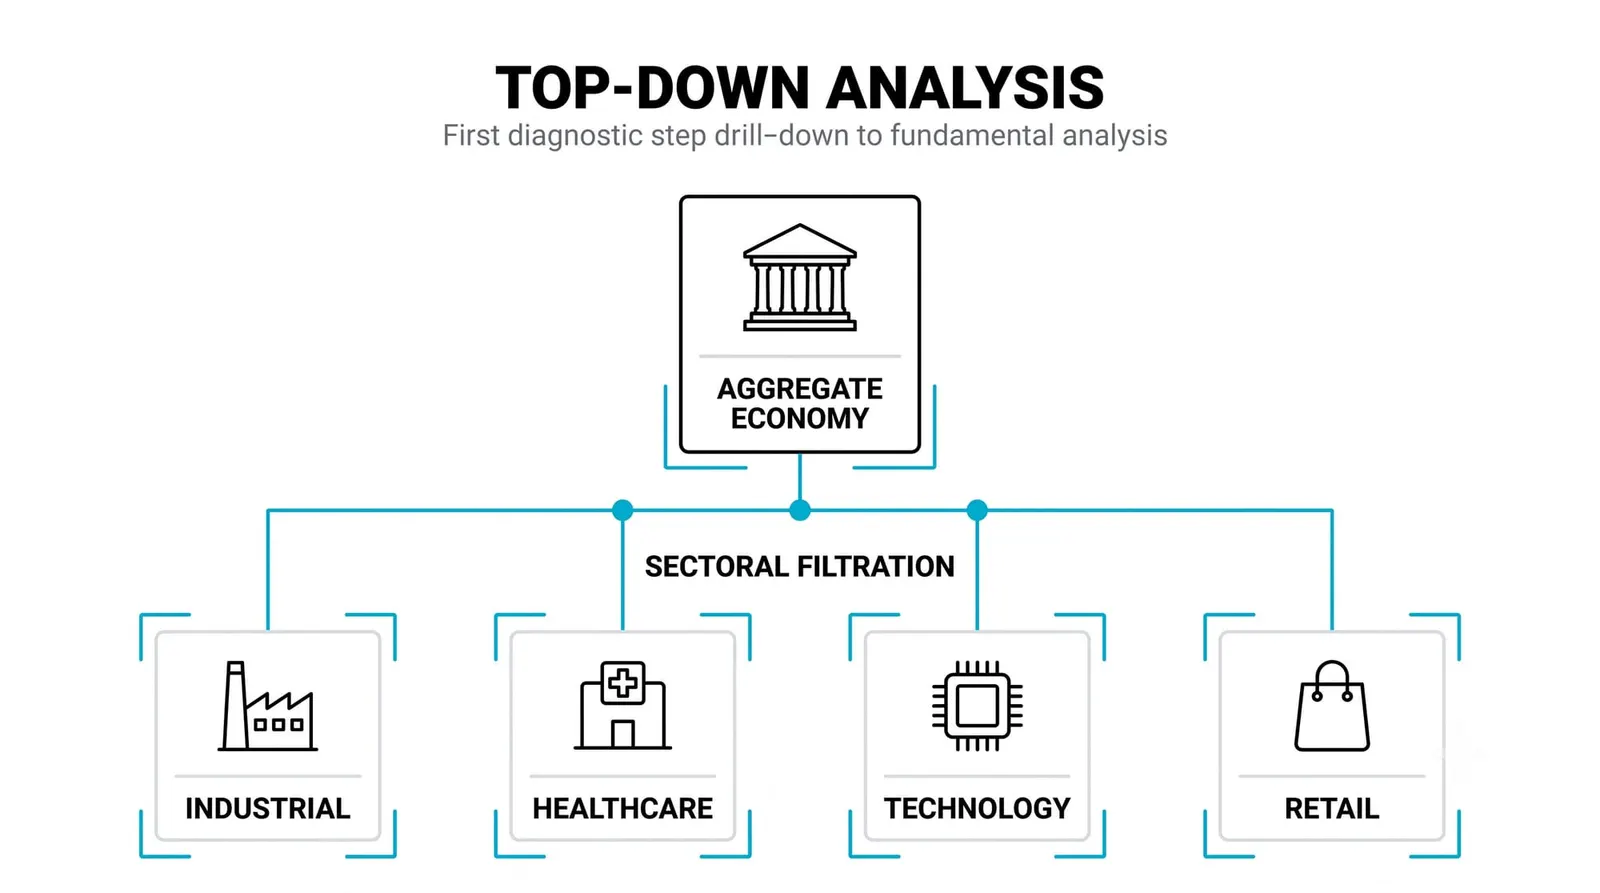
Once the macro picture is clear, the second layer asks a sharper question: which industries benefit from this environment, and which suffer? The mapping is more mechanical than most beginners expect.
- Rising or persistently high rates squeeze borrowing-heavy sectors. Homebuilders, property developers, and companies that roll large debts feel it first, because their costs rise directly with the rate.
- Strong growth lifts cyclical sectors. Industrials, consumer discretionary, and travel tend to expand when households and businesses spend freely.
- Weak growth favors defensive sectors. Utilities, staples, and healthcare keep selling regardless of the cycle, so money rotates toward them when the outlook darkens.
- Falling inflation with steady growth often helps rate-sensitive sectors recover, because the market starts pricing cheaper money ahead.
None of this is a law. It is a tendency with a mechanism behind it, and the mechanism is what you should memorize. Rates move borrowing costs. Borrowing costs move profits in debt-heavy industries. Profits move prices.
Narrowing Further: From Sector to Asset
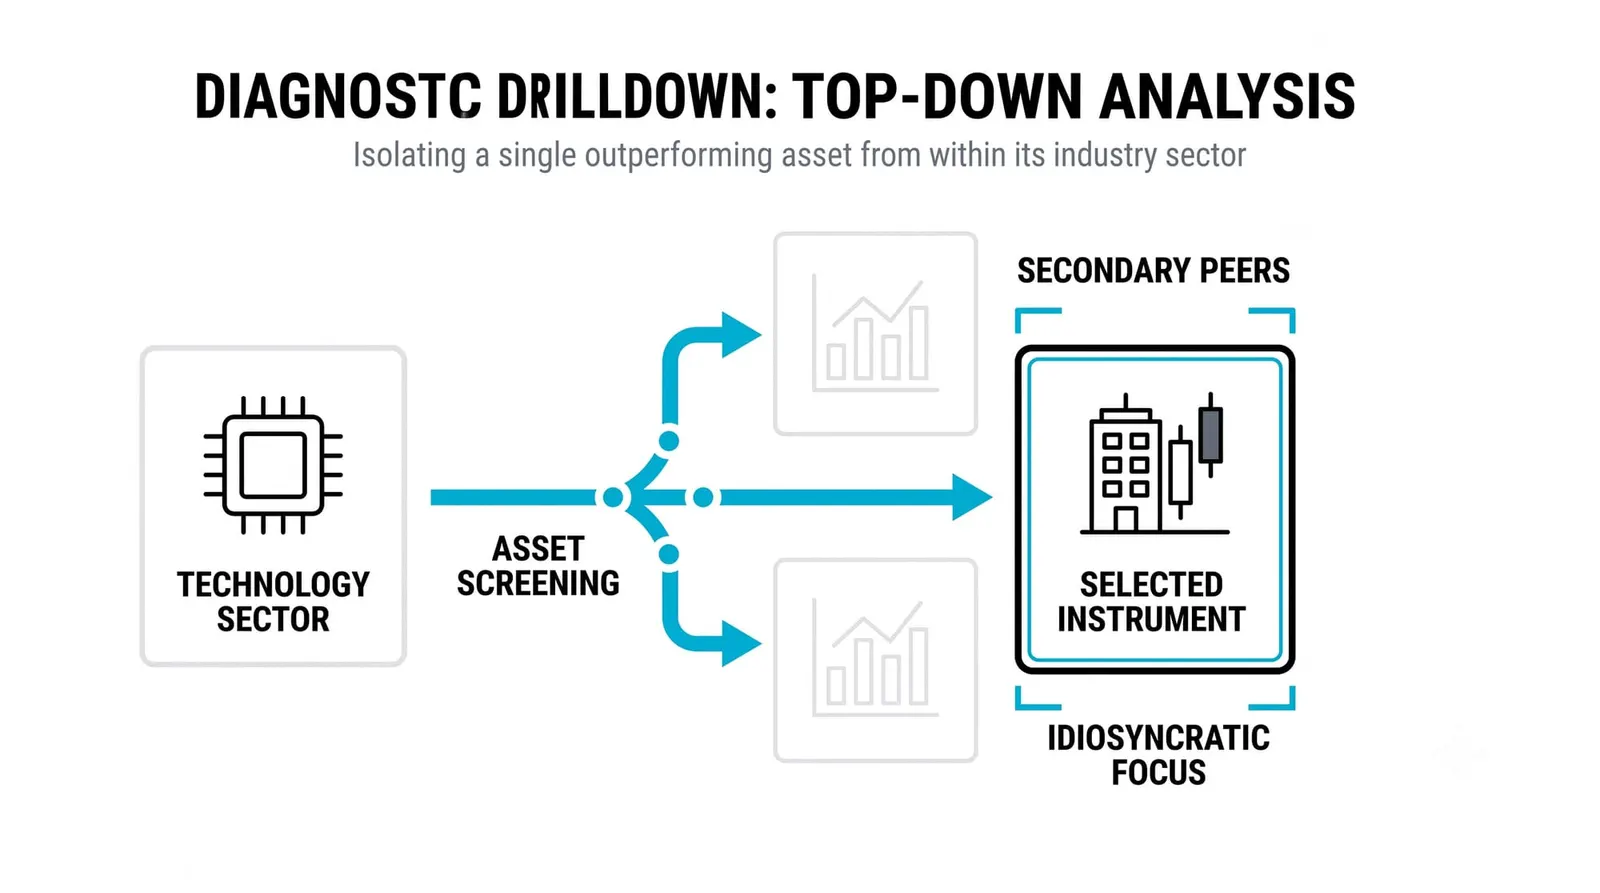
A favorable sector verdict does not make every company inside it a buy. Inside the favored or condemned sector, the asset still has to earn its place.
Three checks do most of the work at this layer. First, the balance sheet: how much debt the company carries, when it comes due, and at what rate. Second, market position: whether the company leads its niche, holds pricing power, or survives on thin margins at the mercy of competitors. Third, management: whether leadership has a track record of allocating capital sensibly through both good and bad cycles.
Two companies can sit in the same condemned sector and face opposite fates. One carries heavy short-term debt and gets crushed by high rates. The other refinanced early, locked in cheap money, and buys market share while its rival struggles. The macro verdict sorted the neighborhood. The asset-level work decides the specific trade.
Skipping this layer is the most common top-down mistake. Traders get the economy right, get the sector right, and then buy the weakest name in the group because the story felt finished. The story is never finished until the balance sheet agrees.
Why Traders Favor This Direction for Big Markets
Some instruments live at the top layers by construction. An index is a slice of the whole economy. A currency pair is a direct comparison of two economies' rates, growth, and policy. A commodity reflects global supply and demand across regions.
When your instrument is the economy's report card, the global layer effectively is the asset layer. There is no company balance sheet underneath a currency. There is no management team behind an index. The macro forces you studied at layer one are the fundamentals, full stop.
This is why index traders, currency traders, and anyone trading whole markets tend to work top-down by default. Their economic calendar is their earnings calendar. A rate decision, an inflation print, or an employment report hits their instrument directly, with no company filter in between.
Single-stock traders have the luxury of starting lower in the stack. Traders of entire markets do not. If your chart is a whole economy, the top of the descent is where your analysis begins, and often where it ends.
From One Rate Decision to One Ticker
Here is a hypothetical walk through all three layers, using round invented numbers. Imagine a central bank announces it will hold its benchmark rate at 5 percent for the rest of the year.
Layer one, the economy. Borrowing stays expensive. Mortgages, business loans, and credit lines all remain costly. Spending and expansion plans get deferred across the economy.
Layer two, the sector. Homebuilders are among the most rate-sensitive industries that exist. Expensive mortgages shrink the pool of buyers, and the builders themselves borrow heavily to fund construction. The sector verdict turns negative.
Layer three, the asset. Two builders sit in that sector. Builder A carries 8 billion in floating-rate debt coming due within a year. Builder B refinanced early and locked fixed rates for a decade. The same announcement squeezes Builder A's margins hard while barely touching Builder B. Builder B may even gain share as its rival pulls back.
One announcement sorted an entire market into winners and losers before any chart was opened. The table below summarizes the descent.
| Layer | Question it answers | Evidence you check | Who trades mostly at this layer |
|---|---|---|---|
| The economy | Is the environment helping or hurting? | Rate policy, growth readings, inflation direction | Currency and index traders |
| The sector | Which industries does this environment favor? | Rate sensitivity, cyclical versus defensive demand | Sector fund and rotation traders |
| The asset | Does this specific name earn a place? | Balance sheet, market position, management record | Single-stock traders |
| The full descent | Do all three layers agree? | All of the above, checked in order | Traders combining macro and technical timing |
Top-Down Analysis, Answered
Which layer should a beginner start at?
Start at the economy layer, always. Learn to read rate policy, growth, and inflation direction before you touch sector rotation or company financials, because every lower layer inherits its conditions from the one above.
Can top-down and bottom-up disagree?
Yes, and they often do. A bottom-up scan can flag a genuinely strong company inside a sector the macro picture condemns. When that happens, the disagreement itself is information: it tells you the trade fights the tide, and sizing and timing should reflect that.
Does top-down work for single stocks?
It works, but the macro layers matter less the further down you go. A dominant company with a fortress balance sheet can thrive in a weak economy. Top-down still tells you which way the current runs, even when you find a company that can row against it.
How often does the global picture change?
Slowly at the top, faster at the bottom. Rate regimes and growth trends typically persist for quarters or years, while sector leadership can rotate within months and company news can shift overnight. The higher the layer, the longer its verdict tends to stand.
Once this descent feels natural, the next step is learning to run it in reverse. The bottom-up lesson walks the same three layers from the asset upward, and knowing both directions is what turns a method into a habit.