Sector Rotation: How Money Changes Camps
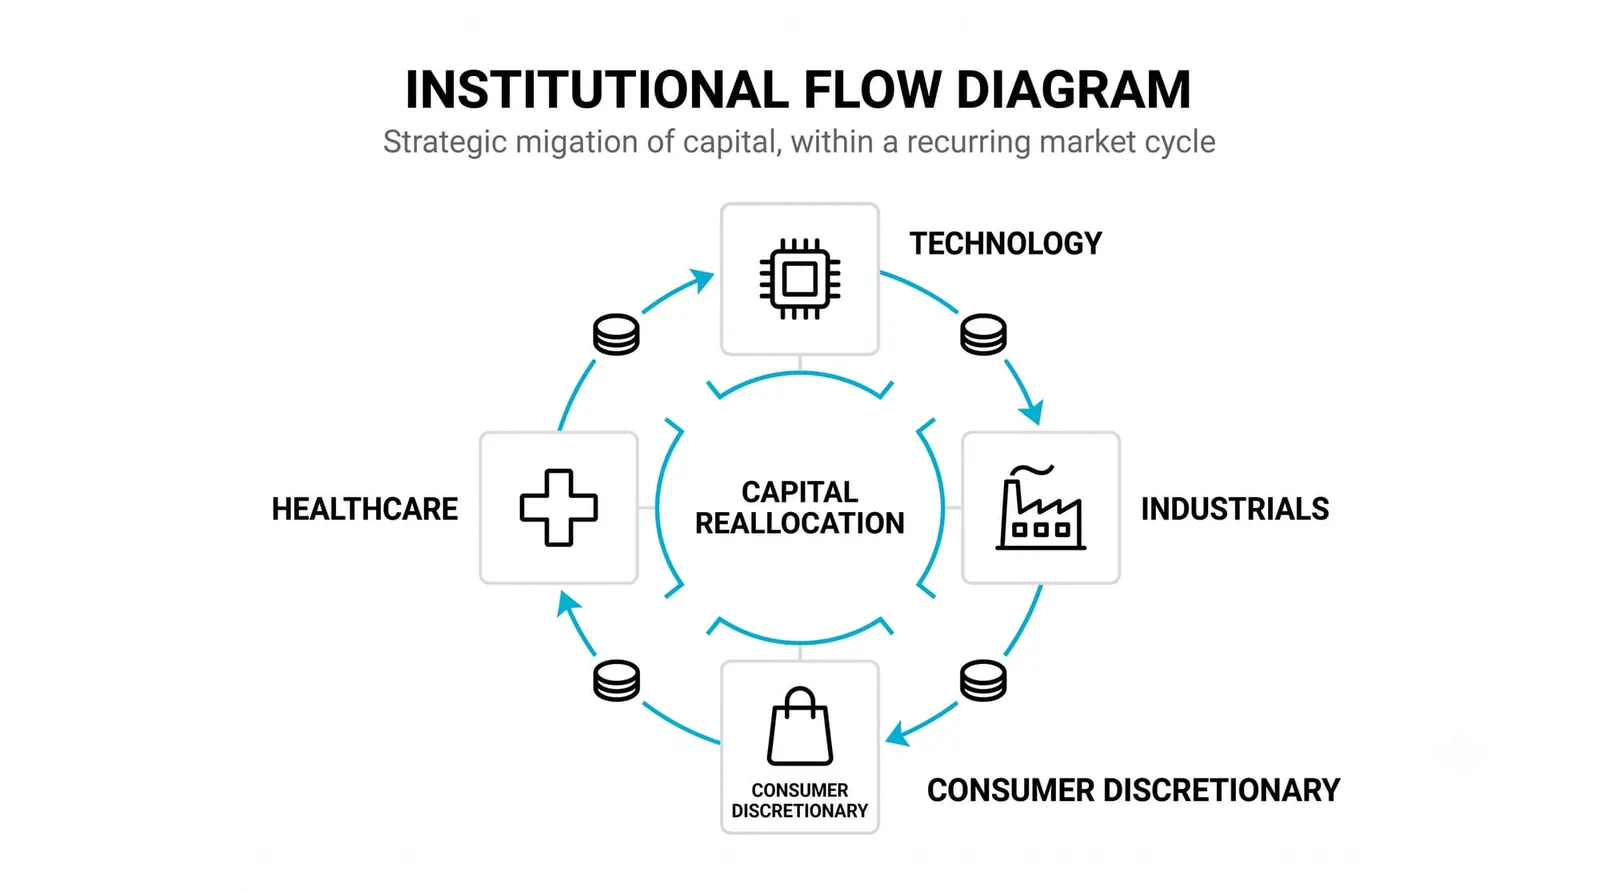
Sector rotation is the movement of investment money between industry groups as the economic cycle changes which businesses are worth owning. Money leaves technology and flows toward energy, then toward banks, then toward defensive names, and back again. The driver is always the same: the cycle and the rate environment shift which earnings streams look attractive, and capital follows.
Capital behaves like a flock of birds. It settles in whichever field is feeding best and lifts off when that field thins. Earlier in this batch you studied sentiment gauges, which measure the crowd's mood; rotation is where that mood becomes actual buying and selling. Earlier in this level you studied the rate cycle; rates are the tide underneath every rotation you will ever see.
What Sector Rotation Actually Is
The market is not one thing. It is a collection of industry groups: technology, energy, financials, health care, consumer staples, consumer discretionary, utilities, industrials, materials, real estate. Each group contains companies whose profits respond to the economy in a similar way.
Analysts sort these groups into loose camps. Growth sectors, like technology, earn most of their value from profits expected far in the future. Value sectors, like banks and energy, earn their keep from cash flows happening now. Defensive sectors, like utilities and staples, sell things people buy in good times and bad. Cyclicals, like industrials and consumer discretionary, rise and fall with the pace of the economy itself.
Rotation is the flow of money between these camps. When investors expect expansion, they buy cyclicals and growth. When they expect contraction, they crowd into defensives. The labels stay fixed; the money does not.
Here is what tricks most beginners: the headline index can sit nearly flat while violent moves happen underneath. If technology falls eight percent while energy rises eight percent, a broad index barely budges. The average hides the migration. Traders who only watch the index see calm water; traders who watch the sectors see the current.
Why Money Moves Between Sectors in the First Place
Earnings power shifts across the cycle, and prices follow earnings. An industrial company sells more equipment when businesses are expanding. A bank earns more when loan demand grows. A utility sells roughly the same electricity either way. So the relative attractiveness of each group changes as the economy moves through its phases, even when nothing about the companies themselves changed.
Rates do separate work on top of this. A growth company's value rests heavily on profits expected years from now, and those distant profits get discounted back to today using interest rates. Higher rates shrink the present value of distant earnings, which hits long-duration growth stocks hardest. Lower rates do the reverse. This is why technology often struggles when rates climb and revives when they fall, regardless of how good the products are.
The third force is raw risk appetite. When investors feel hungry, they reach for upside: small caps, cyclicals, high-growth names. When they feel frightened, they pay up for stability: dividends, steady cash flow, low debt. The same company can be loved in one mood and abandoned in the other.
These three forces stack. A late-cycle environment with high rates and nervous sentiment is hostile to growth stocks on all three counts at once. Rotation is rarely subtle when the forces align.
Matching Sectors to Stages of the Economic Cycle
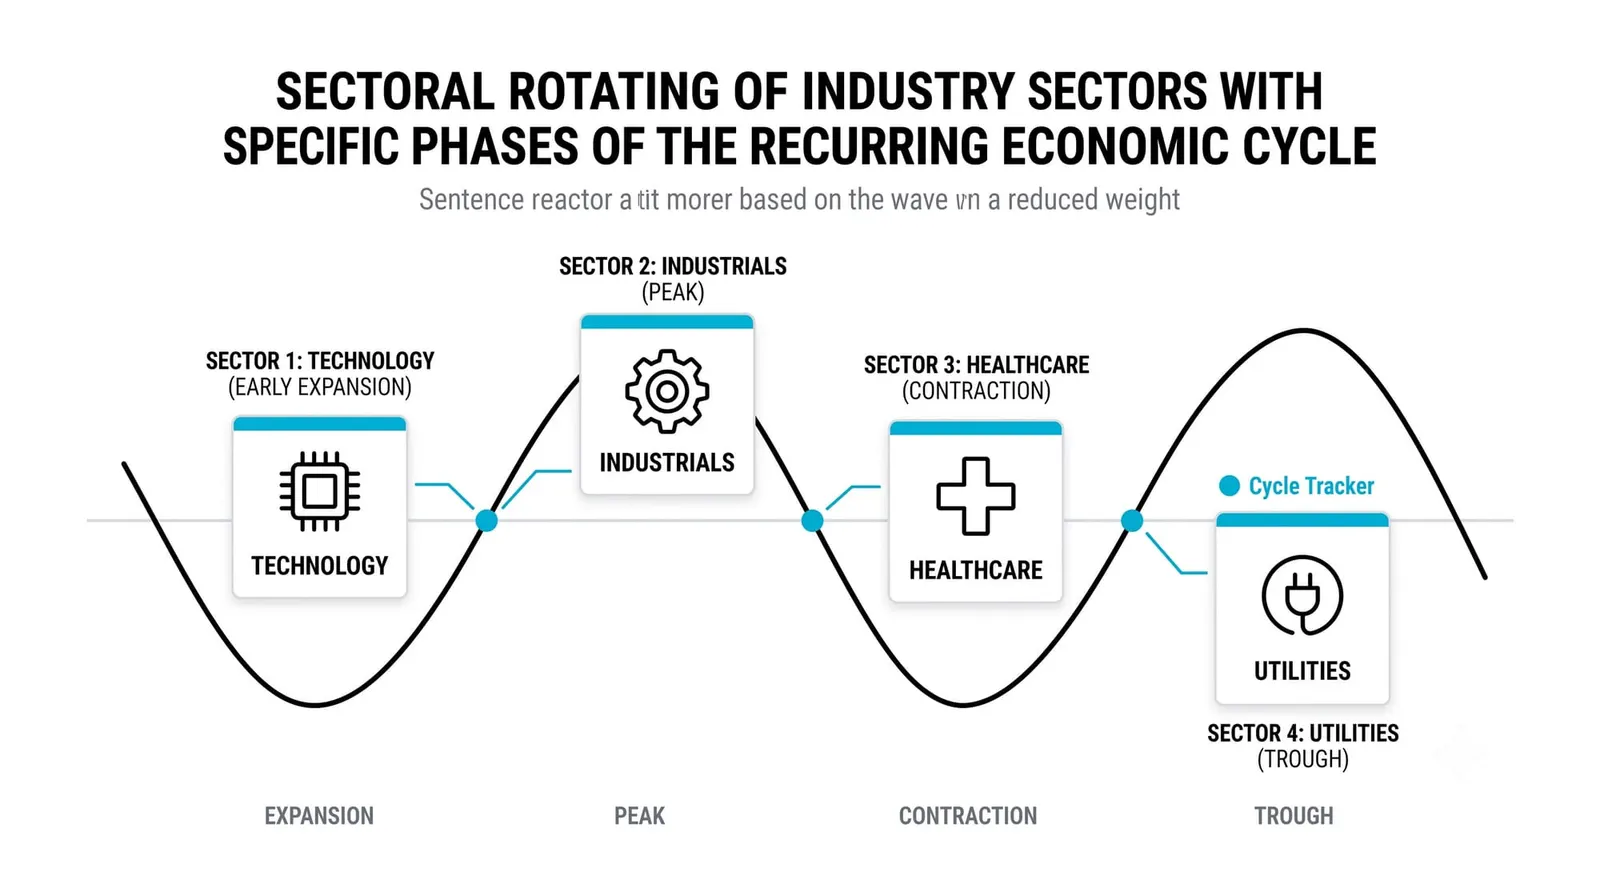
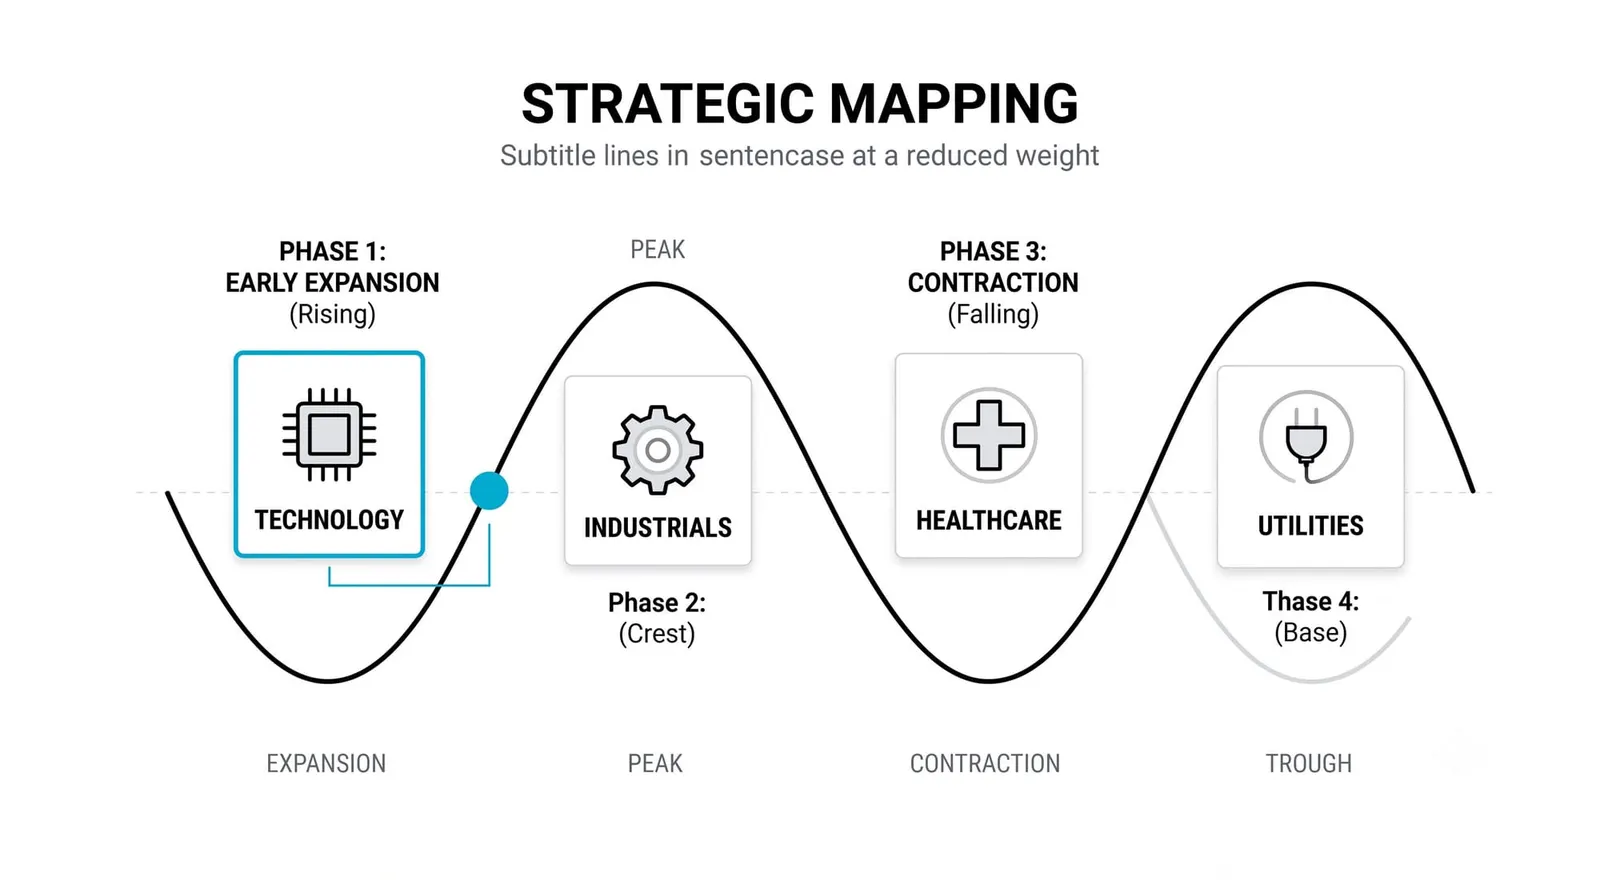
Early cycle is the recovery phase, when rates have fallen and growth is turning up. Rate-sensitive groups lead: housing, banks, consumer discretionary. Cheap credit revives borrowing and big-ticket spending first.
Mid cycle is the broad expansion. Growth is steady, credit is available, and leadership spreads widely. Technology and industrials tend to do well because earnings growth is everywhere and nobody needs to hide.
Late cycle arrives when the economy runs hot and inflation pressures build. Energy and materials benefit because commodity prices climb. Defensives start attracting quiet money as forward-looking investors position for the slowdown they expect.
Recession flips the board. Staples, utilities, and health care hold up best because people keep buying food, power, and medicine. Cyclicals and discretionary names take the damage.
Treat this sequence as a tendency, not a law. Real cycles skip steps, reverse, and overlap. The framework tells you which direction the wind usually blows, not the weather on any given day.
| Cycle Stage | Sectors That Tend to Lead | Why |
|---|---|---|
| Early cycle | Housing, banks, consumer discretionary | Falling rates revive borrowing and big-ticket spending |
| Mid cycle | Technology, industrials | Broad earnings growth rewards expansion-linked profits |
| Late cycle | Energy, materials | Commodity prices rise as the economy runs hot |
| Recession | Staples, utilities, health care | Demand for essentials holds up when everything else falls |
Why Rotation Confirms Rather Than Predicts
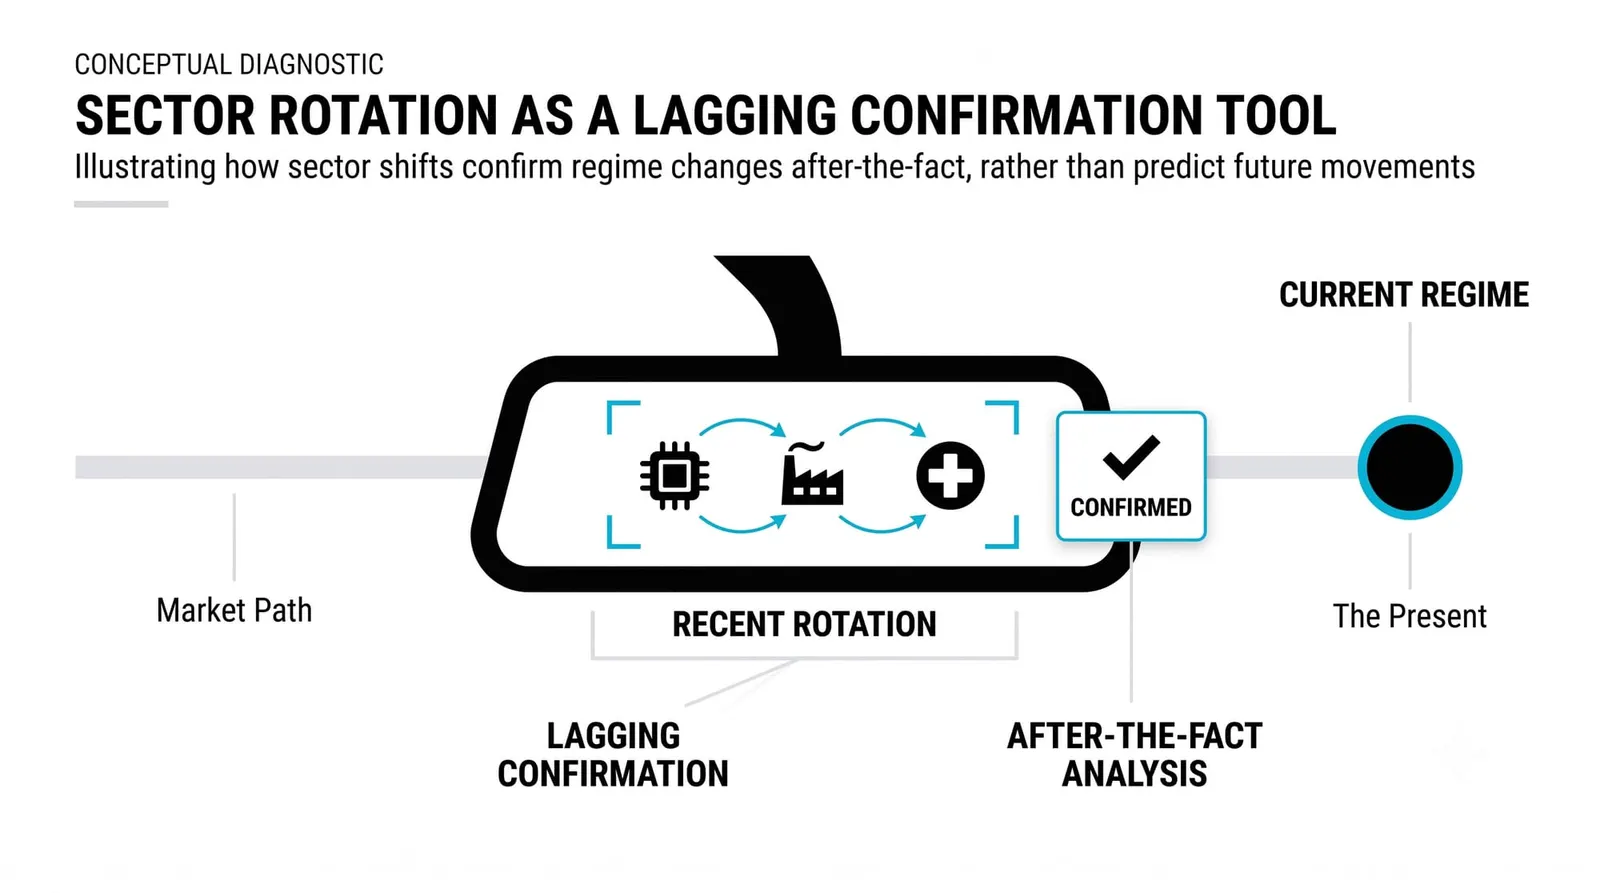
Money flows are only visible after they happen. By the time you can see that energy has outperformed technology for two months, the rotation is already two months old. The data confirms a turn; it cannot announce one in advance.
The same problem applies to the cycle itself. Economists date recessions and recoveries in hindsight, sometimes a year or more after the fact. You never get a clean signal saying "the late cycle began today." You get a fog of mixed indicators, and rotation is one voice in that fog.
So use rotation the way a careful trader uses any confirming evidence. When the sector leadership you observe matches the cycle stage you suspect, your thesis gains weight. When leadership contradicts your read, that is information too. What rotation cannot do is serve as an oracle. Plenty of false rotations last a few weeks and reverse, punishing everyone who chased them.
The blunt version: rotation tells you where money went, not where it will go next.
One Cycle, Four Camps
Imagine a hypothetical fund sitting at what the manager believes is a market peak. The portfolio holds 40 percent in defensives and utilities, 20 percent in growth technology, and the rest spread across cyclicals and cash. The manager's read: the cycle is late, rates are high, and protection matters more than upside.
Now rates peak and begin to fall. Over the next two quarters, the manager reshapes the book. Defensives drop from 40 percent to 15 percent. Housing and bank stocks gain a 25 percent allocation. Growth technology rises from 20 percent to 35 percent.
Read each move as a statement. Cutting defensives says the manager believes the recession risk is fading, so paying up for safety is wasted money. Adding housing and banks says falling rates will revive borrowing and big-ticket demand, the classic early-cycle trade. Lifting technology says lower discount rates will reflate the value of distant earnings.
Every one of those moves is a bet on the same call: the cycle has turned from late to early. That concentration is the point. Rotation is a thesis expressed in sector weights.
Now price the wrong read. Suppose the rate cuts were a head fake, inflation reaccelerates, and the economy tips into recession anyway. The fund now holds 35 percent in growth tech and 25 percent in housing and banks, precisely the groups that suffer most in a downturn, while holding only 15 percent in the defensives that would have cushioned the fall. The wrong rotation costs twice: once in the groups that fall hardest, and again in the protection that was sold away. A manager who rotated more gradually, or waited for confirming evidence, gives up some upside but survives the relapse.
Sector Rotation, Answered
How do you spot sector rotation early?
Watch relative performance, not absolute performance. Compare each sector's returns against the broad index over rolling weeks and months. When one group consistently beats the index while another consistently lags, money is moving. Confirm it with volume and with the macro backdrop: a rotation that fits the rate trend and the data is more trustworthy than one that fights them.
How long does a sector rotation last?
Full cycle-stage rotations typically run for quarters or years, because the underlying economic shift takes that long to play out. Short counter-moves of a few weeks happen constantly and mean little. The durable rotations align with turns in rates and growth; the brief ones are usually just profit-taking inside a larger trend.
Is sector rotation the same as diversification?
No. Diversification means holding across sectors at all times to reduce the damage from any single one. Rotation means deliberately concentrating in the sectors you expect to lead and abandoning the rest. Diversification accepts average outcomes to avoid bad ones; rotation chases better outcomes and accepts the risk of being wrong.
What tools show where money is flowing?
Sector index performance tables, sector fund flow reports, and relative strength charts all do the job. A relative strength chart divides a sector's price by the broad index, so a rising line means the sector is winning the competition for capital. Pair that with the economic calendar you already know, and you can see both the flow and the reason behind it.
You now have the macro picture, the sentiment picture, and the flow picture. The next step is tying them together: reading a week of data releases, sentiment readings, and sector leadership as one coherent story about where the cycle stands. That synthesis is where this level stops being theory and starts being a working process.