Timeframe Confluence for Fibonacci Zones
Timeframe confluence for Fibonacci zones is the overlap of retracement lines from two or more timeframes at one price, the weekly line, the daily line and the old shelf landing in the same few cents, and each additional chart that agrees tightens the zone from a suggestion into a location. One chart's 61.8 percent line is an opinion. Two charts drawing different swings and landing in the same band is evidence.

Think of concentric rings, several circles drawn from different centers that happen to pass through the same point, the point far more interesting than any one circle. The alignment lesson joined two charts at one line. This lesson grades the zones by how many scales agree, the confluence counting its sources and paying by count.
The Count
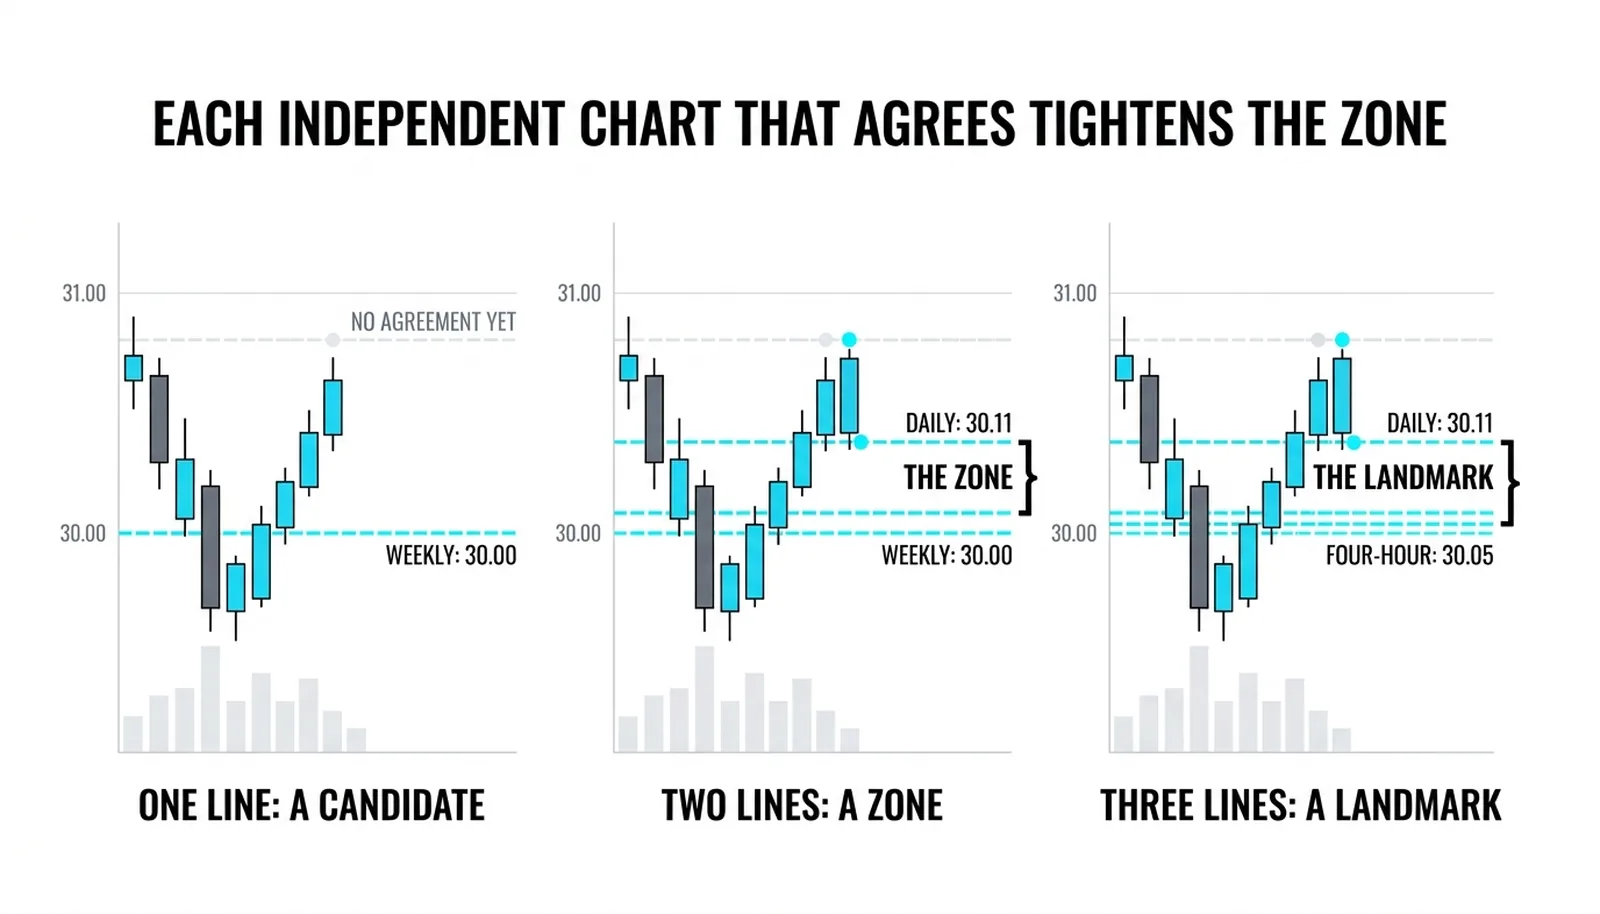
One line is a candidate. A daily 61.8 percent retracement sitting alone is worth a mark on the chart and nothing more. It tells you where one swing's math lands, and the market ignores single lines every day.
Two lines agreeing make a zone. The daily line inside a few cents of the weekly's 50 percent turns a point into a band, and the band between the two lines is the first real location on the chart. Price can be expected to react somewhere inside it, not at one exact penny.
Three lines agreeing make a landmark. The same band also holding an old weekly shelf, or the 4-hour chart's deepest retracement, gives the zone no cheap side. Buyers and sellers from three different scales all have a reason to act there.
The width rule tightens with the count. A two-chart zone earns its few cents honestly, because two independent swings rarely land closer than that. A three-chart agreement inside twenty cents is rare enough to plan a week around. When three charts agree within a few cents, treat the zone as the most important price on your chart until proven dead.
The rule for the count is strict. Every member of the zone must come from its own chart's own swing, drawn independently. The cluster method counts price relationships from independent measurements the same way, the cluster's strength read from how many separate calculations landed together.
Independent Sources Only
Confluence counting has a cheap twin. A trader draws a weekly line, a daily line, a 4-hour line, a round number and an old high into one band, and calls it five-way confluence. Five lines from two sources is two pieces of evidence wearing five hats.
The test is simple. Each line must be drawn from a swing that belongs to its own chart, selected on that chart's structure alone, before you ever look at where the other charts landed. A zone built by redrawing one chart's swing until three lines agree has manufactured concentric circles from a single center.
The discipline runs in order. Mark the weekly swing first, from the weekly chart, with the daily chart hidden. Then mark the daily swing on the daily chart, with the weekly lines hidden. Then check where they fell. If they overlap, the overlap means something because neither drawing knew about the other.
The price action canon supplies the ceiling for all of this. Even a three-chart zone is a place where a turn is likely, never a place where one is owed, and the candle at the zone still decides. The count tells you where to watch. It never tells you what price must do.
Trading the Landmark
The entry belongs to the lower chart. The weekly and daily lines built the zone, but the trigger comes from the 4-hour or hourly candle that reacts inside it. You are paying for proof of reaction, not for the privilege of being early.
The stop belongs to the highest chart in the count. If the weekly line anchors the zone, the stop goes below the weekly line, below the whole structure, not below the tightest line in the band. A stop tucked under the daily line inside a weekly zone dies to noise that the weekly chart would call nothing.
The death of the zone is shared. A close below the lowest line in the band kills the zone on every timeframe at once, because the close has violated the weekly line, the daily line and the shelf in one move. There is no partial failure to manage. The count that built the zone unwinds in a single candle.
That shared death is the trade's honesty. Three charts agreeing raised the odds of a reaction. The reaction still belonged to the market, and the counting only located the trade.
The Zone at 30.00
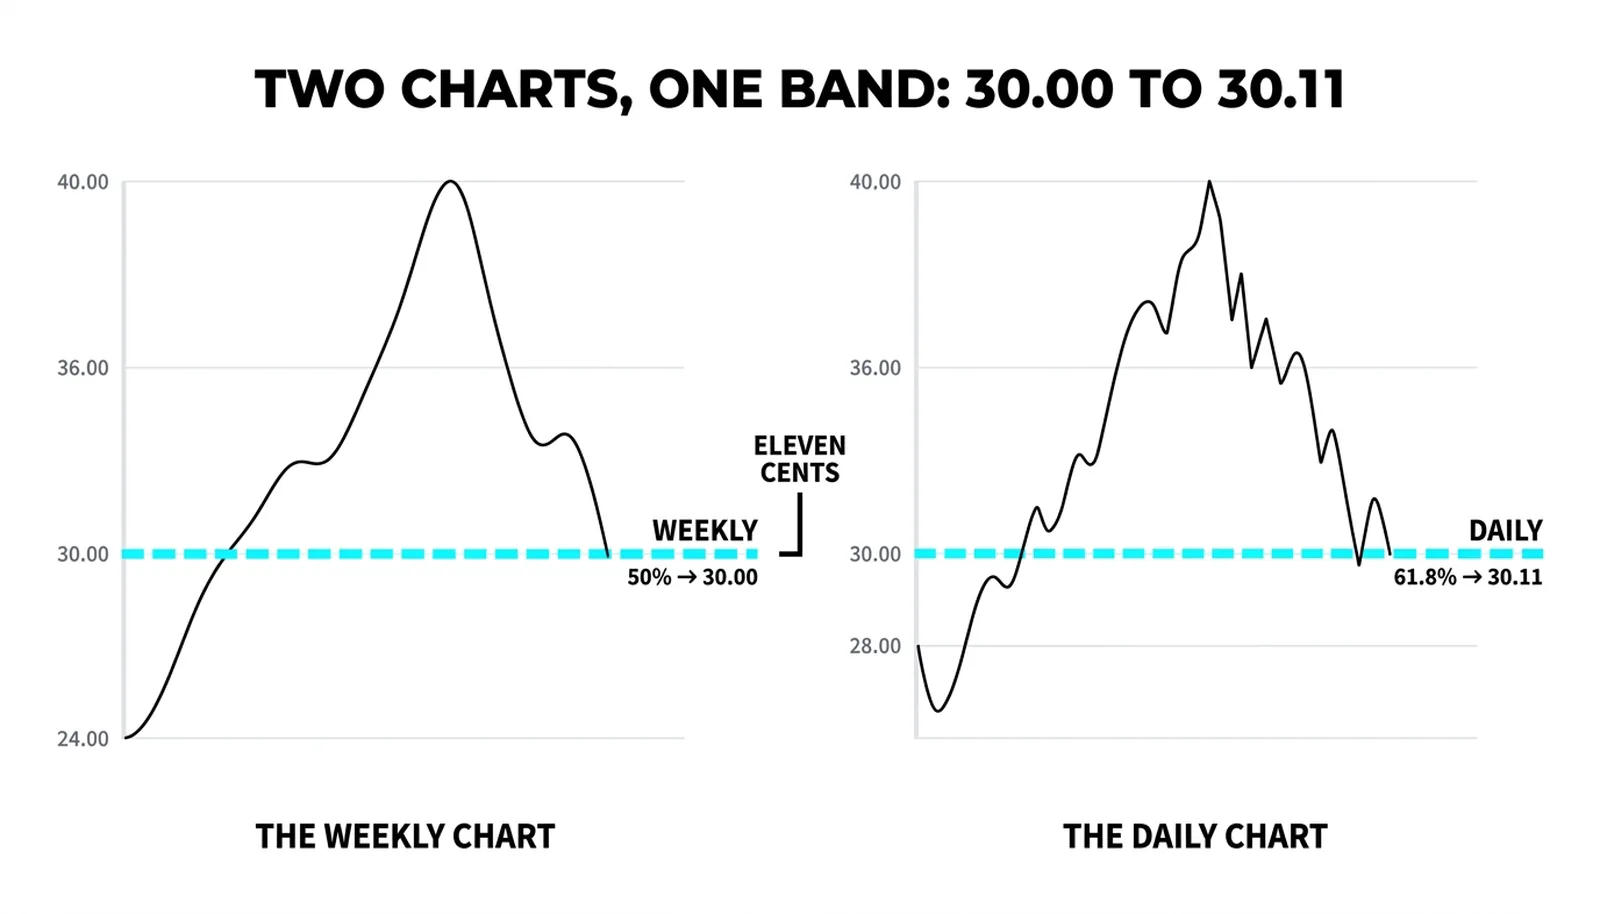
A hypothetical example with round numbers. The weekly swing runs 20.00 points, from 20.00 up to 40.00, and its 50 percent retracement line sits at 30.00. The daily swing runs 16.00 points, from 24.00 up to 40.00, and its 61.8 percent line sits at 30.11.
The two lines overlap in a zone from 30.00 to 30.11, eleven cents wide, built from two independent swings on two independent charts. That is a two-chart zone, and it earns a plan.
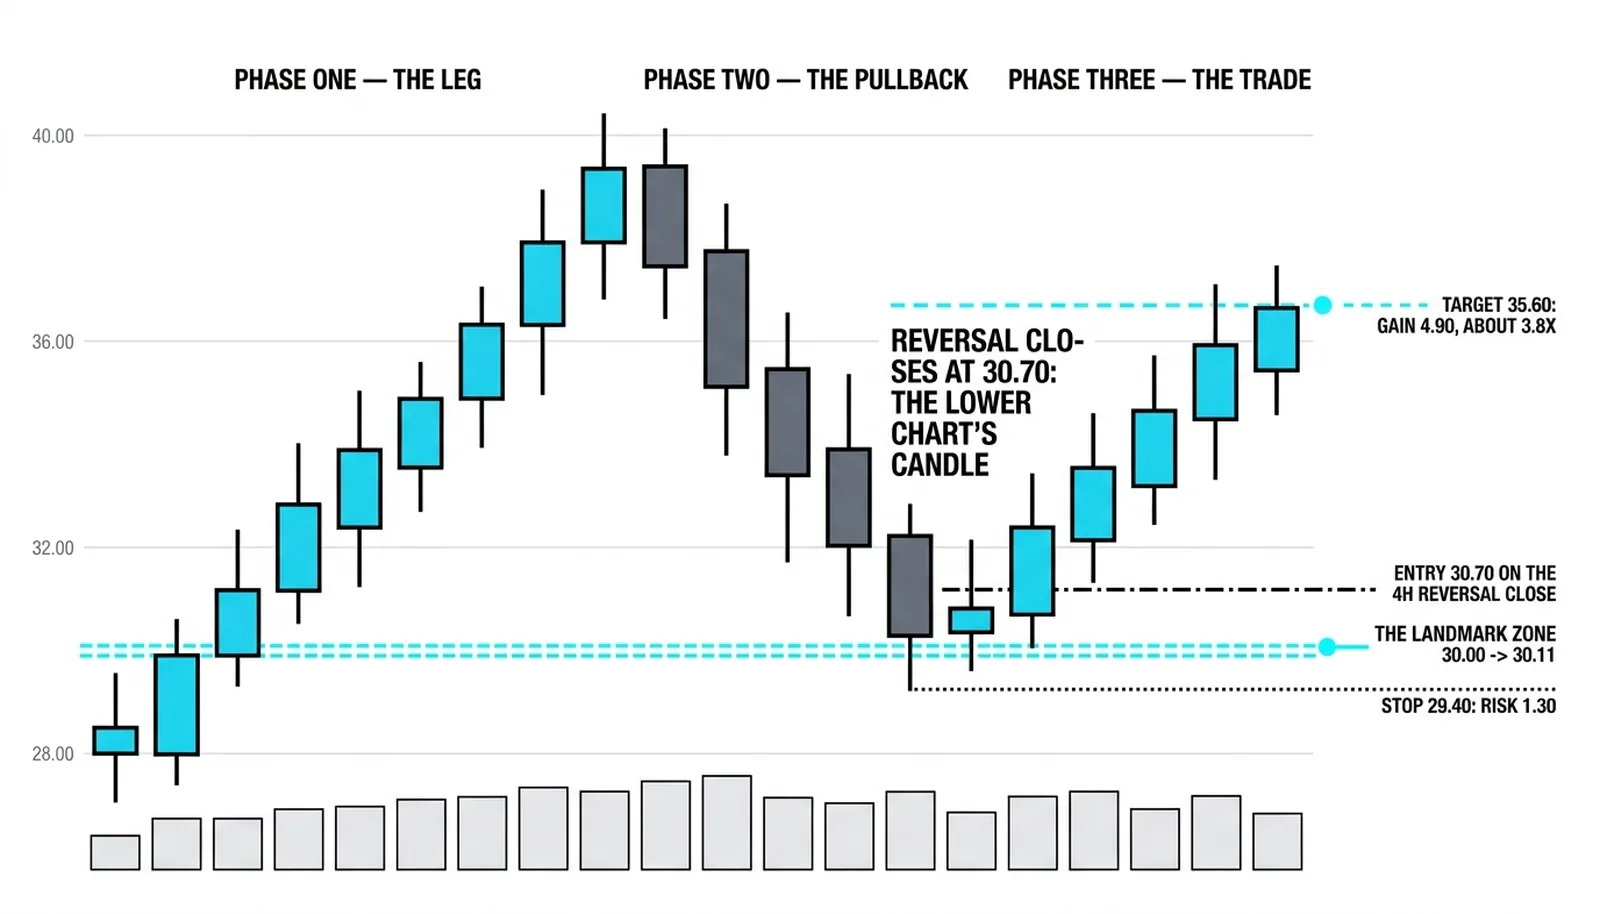
Price pulls back to 30.20, just above the zone. The 4-hour chart prints a reversal candle that closes at 30.70. The long is taken at 30.70 on that close. The stop sits at 29.40, below the weekly line at 30.00 with room for the line to be tested and held, risking 1.30 per share.
The first target is 35.60, the prior swing area on the daily chart, a gain of 4.90. That is about 3.8 times the risk. The zone did not produce the reward. The zone produced the location where a small, defined risk could be placed against a much larger open distance.
The failed version is just as clean. Price closes at 29.20, below both lines. The zone is dead on both timeframes in one candle. The counting did not save the trade, and it was never supposed to. It located the trade, defined the risk, and defined the exact price that proves the idea wrong.
| Chart | Line | Price | What the Count Adds |
|---|---|---|---|
| Weekly | 50% retracement of 20.00 to 40.00 | 30.00 | The anchor; sets the stop location |
| Daily | 61.8% retracement of 24.00 to 40.00 | 30.11 | Second source; turns the line into a zone |
| 4-hour | Reversal candle close | 30.70 | The trigger; proof of reaction inside the band |
| Any chart | Failure close | 29.20 | Kills the zone on every timeframe at once |
Zone Questions, Answered
What is timeframe confluence?
Timeframe confluence is the overlap of levels drawn independently on two or more timeframes at the same price. The weekly retracement and the daily retracement landing in the same few cents, each drawn from its own chart's own swing, is confluence. Lines copied or nudged to agree are not.
How many timeframes make a strong zone?
Two independent charts make a working zone, and three make a landmark. One line is only a candidate. Past three charts the additions matter less than the independence of the sources, and five lines drawn from two real swings are still only two pieces of evidence.
How close do the lines need to be?
Close enough to share one reaction. A two-chart zone earns a band of a few cents honestly, and a three-chart agreement within twenty cents is rare enough to plan a week around. Lines a full point apart are two separate levels, not one zone, and trading them as one zone fakes the count.
Does a three-chart zone guarantee a bounce?
No. A three-chart zone is a place where a reaction is likely, never a place where one is owed. The candle at the zone still decides the trade, and a close below the whole band kills the zone on every timeframe in one move, which is exactly why the stop sits below the highest chart's line.
The next lesson takes the same counting habit into volume, where the zones stop being drawn lines and start being prices the market actually traded, and the sources stop being swings and start being shares.