Switching Timeframes Without Losing Levels
Switching timeframes without losing levels is the working discipline that keeps the ratio work straight across charts: one swing set drawn per timeframe, never redrawn on another, prices carried between charts as a written list, and the entry chart trusted to time what the higher charts already located. The daily chart finds the zone. The smaller chart times the entry into it. Neither does the other's job.

Think of the optometrist's row of trial lenses: each lens is a different prescription for reading the same room, and the room never changes because the glasses did. The market is the room. The timeframes are the lenses. A trader who swaps lenses mid-read and then insists the furniture moved has made the classic error, and it costs real money.
The earlier lesson in this block graded the zones by confluence, stacking reasons why one area matters more than another. This lesson is the craft underneath that work: the habits that keep the levels straight while the trader moves between charts. Without these habits, the confluence grades dissolve the moment a second chart opens.
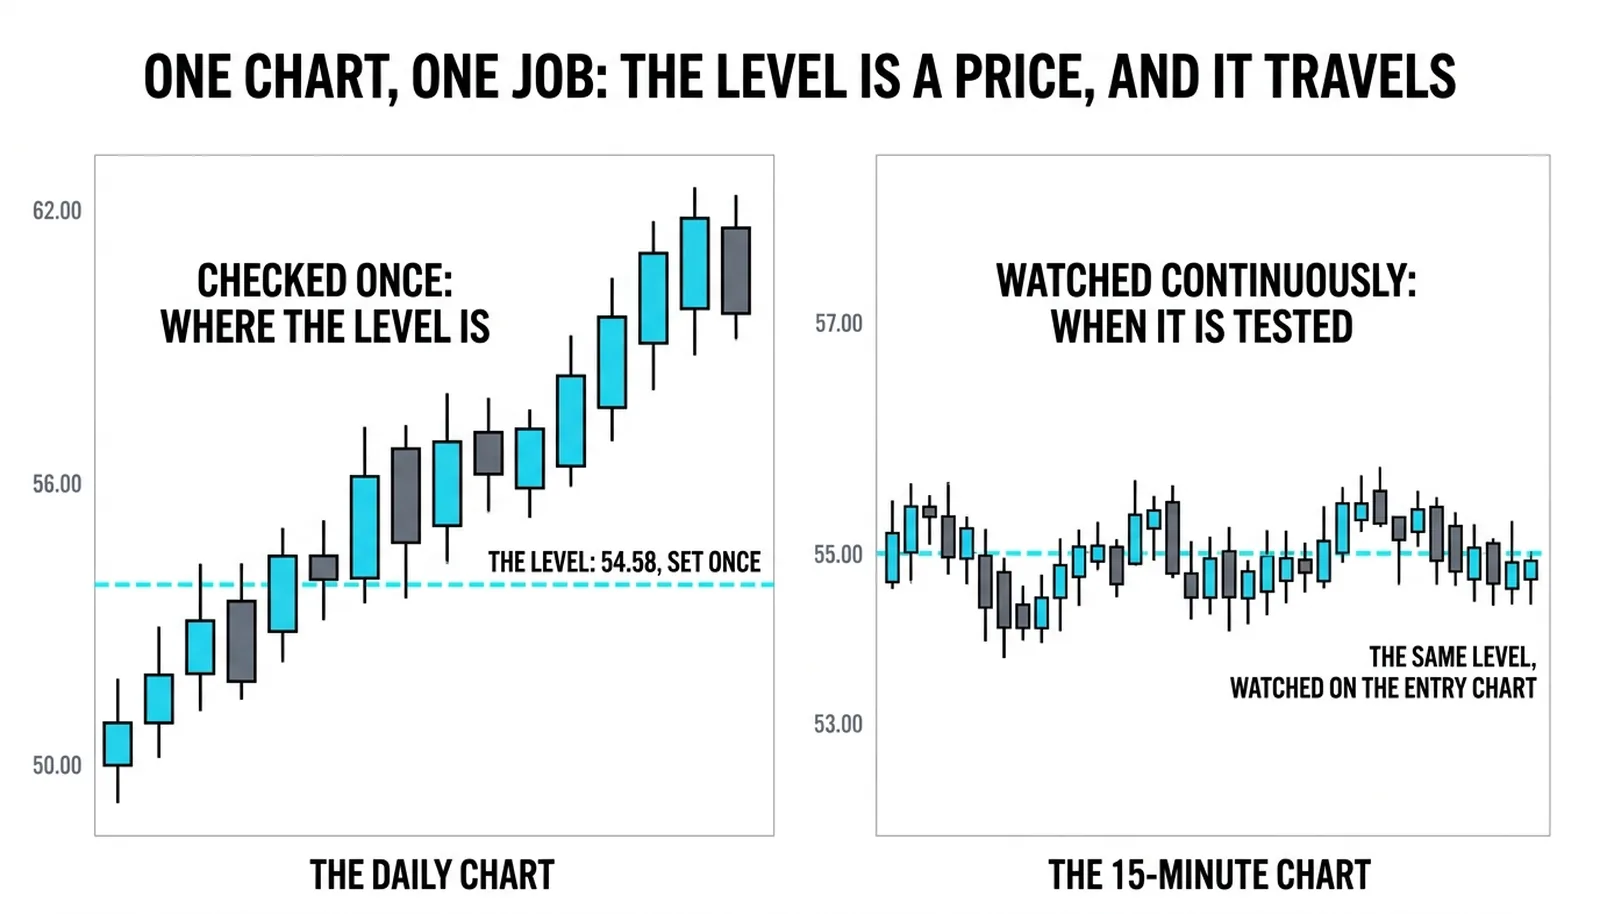
One Chart, One Job
Each timeframe gets exactly one assignment. The bias chart, usually the daily or the four-hour, is checked once per session to set direction and mark the zones. The entry chart, the 15-minute or the 5-minute, is watched for the trigger inside those zones. That is the division of labor.
The no-swapping rule is what makes it work. Once the trade is live, the bias chart does not get re-consulted for excuses to exit, and the entry chart does not get promoted into a source of new levels. The two charts answer different questions, and letting one answer the other's question is how a sound plan turns into improvisation.
Fibonacci cluster practice keeps the larger structure fixed while the smaller chart handles timing: the levels are set first, and the intraday chart is consulted second, only for the entry trigger. The order matters. Levels first, timing second, never the reverse.
A trader who checks the daily chart after entry is usually not checking. The trader is shopping for a reason to leave.
The List of Prices
A level is a price, and a price does not need its original chart open to be respected. This is the second rule, and it is the one most traders skip. The swing set drawn on the daily chart stays on the daily chart. What travels between charts is the list: the numbers written down, 54.58 and 57.10 and 60.00, kept beside the screen and consulted on every timeframe.
Each chart owns its own swing set. The daily swing is drawn on the daily chart and never re-anchored on the 15-minute, because the 15-minute shows sub-swings the daily never saw. Redrawing the daily swing on a faster chart produces a line that fights the real one, and the trader ends up with two versions of the same level and no way to know which to trust.
The list solves this. When the 15-minute chart approaches a written-down daily price, the trader knows the zone has authority because the daily chart gave it. The smaller chart's job at that moment is narrow: show whether buyers or sellers are responding at the number, then produce the trigger. The original chart keeps the authority. The working chart keeps the watch.
This is also what makes multi-timeframe work portable. A trader can close the daily chart entirely and still trade against its levels all week, because the levels live on the list, not on the screen.
Scale-Hopping, Named
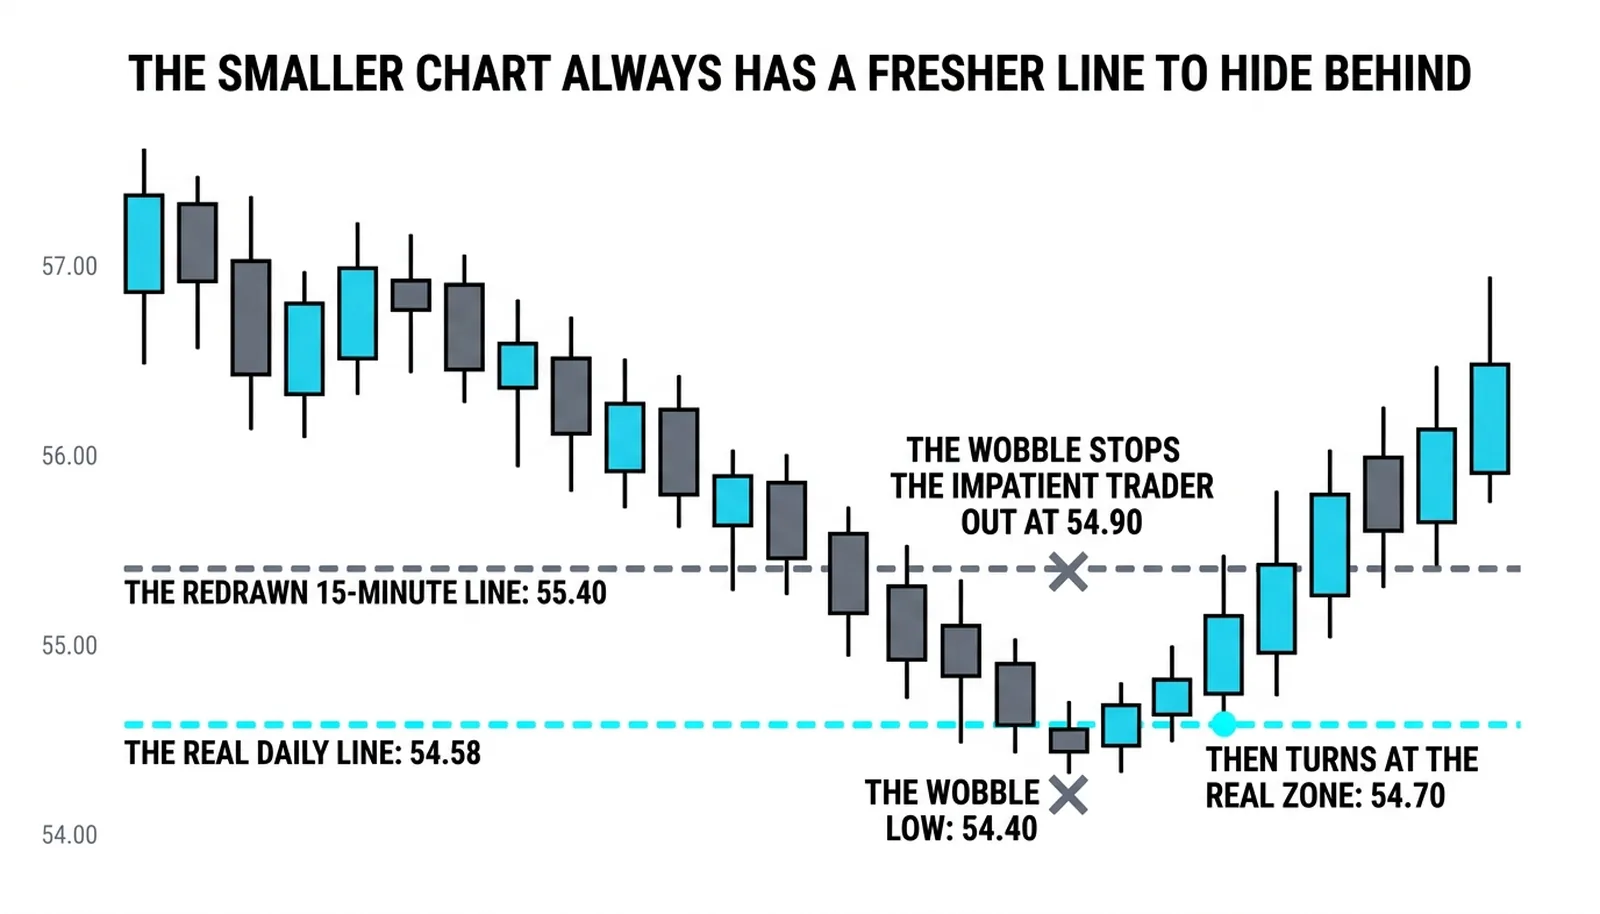
The trap has a name worth giving: scale-hopping. The trader drops to a smaller chart mid-pullback, finds a fresher swing, redraws the level to fit the wobble, and enters against the very zone the plan had located. The new line feels more precise. It is only newer.
The price action canon's reading of the smaller chart is blunt: it always offers a reason to leave early and a fresher line to hide behind. Every pullback looks more finished on a fast chart than it is, because the fast chart magnifies each minor turn into something that resembles a reversal. The trader who believes the magnification acts early, and acts at the wrong price.
The defense is decided in advance, not during the pullback. Before price ever reaches the zone, the trader knows which chart's answer will be believed. If the daily chart owns the level, the daily chart's line is the one that counts, and no 15-minute redraw gets a say. This is not a technique. It is a pre-commitment.
The honesty here deserves plain wording. No rule stops the discomfort of watching a zone test unfold on a fast chart, candle by candle, while the wobble argues for a better entry a few ticks away. The rules only stop the discomfort from redrawing the plan. The discomfort itself is part of the job, and the traders who last are the ones who can sit inside it without touching the lines.
The List Wins at 54.70
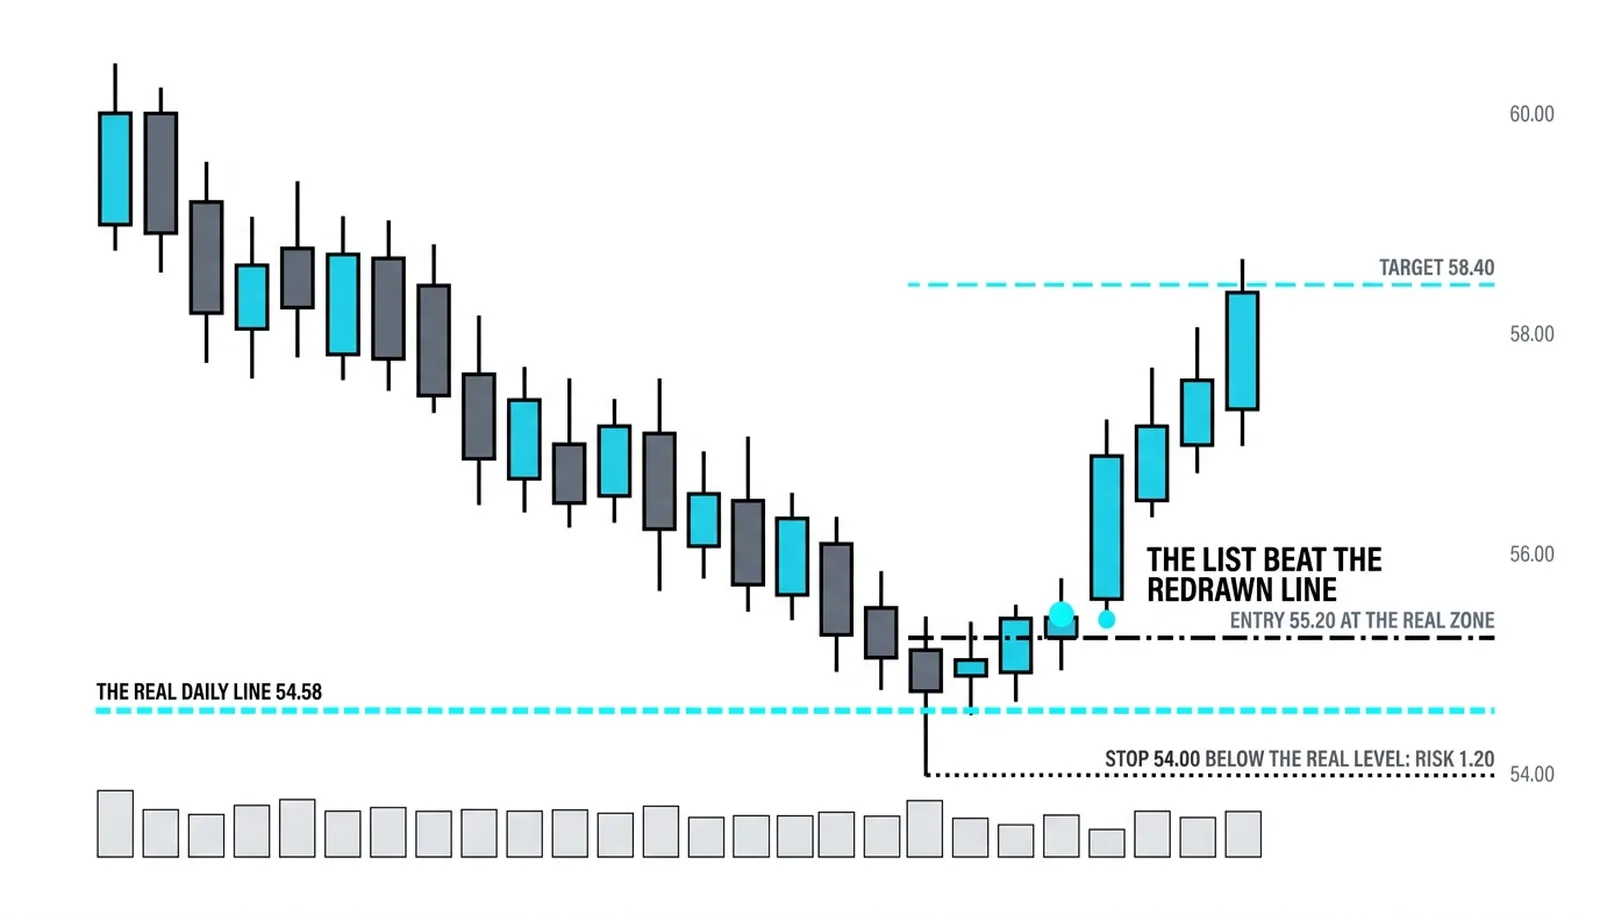
Here is the discipline run as a trade, with invented round numbers. The daily chart from the top-down lesson carries a swing line at 54.58, and it sits on the written list alongside the four-hour resistance at 58.60. Price pulls back toward the zone intraday.
On the 15-minute chart, a fresher swing appears during the decline, and it offers a redrawn line at 55.40. The wobble looks convincing. The list wins the argument anyway: the daily line at 54.58 is the zone, and the entry waits for the real test.
Price reaches 54.70, just above the daily line. The 15-minute chart prints a reversal and closes at 55.20. The long is taken at 55.20 on that close. The stop sits at 54.00, below the daily line, risking 1.20 per share. The first target is 58.60, the four-hour resistance already on the list, a gain of 3.40, about 2.8 times the risk.
The failed version ran an hour earlier. That trader took the 15-minute chart's redrawn line at 55.40, entered at 55.60, and was stopped at 54.90 when the pullback continued to the real zone. The market then turned at 54.70, almost exactly where the daily chart had said it would.
The difference between the two traders was not the analysis. Both saw the same charts and the same swings. The difference was which chart's line was allowed to count, and that decision was made before the pullback began, not during it.
| The Rule | The Chart It Governs | What It Prevents | The Cost of Breaking It |
|---|---|---|---|
| Each chart owns its own swing set | Every timeframe separately | Two competing versions of one level | A redrawn line that fights the real one |
| Prices travel as a written list | All charts, via the list | Losing a level when its chart closes | Trading blind to the higher-timeframe zone |
| The chart matches the job | Bias chart and entry chart | Mid-trade swapping of roles | Improvised exits and late entries |
| The answer is chosen in advance | The chart that owns the level | Scale-hopping during the pullback | Entering early and stopping out at the real zone |
Switching Questions, Answered
How do you switch timeframes without confusion?
Assign each chart one job and carry the levels between charts as a written list of prices. The bias chart is checked once for direction and zones, the entry chart is watched for the trigger, and the two are never swapped mid-trade. Confusion comes from charts doing each other's work, not from the number of charts.
Should Fibonacci levels be redrawn on lower timeframes?
No. A ratio drawn from a daily swing belongs to the daily swing, and re-anchoring it on the 15-minute chart measures a different, smaller move. Write the ratio's prices on the list and consult them on any chart, but keep the drawing itself on the timeframe that produced the swing.
How many timeframes should one trade use?
Two is enough for most trades, three at most: one for bias, one for the entry, and optionally one above the bias chart for context. Beyond that, each added chart adds opinions without adding information, and the opinions arrive at the worst moment, mid-trade.
What is scale-hopping?
Scale-hopping is dropping to a smaller chart mid-pullback, finding a fresher swing, and redrawing the level to fit it. The new line feels more precise and is only newer, and the trader who follows it enters early against the zone the plan had already located.
The next lesson in this block takes the same discipline into the live session: building the pre-market routine that fills the list before the open, so the numbers are already waiting when the first pullback begins.