Building a Fibonacci Bias from the Top Down
A fibonacci bias is a directional rule tied to a price, and building it from the top down means the highest chart decides which way the trader is allowed to look. The daily trend and its retracement line set a long bias or a short one. Every lower chart is then read only for entries in that one direction. Nothing on the hourly can widen the permission the daily granted, and nothing on the hourly can revoke it.

Think of the keel and the rudder: the keel keeps the boat pointed on its heading, and the rudder steers only within it, because no amount of rudder sails a boat against its own keel. The daily chart is the keel. The intraday charts are the rudder.
The earlier bias lesson built the top-down read in general terms. This lesson pins the bias to a line, the higher chart's retracement, so the direction is a price and not a mood.
The Line That Sets the Heading
Step one is the daily trend. Higher highs and higher lows make the long bias candidate. Lower highs and lower lows make the short one. No trend, no bias, and the method sits out.
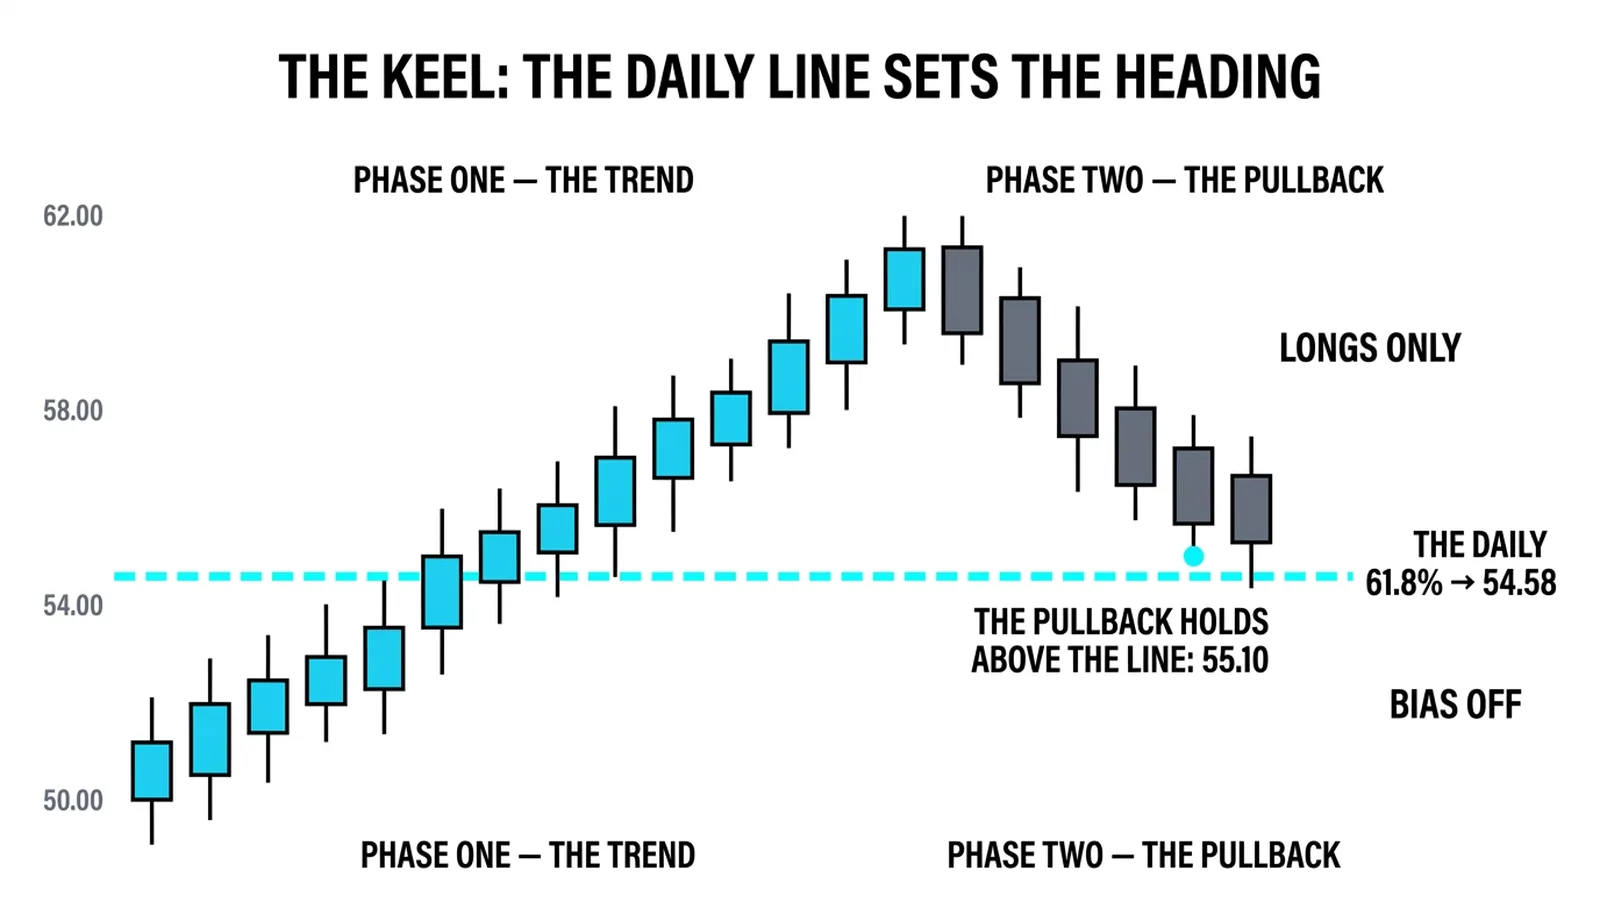
Step two is the bias line. Draw the retracement of the last major daily leg. The line the trend must hold is commonly the 38.2 or 61.8 percent level of that leg. Above the line, longs only. Below it, the bias is off.
The two lines carry different meanings. A pullback that stops at the 38.2 percent line is shallow, and a shallow pullback says the trend is strong and barely pausing. A pullback that reaches the 61.8 percent line is deep, and a deep pullback says the trend is being seriously questioned. Many traders treat the 61.8 as the last stand: held, the trend is owed continuation; lost, the trend's claim is done.
The top-down practice of fibonacci cluster practice fixes the larger structure first for the same reason. The big chart's levels decide which smaller setups deserve orders. The daily line is drawn before any lower chart is opened, and the lower charts inherit the answer.
The tape-reading framework sharpens the rule further. A bias without a price is an opinion, and the market cannot argue with an opinion or obey one. A line at 54.58 can be held, tested and lost. That is what makes it a bias rather than a mood.
The Lower Charts Execute
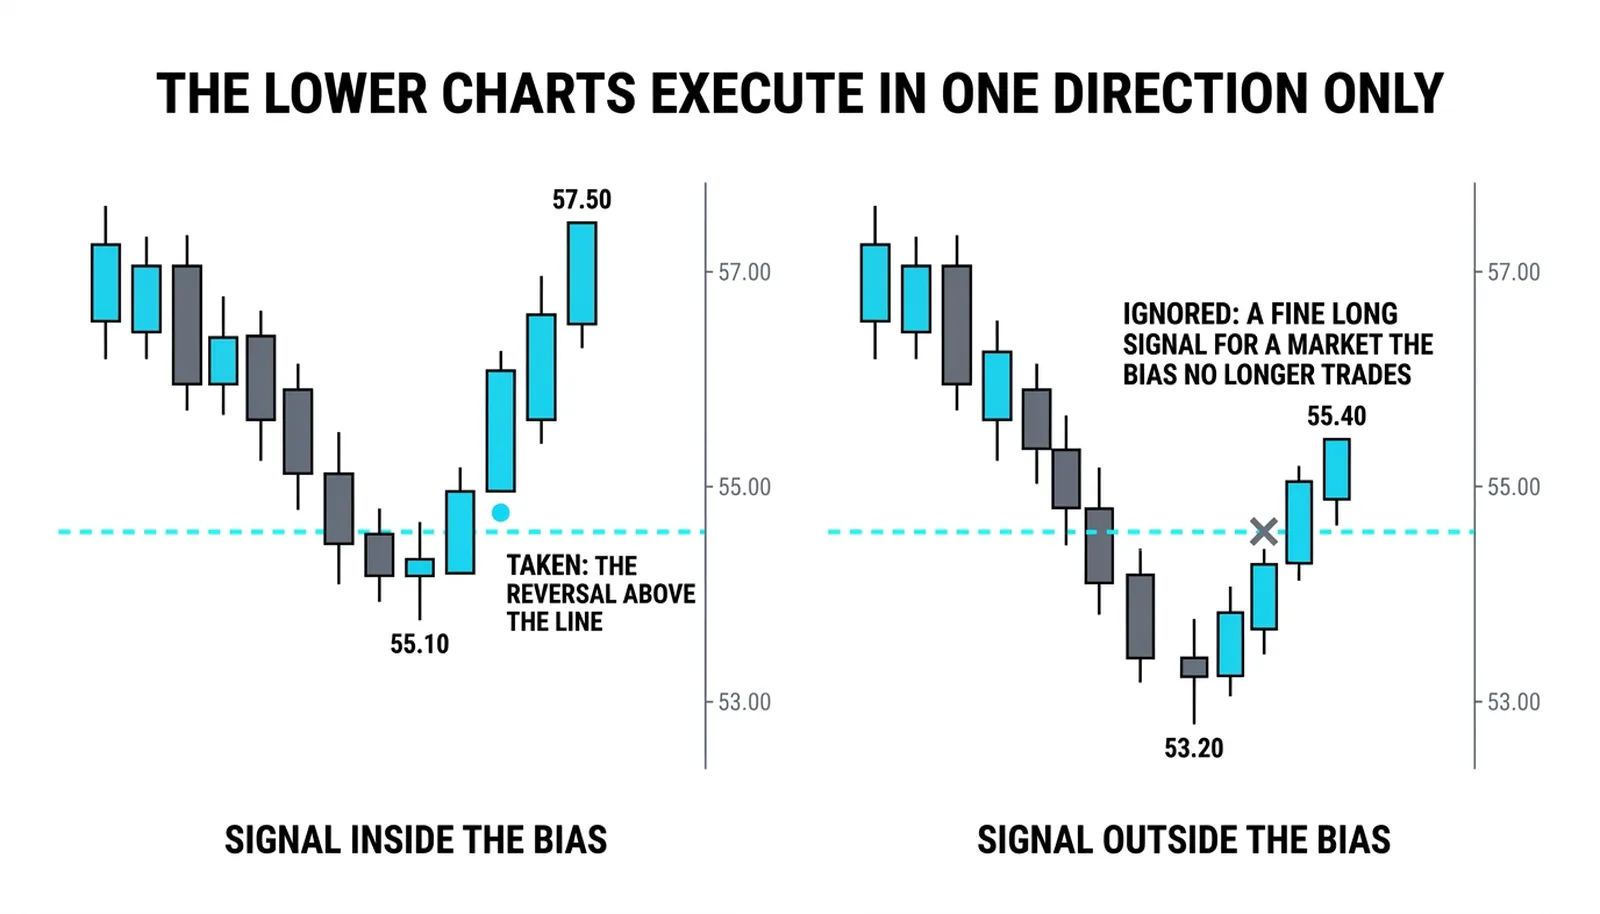
Step three is where most traders break the method. The lower charts execute, and execution means one direction only. A four-hour or hourly reversal at the bias line, or anywhere inside the daily zone above it, is an entry in the bias direction. The same candle shape pointing the other way is not a trade, only noise.
The reversal at the line is the highest-quality version. Price dips to the daily retracement, the four-hour chart prints a rejection, and the trader buys the turn with the line directly beneath the stop. The trade is aligned with the trend, anchored to a level, and wrong by a small, known distance.
The close that ends the book is the other half of the discipline. A daily close through the bias line does not invite a debate. It ends the long book. The next hourly reversal candle, however pretty, belongs to a market the bias no longer trades.
This is the conversion the whole lesson exists for. The bias turns a chart into a rule: price above the daily 61.8 percent line means the pullback is shallow enough and the trend is owed continuation; a close below it means the pullback is deep enough to question the trend, and the long book closes.
Trading the Bias
The trade itself is plain. Entry goes on above the line, on the lower chart's reversal. The stop goes below the line, because the line is the reason for the trade and a break of it is the proof of being wrong. The target sits at the prior high or the next daily level, whatever the higher chart offers first.
The honesty has to be stated plainly. The bias line will be closed through on the day the trend actually ends, and the last long of the trend always dies at it. That loss is not a flaw in the method but its cost, paid once per trend.
The bias earns that cost back by refusing every counter-trend trade before it. All the rallies that failed, all the dips that kept falling in a downtrend, all the shorts sold into a rising market: the rule blocked each one. One final losing long is cheap against that record.
What the trader gives up is the feeling of catching the exact top. The method never sells the high, because the bias stays long until the line breaks, and the line always breaks some distance below the high. Traders who cannot tolerate giving that distance back will keep overriding the rule, and overriding the rule is the failure mode itself.
The Bias Line at 54.58
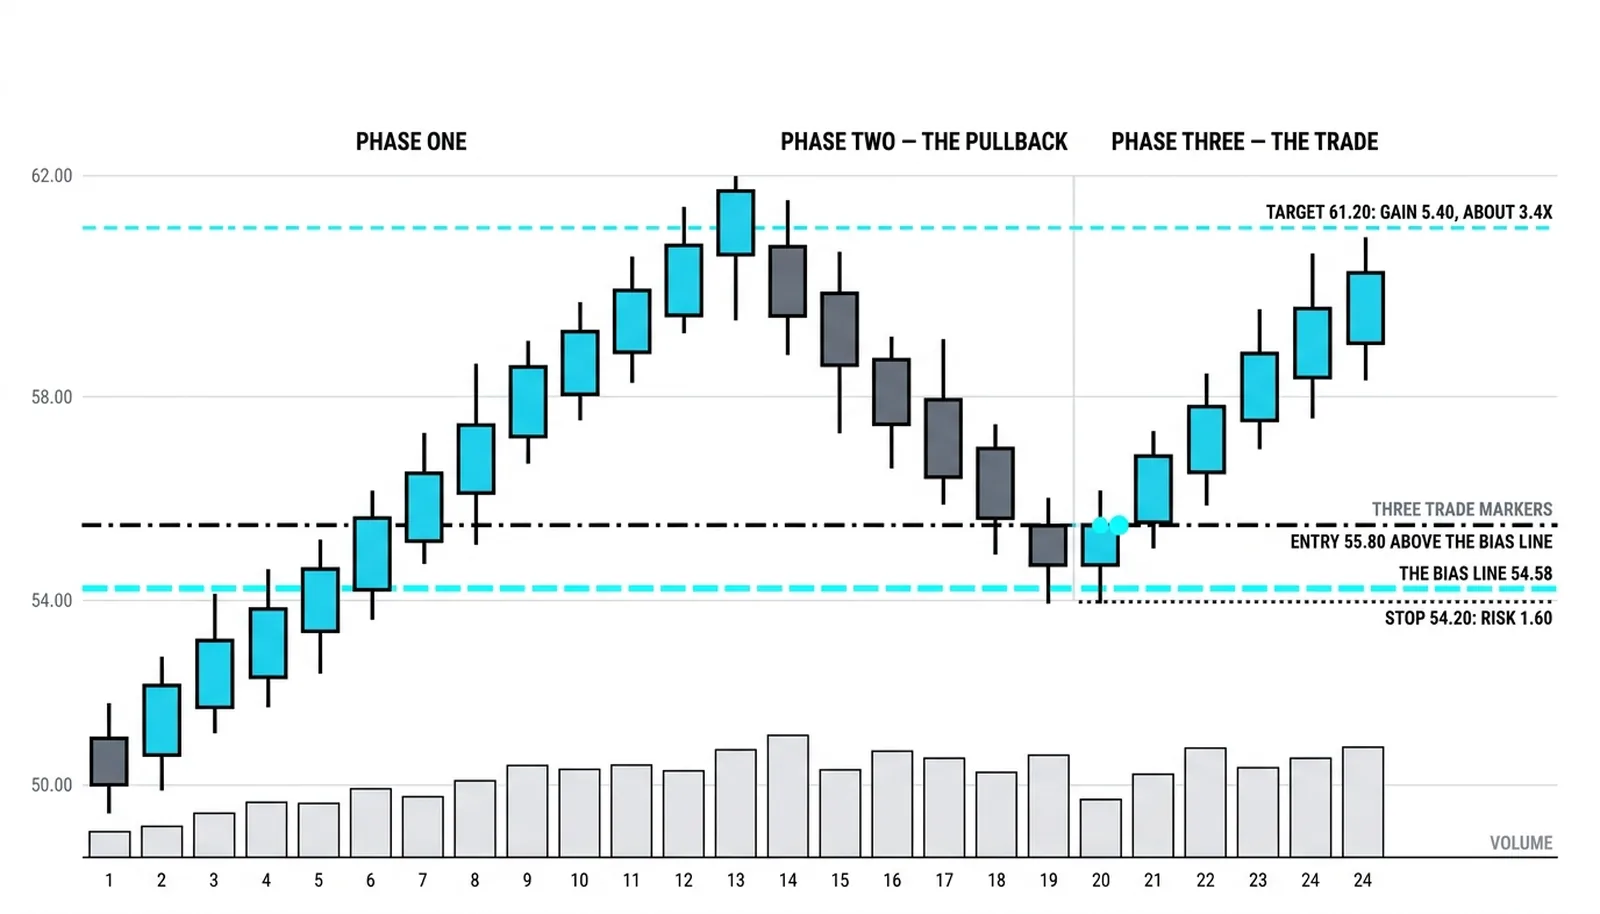
A hypothetical illustration with round numbers. The daily leg runs 12.00 points, from 50.00 to 62.00. The 61.8 percent retracement of that leg sits at 54.58. That line is the bias.
Price pulls back and holds above the line for weeks. The bias stays long the entire time, and every four-hour sell signal during those weeks is ignored without a second read.
The four-hour chart then prints a reversal at 55.10, above the line. The long is taken at 55.80 on the close of that candle. The stop sits at 54.20, below the line, risking 1.60 per share. The first target is 61.20, just under the old high. The trade reaches it for a gain of 5.40, about 3.4 times the risk.
The failed version teaches the same rule from the other side. The daily closes at 54.10, below the line. The bias is off. An hour later the four-hour chart prints a clean reversal candle, a fine long signal for a market the bias no longer trades. It is refused. The same rule that opened every long on the way up closes the book without a debate on the way down.
| Step | Chart | Question It Answers | Answer That Ends the Bias |
|---|---|---|---|
| Trend | Daily | Are highs and lows rising or falling? | The sequence of higher lows breaks |
| Bias line | Daily | Is price above the 61.8 retracement? | A daily close below the line |
| Entry | Four-hour or hourly | Is there a reversal in the bias direction? | No setup, no trade |
| Exit | Daily, then lower | Has the line been lost on a close? | Close the book, ignore the next signal |
Bias Questions, Answered
What is a fibonacci bias?
A fibonacci bias is a directional rule anchored to a retracement line on the higher chart. Above the line, only trades in the trend direction are allowed. Below it, that direction is closed. The word bias matters: it is permission, not a prediction.
Which retracement sets the bias?
The 61.8 percent line of the last major daily leg is the common choice, because it marks the deepest pullback a healthy trend usually survives. Some traders use the 38.2 percent line in very strong trends, accepting more frequent bias flips in exchange for tighter discipline. Pick one before the trade, not during it.
Can the bias change during the day?
No. The bias is set by the daily chart, so only a daily close can change it. An intraday dip through the line is a test, and the lower charts keep executing the standing bias until the daily close rules otherwise.
Do you trade against the bias ever?
Not inside this method. The counter-trend signal is treated as information about the pullback's depth, nothing more. Traders who want both directions need a different system, because mixing the two turns the bias back into a mood.
Once the bias reads cleanly on one market, the next step is stacking it with the volume work from this level, so the line is confirmed by participation rather than trusted on price alone.