Time and Price Confluence
Time and price confluence is the alignment of the two axes at one moment: a projected time window arrives while price stands inside a measured price cluster, and the alignment matters because when and where are the only two questions a reversal must answer. The time work says a turn is more likely inside a specific stretch of bars. The price work says a turn is more likely inside a specific band of prices. When the two land together, the setup has both a date and an address.

Think of the alignment as an invitation that names the date and the address, the day and the place both fixed in advance, the event happening only where the two agree. An invitation with a date and no address sends guests wandering. An address with no date leaves the room empty. The market works the same way, and the trader who tracks only one axis keeps showing up to half an invitation.
The Window and the Cluster
The cycles lesson projected the market's rhythm forward in bars, counting swings and ratios to mark the bars where a turn is statistically more likely. This lesson joins those projections to the price clusters the earlier lessons built, the retracement lines, the old shelves, the levels both crowds watch. That joining is the point the whole time section has been building toward.
The price work produces the cluster. A 61.8 percent retracement line lands within a few cents of an old consolidation shelf, and the two together form a zone rather than a single tick. The zone is where resting orders tend to pile up, because two independent measurements pointing at the same area means two different groups of traders have marked it.
The time work produces the window. A projected bar, or a small span of bars, where the rhythm of prior swings suggests a turn is due. The window says nothing about where price will be when it arrives. The cluster says nothing about when price will reach it. Each axis is half a message.
The confluence is the overlap: the window arrives while price is inside the cluster. Neither measurement carries a trade alone, and the experienced trader treats the overlap as the entry condition rather than either measurement.
One warning belongs here, and it is blunt. Never redraw one axis to fit the other. The trader who stretches the cluster to catch the window, or nudges the window to reach the cluster, has manufactured the coincidence instead of finding it. A manufactured coincidence has no crowd behind it, because no other trader drew those lines.
Synchronicity, Named
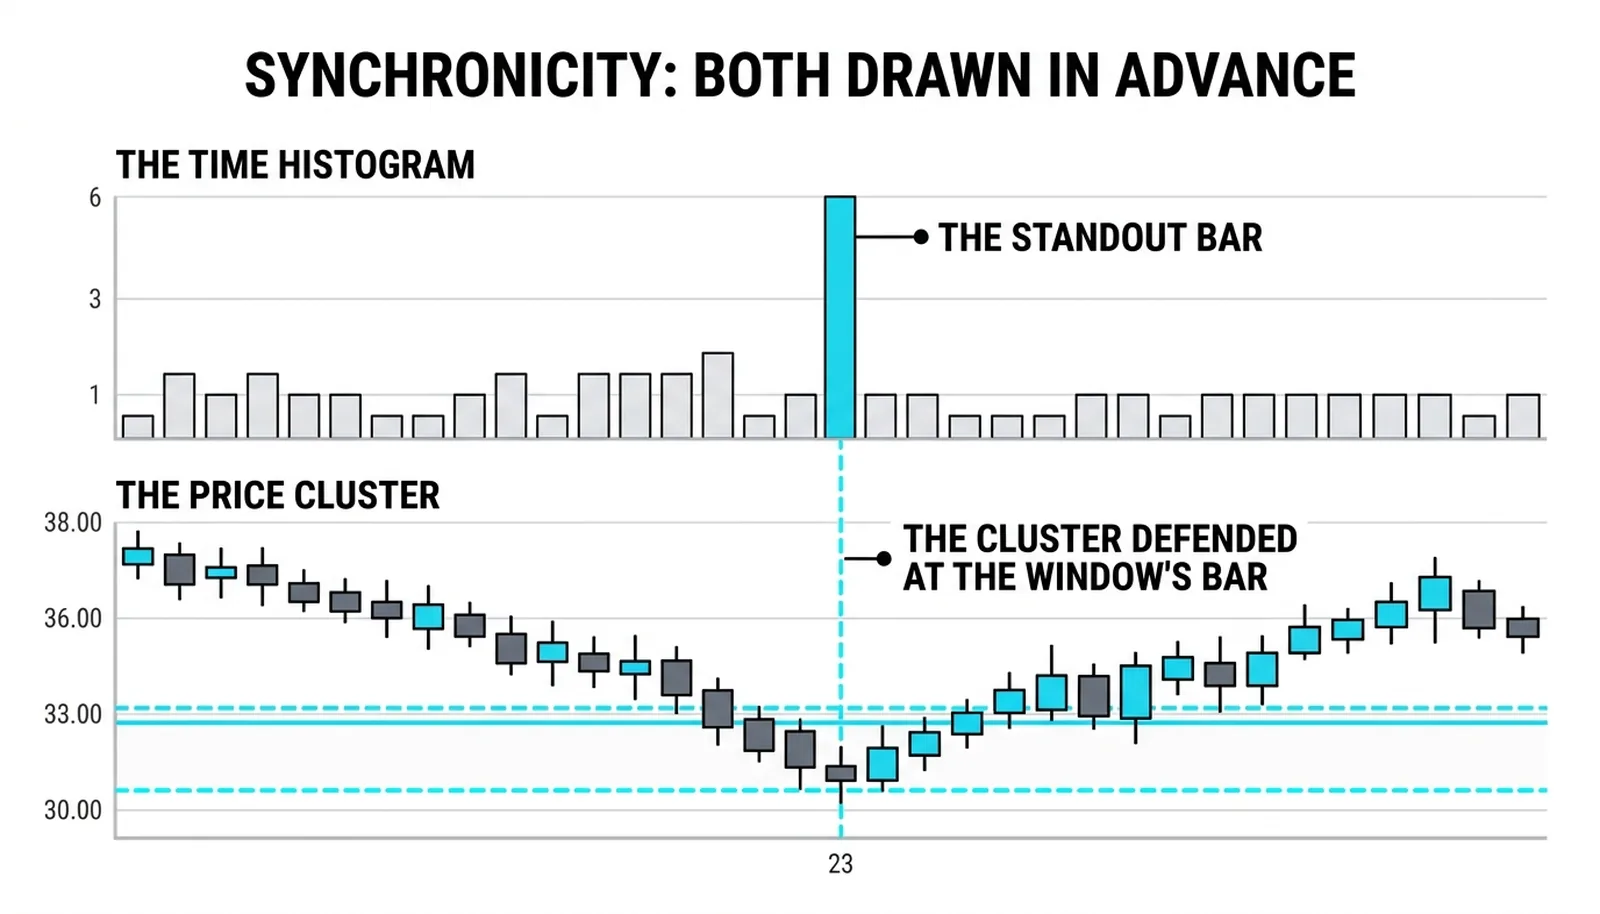
The definition carries a precise test, and the test is worth keeping. A coincidence is meaningful when both measurements were drawn in advance and neither was fitted to the other. Drawn in advance means the lines existed before the market reached them. Unfitted means each line came from its own axis, its own arithmetic, its own history. Two independent measurements naming the same bar is evidence. One measurement edited to match the other is fiction.
The price action canon supplies the mechanism underneath the coincidence. Orders rest at prices. A time projection has no force of its own, no order flow attached to a bar number. The projection acts only where it reaches a price the crowd defends, because only there do resting orders exist to respond. This is why a window that arrives while price floats in the middle of nowhere is an event with no address: the calendar says something should happen, and no one is standing where it could.
The honesty belongs beside the method. The alignment raises the odds of a turn and never guarantees one. Markets ignore well-formed confluence regularly, and the trader who treats synchronicity as a promise will be surprised by the same lesson the market teaches everyone: probability is not prophecy.
Trading the Alignment
The trade begins when both conditions exist at once. Price is inside the cluster, and the bar count is inside the window. The trader then waits for the market to answer: a reversal candle, a close back in the direction of the prior trend, printed on a bar that belongs to the window.
The entry comes on that close, not before it. Entering early because the confluence looks perfect is anticipation, and anticipation pays for the privilege of being wrong without evidence. The close is the evidence.
The stop goes below the cluster, not below the entry candle. The logic is structural: the trade exists because the cluster should hold, so the trade dies where the cluster fails. A stop inside the zone abandons the premise while the premise is still alive.
The confluence carries one gift that survives even failure. When the alignment breaks, both axes answer no in the same candle. The schedule was kept and the address was wrong, and the read is dead on both counts at once. There is nothing to reinterpret, nothing to rescue, no reason to linger. The trader who took the alignment knows immediately, and knowing immediately is worth real money over a career.
The Turn at 33.15
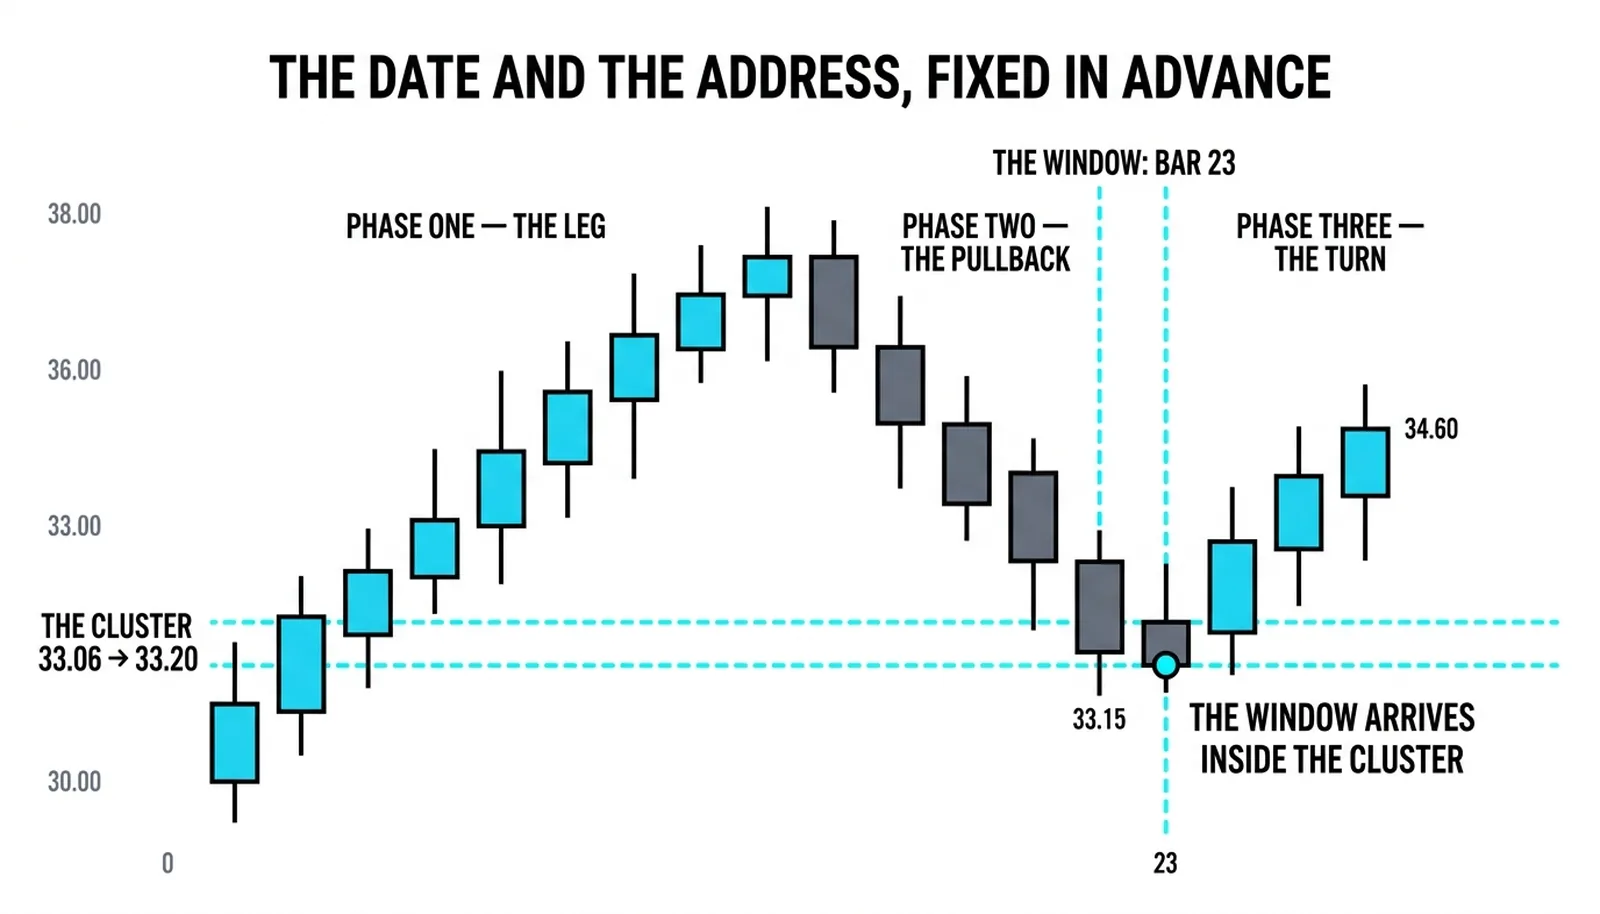
Here is the full sequence with invented round numbers, purely as an illustration. A leg runs 8.00 points, from 30.00 up to 38.00, in twenty-one bars. The trader measures the pullback zone and the time projection in advance, each from its own axis.
The price work: the 61.8 percent retracement of the leg sits at 33.06. An old consolidation shelf, left behind weeks earlier, sits at 33.20. The cluster spans 33.06 to 33.20, a band fourteen cents wide, drawn before price returns to it.
The time work: a 0.618 time projection measured from the swing points marks a bar thirteen bars after the high as the likely turn window. That bar is marked before it prints.
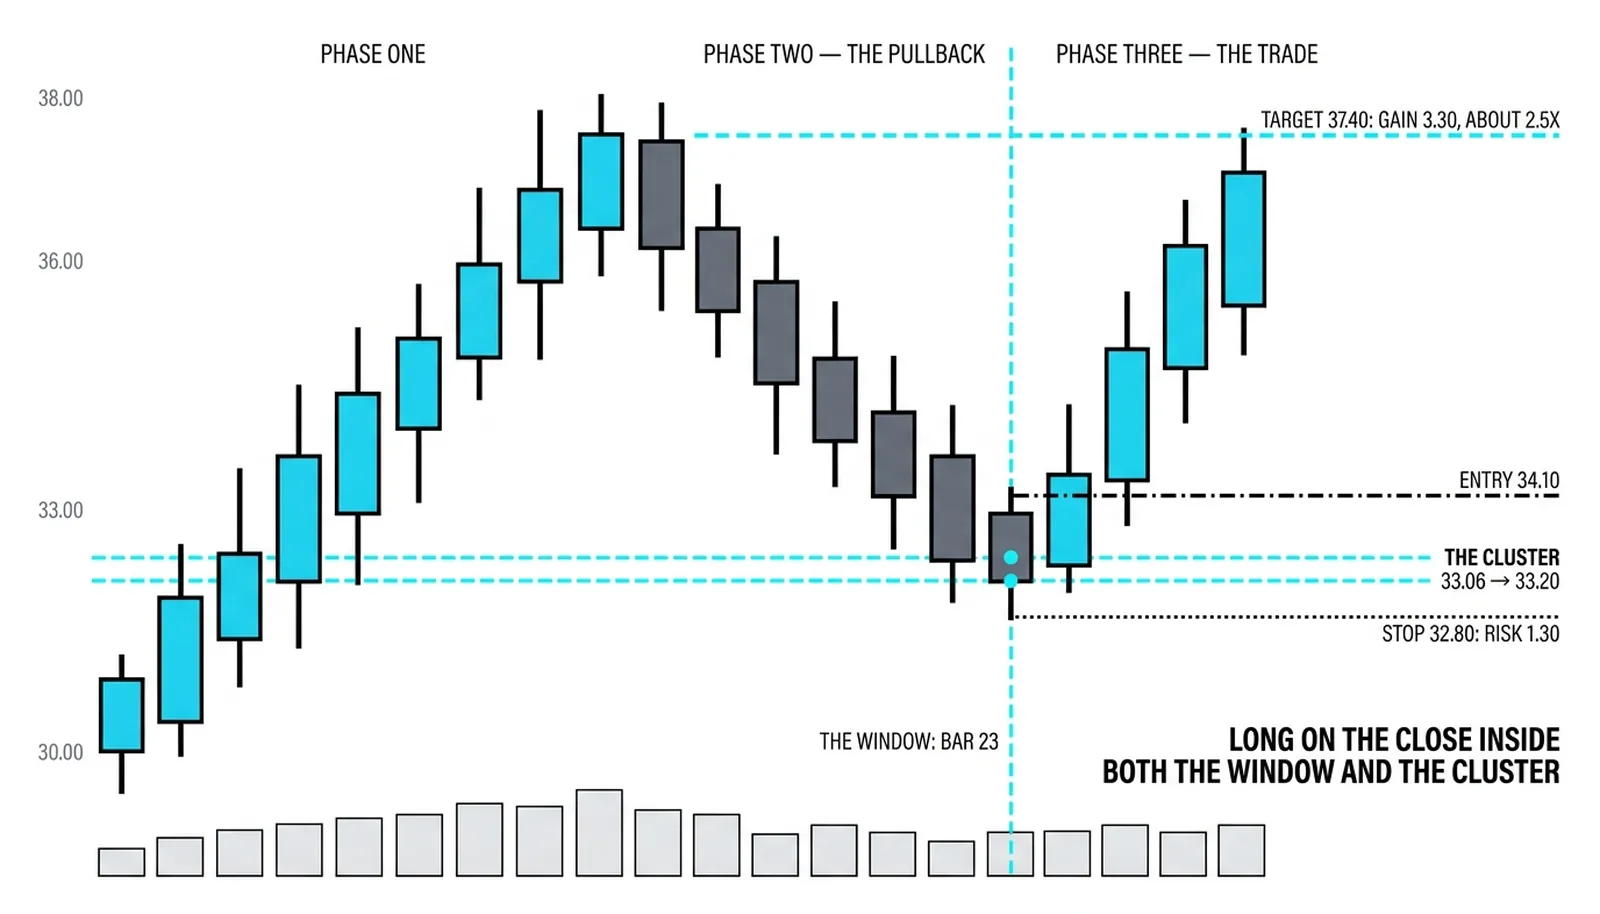
The market pulls back. On the projected bar, price trades at 33.15, inside the cluster. Both conditions now exist at once: the window is open and the address is occupied. A reversal candle forms and closes at 34.00.
The long is taken at 34.10 on the close. The stop sits at 32.80, below the cluster, risking 1.30 per share. The first target is 37.40, just under the old high, a gain of 3.30. The reward-to-risk is about 2.5 to 1, and every number in the trade was fixed before the entry.
The failed version deserves equal space. Suppose the window arrives on schedule and the market closes at 32.40, below the cluster. The time axis said turn, the price axis said the level failed, and together they say the read is dead. The trader exits or never enters, and the loss, if any, is the planned 1.30 rather than an open-ended argument with the tape.
| The axis | What it measures | What it contributes | What it cannot do alone |
|---|---|---|---|
| Time | The rhythm of prior swings, projected forward in bars | The window: when a turn is more likely | Say where price will stand when the window opens |
| Price | Retracements, shelves, and levels the crowd watches | The cluster: where resting orders wait | Say when price will arrive at the cluster |
| Confluence | The overlap of window and cluster | The setup: both questions answered at once | Guarantee the turn; it raises odds, never certainty |
| The candle | The market's answer inside the overlap | The trigger and the evidence for entry | Exist as a signal without the confluence behind it |
Synchronicity Questions, Answered
What is time and price confluence?
Time and price confluence is the overlap of a projected time window with a measured price cluster: the bar count says a turn is due while price stands where the crowd defends. Fibonacci cluster practice names the overlap synchronicity, and the test of a real one is that both measurements were drawn in advance, each from its own axis, with neither adjusted to meet the other.
Which is more important, time or price?
Price is the more important axis, because orders rest at prices and only prices fill or defend. The tape-reading framework makes this plain: a time projection acts only where it reaches a defended price, so the window without the cluster is an event with no address. Time is the filter that tells the trader which visits to the cluster deserve the closest attention.
How do you find time and price confluence?
Draw each axis separately and in advance. On the price side, mark the retracement lines and old shelves and note where two or more land within a few cents of each other. On the time side, project the swing counts and ratio windows forward in bars. The confluence is wherever the window and the cluster coincide without any adjustment, and if they never coincide, there is no trade on this setup.
Does the market always turn at confluence?
No, and any source that says otherwise is selling something. The alignment raises the odds of a turn; it never guarantees one. The compensation for the failures is clarity: when confluence breaks, both axes die in the same candle, the read is unambiguously wrong, and the exit is immediate rather than negotiated.
The time section closes here, with the two axes joined. The next stage of Level 9 returns to volume and the horizontal view, where the same discipline of advance measurement gets applied to the prices where business was actually done.