Seasonal Patterns and Fibonacci Time
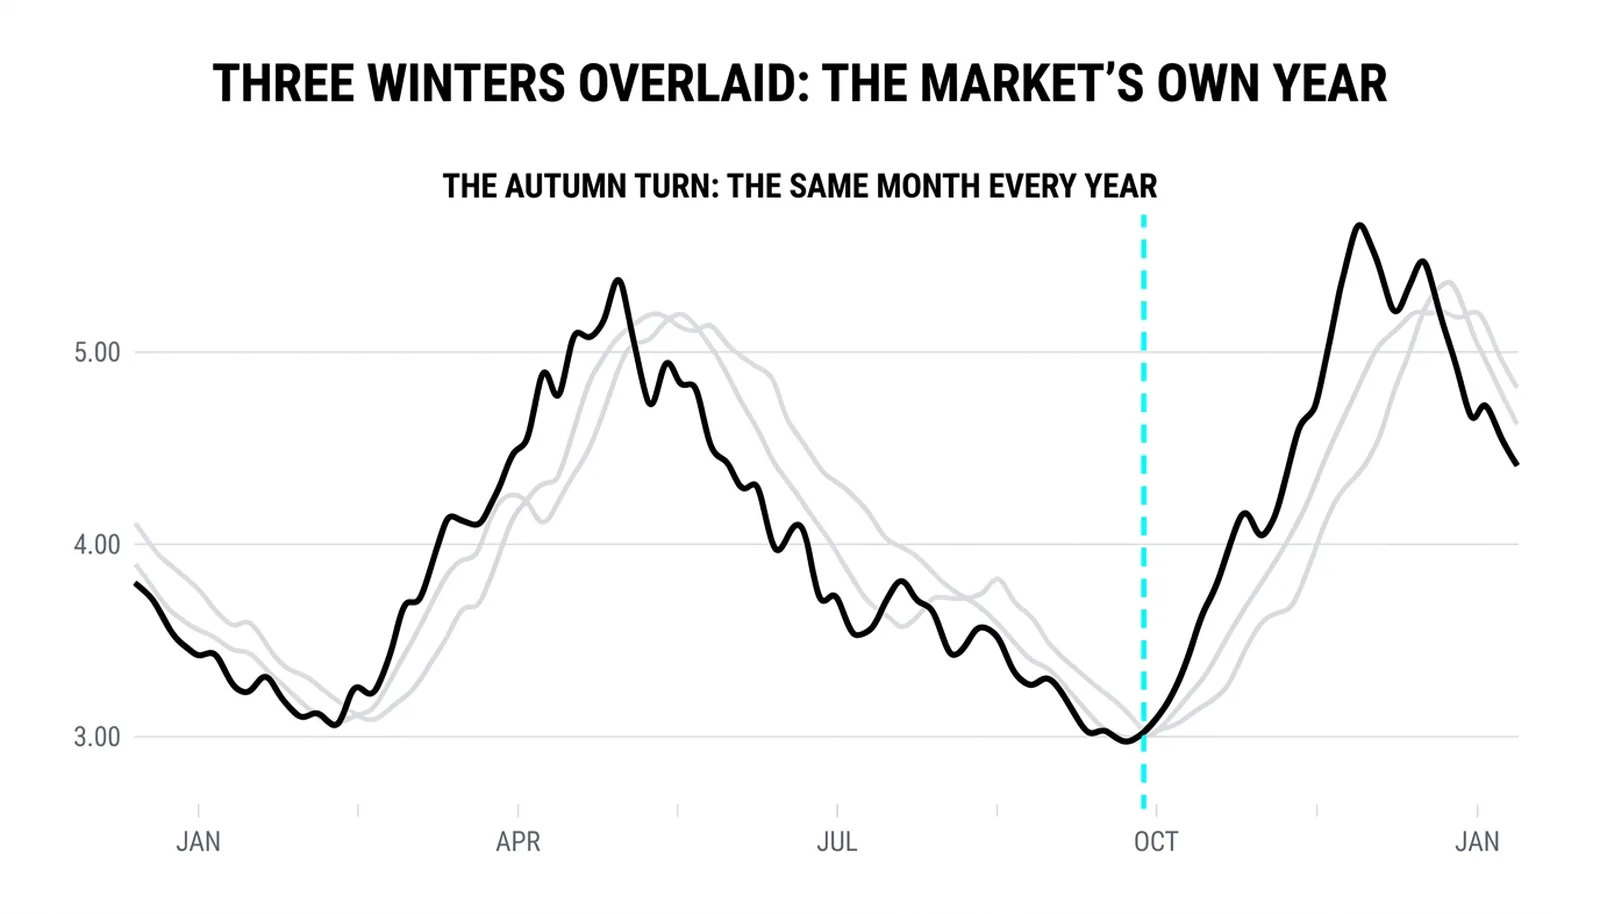
Seasonal patterns are rhythms in price that repeat because the world outside the chart repeats, heating fuel bought each autumn before the cold, gasoline demand rising into each summer driving season, and when such a rhythm lands near a projected fibonacci time window the calendar's evidence and the ratio's evidence stack at the same bars. Two independent reasons point at the same candles. That stacking is the value of the lesson: neither the season nor the ratio is enough alone, but together they narrow the field of trades worth taking.

Think of geese returning each year on a schedule that holds to the week, the count kept by the season itself, with a late winter delaying the arrival without ever canceling it. Markets with real physical demand behave the same way. The rhythm is not guaranteed in any single year. It is reliable across years, which is a different and more useful claim.
The Calendar in the Chart
The confluence lesson aligned the chart's two axes, price and time, and showed how a level and a projected window can meet at one bar. This lesson adds a third evidence that lives on the calendar itself, the patterns that return whether or not any ratio projected them.
Seasonal patterns recur within the year. They tie to things the calendar forces: heating demand before winter, driving demand before summer, planting and growing cycles in grains, fiscal year-end flows, tax deadlines. The cause sits outside the chart, which is why the pattern can persist.
Cyclical patterns stretch across years. Business cycles, credit cycles, multi-year swings in commodity demand. These are slower, looser, and harder to time, but they set the background against which the annual rhythms play out. A seasonal rally inside a contracting cycle is a weaker trade than the same rally inside an expanding one.
What qualifies as a rhythm is strict. The pattern must have repeated across enough years to be a tendency rather than a coincidence, and it must make economic sense. Three data points and a good story is not a rhythm. Ten or fifteen years of the same move, tied to a demand that exists for a reason, is.
The cluster method treats time projections as a discipline, and the seasonal layer fits it: a projected window is a hypothesis, and the calendar either confirms it or it does not. The trader's job is to demand both.
The Economic Sense Test
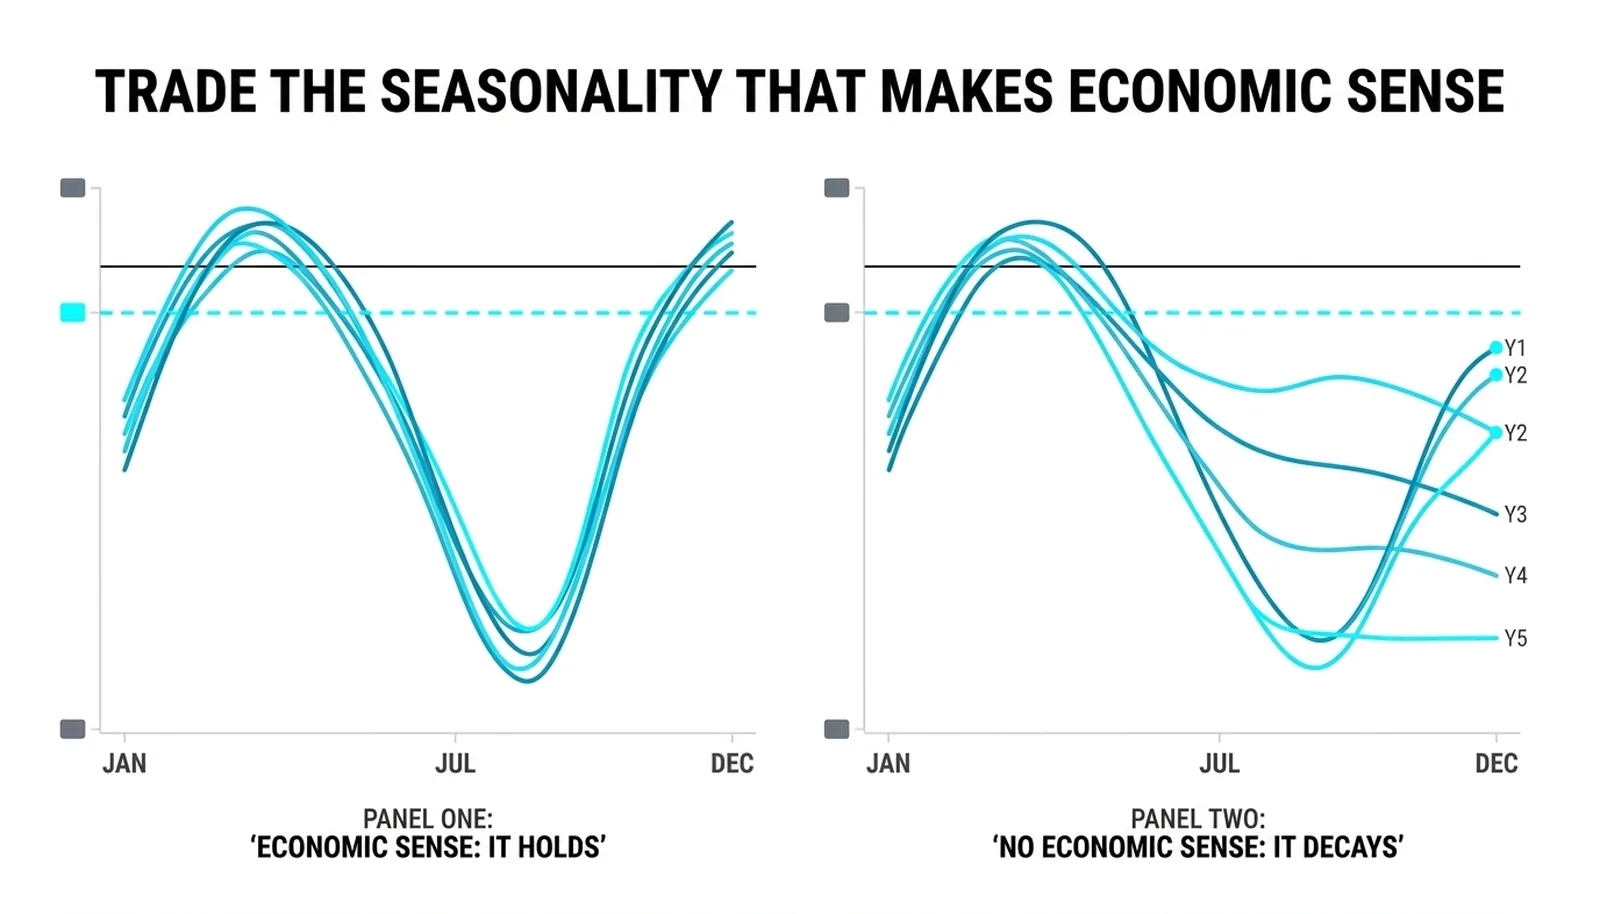
Quantitative backtesting practice supplies the honesty every seasonal trader needs. Quantitative backtesting practice tested well-known calendar effects and found that much of the seasonality in equity markets has weakened or disappeared as the knowledge spread. Once everyone knows the pattern, everyone positions early, and the pattern gets traded away.
This is the filter that separates tradeable seasonality from trivia. The seasonality worth trading is the kind that makes economic sense, the kind backed by demand that cannot wait. Heating fuel must be bought before winter because buyers have no choice about the cold. That demand does not move to October because traders noticed the pattern. The cold comes when it comes.
Contrast that with a pattern like a stock index tending to rise in a certain month. There is no physical buyer forced to act. The pattern exists only because of flows and habits, and flows and habits change. When the knowledge spreads, the edge thins.
So the test has two questions. First, has this pattern repeated across enough years to be a rhythm. Second, is there a buyer or seller who must act regardless of what traders know. If the answer to the second is no, treat the pattern as decoration.
The fibonacci connection is often misunderstood here. The ratios do not cause the seasons. The connection is that a market with a real annual rhythm produces swing durations that repeat, because the underlying demand repeats. When a projected time window lands inside the seasonal tendency, two independent evidences point at the same bars. Independence is what gives the stack its weight.
Be blunt about the limit. The calendar is the weakest claim on the chart. Seasonal patterns fail in the year the weather or the economy does not cooperate, and the pattern that fails still fails at the stop, not at the belief.
Trading the Seasonal Window
The trade construction follows directly from the filter. You have a qualified rhythm, one with years of repetition and a forced buyer behind it. You have a fibonacci time projection from a prior swing, and the projected window falls inside the seasonal tendency. Now you wait for price to confirm.
Price confirmation means the market is already moving the way the rhythm says it should. If the seasonal rally is due and the window opens but price is falling, there is no trade. The calendar proposes. Price disposes.
The entry belongs on strength that holds, typically a break of an old level followed by a retest that holds. Entering on the retest rather than the break gives a defined risk point: the low of the retest or the low of the window. The stop goes below that, and the risk is measured before the trade is taken.
The target comes from the rhythm itself. If the last several rallies in this seasonal window averaged a certain distance, that average is the reasonable expectation. Not the best year. The average.
The failed version must be planned before entry. A warm winter cancels the heating rally. Price drifts, the window closes, and the position exits at the stop for the planned loss. No projection, seasonal or fibonacci, can make the cold come. The trader who accepts this in advance loses small and stays in the game. The trader who believes the season owes them a rally turns a failed tendency into a large loss.
Position sizing carries the honesty. Because the calendar is the weakest evidence on the chart, trades built partly on it deserve ordinary or reduced size, never enlarged size. The stack of evidences justifies taking the trade. It never justifies betting more on it.
The December Window
A hypothetical heating-fuel market rallies from autumn lows into winter highs in most years, and the last three rallies averaged 2.00 points each. The rhythm has repeated for well over a decade, and the cause is forced demand: buyers must stock before the cold.
This year the autumn low prints at 3.00. A 1.0 time cycle measured from the previous autumn low projects a window in early December. The seasonal tendency says the rally should be under way by then. The projection and the season agree.
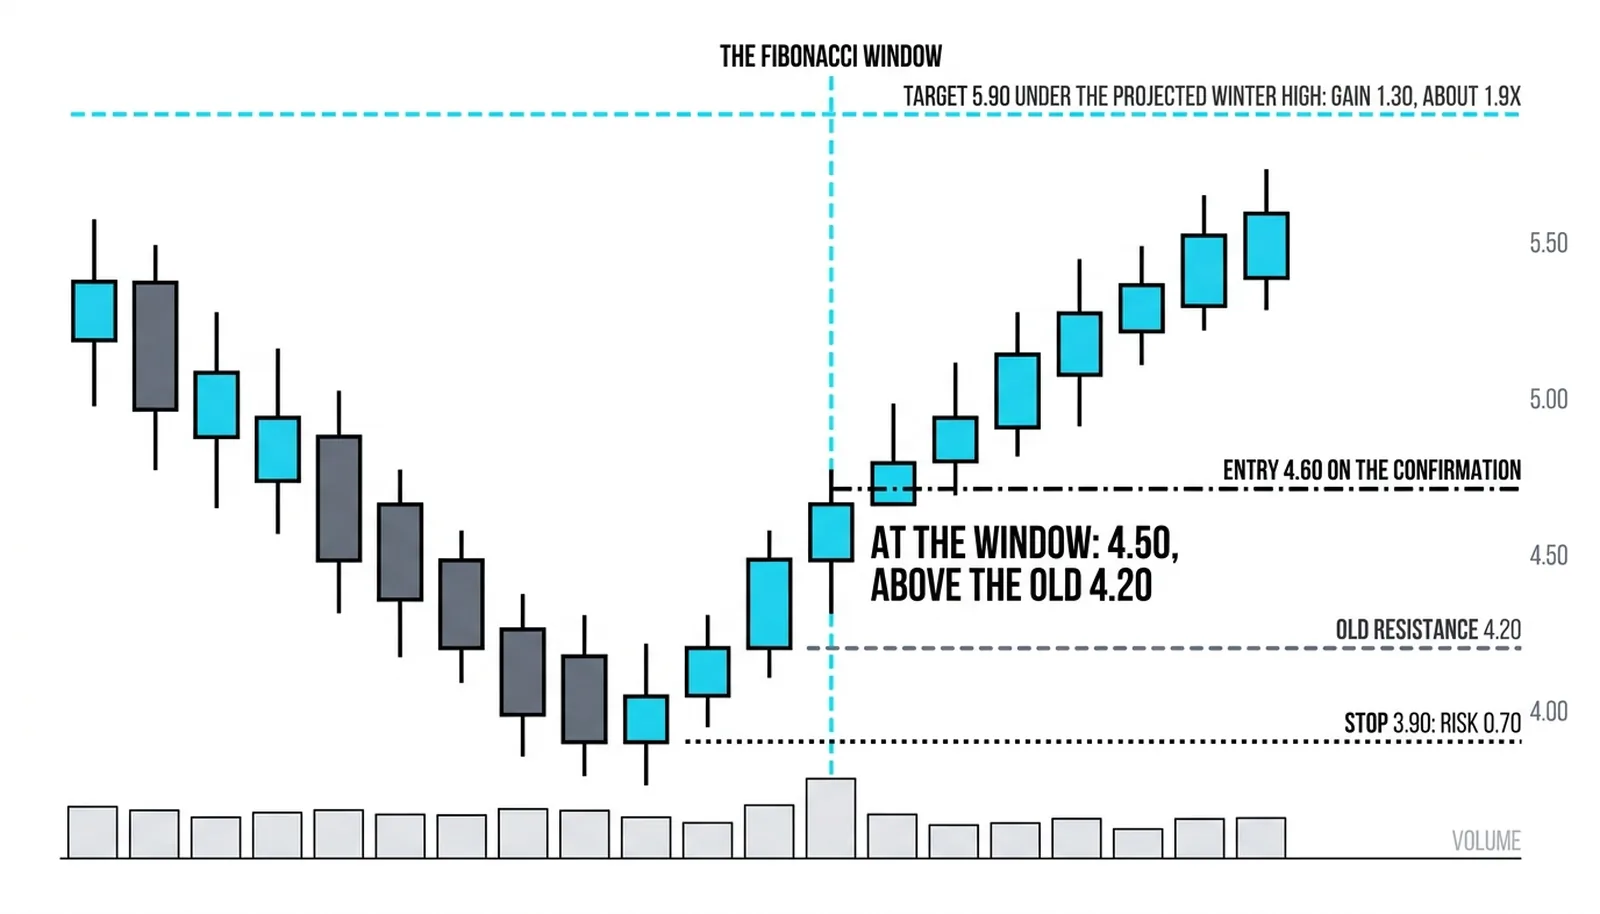
At the window, price is 4.50, already above the old 4.20 resistance from the prior spring. The market is confirming. The long is taken at 4.60 on the retest of that broken level, the stop at 3.90, below the window's low of 4.00. The risk is 0.70 per unit.
The first target is 5.90, sitting under the projected winter high implied by the 2.00-point average rally from the 3.00 low. From 4.60, the gain to target is 1.30, about 1.9 times the risk. The trade is taken because three evidences agree: the season, the projected window, and price breaking and holding above 4.20.
The failed version is the warm winter. The rally never arrives. Price closes at 3.60 in December, below the stop, and the trade dies at 3.90 for the planned 0.70 loss. The geese were late because the season itself was wrong. The loss is the cost of finding out, and it was priced in before entry.
| The Rhythm | Its Clock | Its Evidence | Its Failure Mode |
|---|---|---|---|
| Heating fuel rally | Autumn low to winter high, within the year | Forced demand before cold, repeated across many years | A warm winter removes the buyer's urgency |
| Summer driving demand | Spring build into summer peak, within the year | Travel season returns on the calendar | Weak economy cuts travel, demand disappoints |
| Equity month effects | Specific months, within the year | Historical tendency only, no forced buyer | The effect is traded away once widely known |
| Business cycle swings | Multi-year expansions and contractions | Credit and demand cycles across years | Slow, loose timing; policy shifts extend or cut the cycle |
Seasonal Questions, Answered
What are seasonal patterns in trading?
Seasonal patterns are price tendencies that repeat at the same point in the year because something outside the chart repeats, such as heating demand before winter or driving demand before summer. The valid ones are backed by a buyer or seller who must act. The rest are statistics looking for a reason.
How do seasonal patterns align with fibonacci time?
A market with a real annual rhythm produces swing durations that repeat, so a fibonacci time projection from a prior swing often lands inside the seasonal window. When the projected window and the seasonal tendency cover the same bars, two independent evidences confirm each other. Neither causes the other. The agreement is the signal.
Do seasonal patterns still work?
Some do and many do not. Quantitative backtesting practice showed that widely known equity calendar effects weakened as the knowledge spread. Patterns backed by forced physical demand, like heating fuel before winter, persist because the demand cannot move. Test the pattern across enough years and demand an economic reason before trusting it.
Which markets have the strongest seasonality?
Markets tied to physical cycles show the strongest seasonality: heating fuels, gasoline, grains, and other commodities with planting, growing, or weather-driven demand. Financial instruments show weaker and less reliable tendencies because no buyer is forced by the calendar. Strength of seasonality tracks how little choice the end buyer has.
Next, the drawn tools take over from the calendar: fans, arcs, and channels, the lines that bend with the move instead of sitting flat across it, and the discipline of knowing when a bent line is measuring something real and when it is only decoration.