Fibonacci Time Cycles
Fibonacci time cycles are the durations of completed swings projected forward as recurring windows, the market's own rhythm measured between two points and repeated at ratio intervals. The projection says the next turn is due when the count says it is, wherever the price happens to stand. Price tells you where; the cycle tells you when.

Think of the phases of the moon, counted in advance and repeating on a schedule kept from one full moon to the next, the count reliable long before any phase arrives. A swing that took thirty-four bars to build is a completed phase. The ratios project the next phases from it.
The time zones lesson drew its intervals from one anchor point and counted outward. Cycles work differently. The measurement comes from the market itself, the distance between two of its own turning points, and that distance is what gets projected forward. The market supplies the unit; the ratios supply the schedule.
Two Points and a Duration
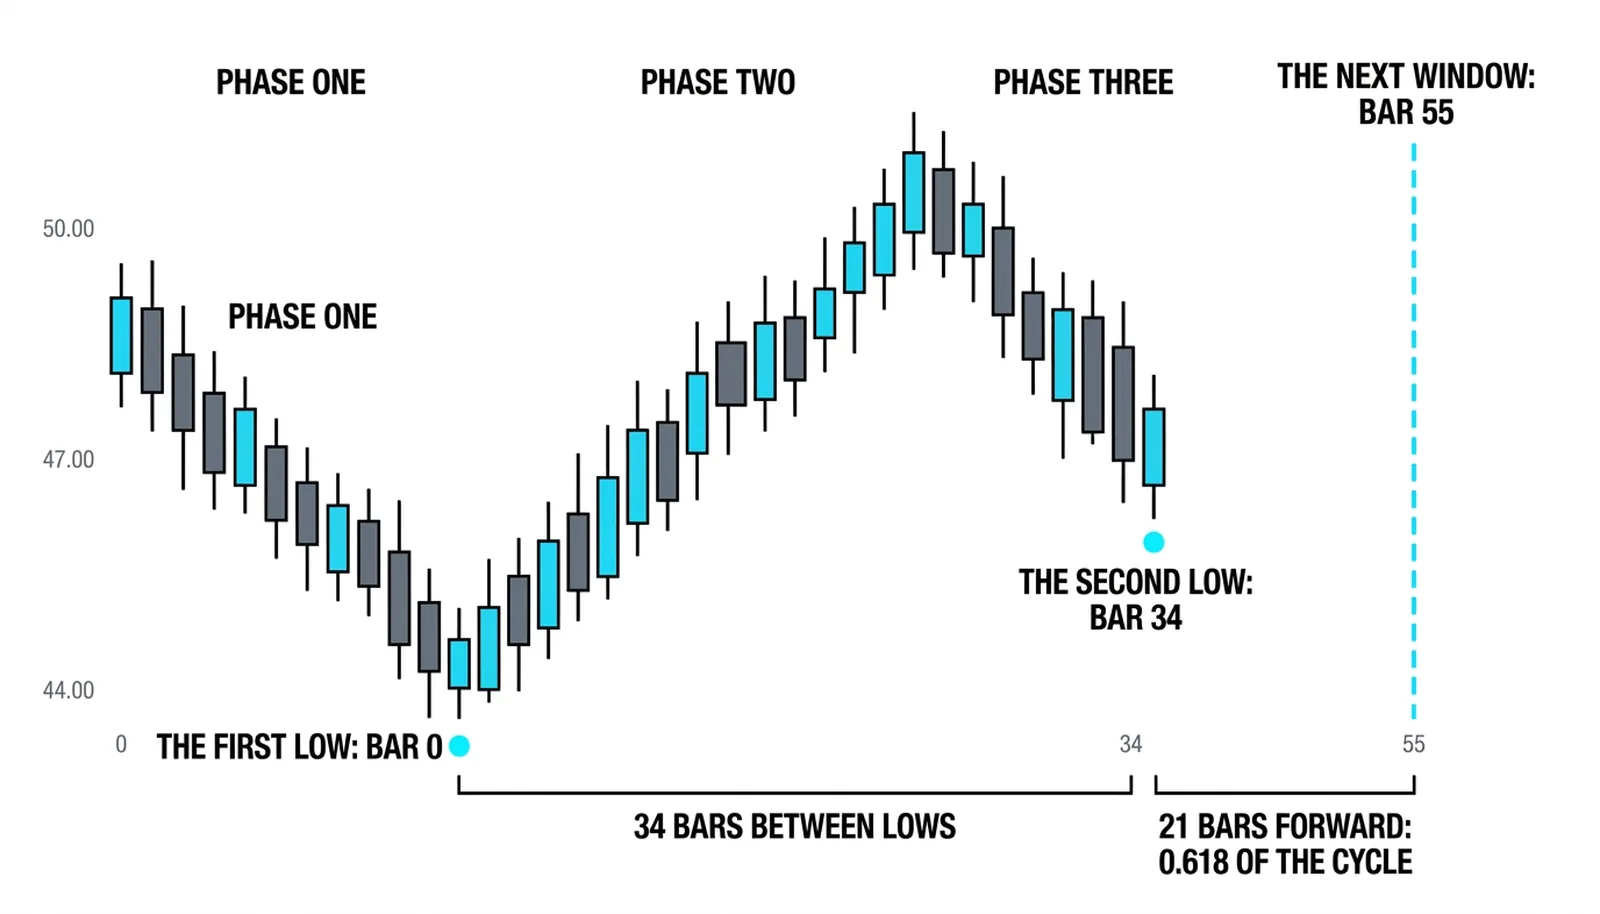
A cycle needs two points. The last two lows, the last two highs, or a low and the high that followed it. The bar count between them is the swing's duration, and that duration is projected forward at the same ratios the price work uses: 0.382, 0.5, 0.618, 1.0, 1.618.
The cluster method names the four projections exactly: low to low, high to high, low to high, and high to low. Each pairing measures a different piece of the market's rhythm. Low to low captures a full down-up-down sequence. Low to high measures the drive phase alone.
Not every wiggle qualifies. A swing counts as a completed duration when the move between the two points is clean and visible on the timeframe being traded, with a real reaction at each end. A two-bar dip inside a straight run is noise, not a cycle leg.
The projection itself is simple arithmetic. Take the bar count between the two points, multiply by the ratio, and count that many bars forward from the second point. A thirty-four-bar low-to-low swing projects its 0.618 cycle at twenty-one bars past the second low, its 1.0 cycle at thirty-four bars, its 1.618 cycle at fifty-five.
The price action canon frames the mechanism without the mystery. Swings in an active trend share a rhythm because the same order flow drives them, so the duration of the last swing is evidence about the next one. Weaker evidence than a price level, useful when it lands on one.
When Cycles Cluster
Fibonacci cluster practice reads a market rallying into a 0.618 time cycle as a market approaching a window where a high and a reversal become more likely. The 0.618 projection matters most because it marks a duration shorter than the full swing, a rhythm that is tightening rather than simply repeating.
Single cycles can turn a market. That happens, and the charts are full of tops that arrived on a lone projection. But one measured interval is one opinion, and the market ignores single opinions constantly.
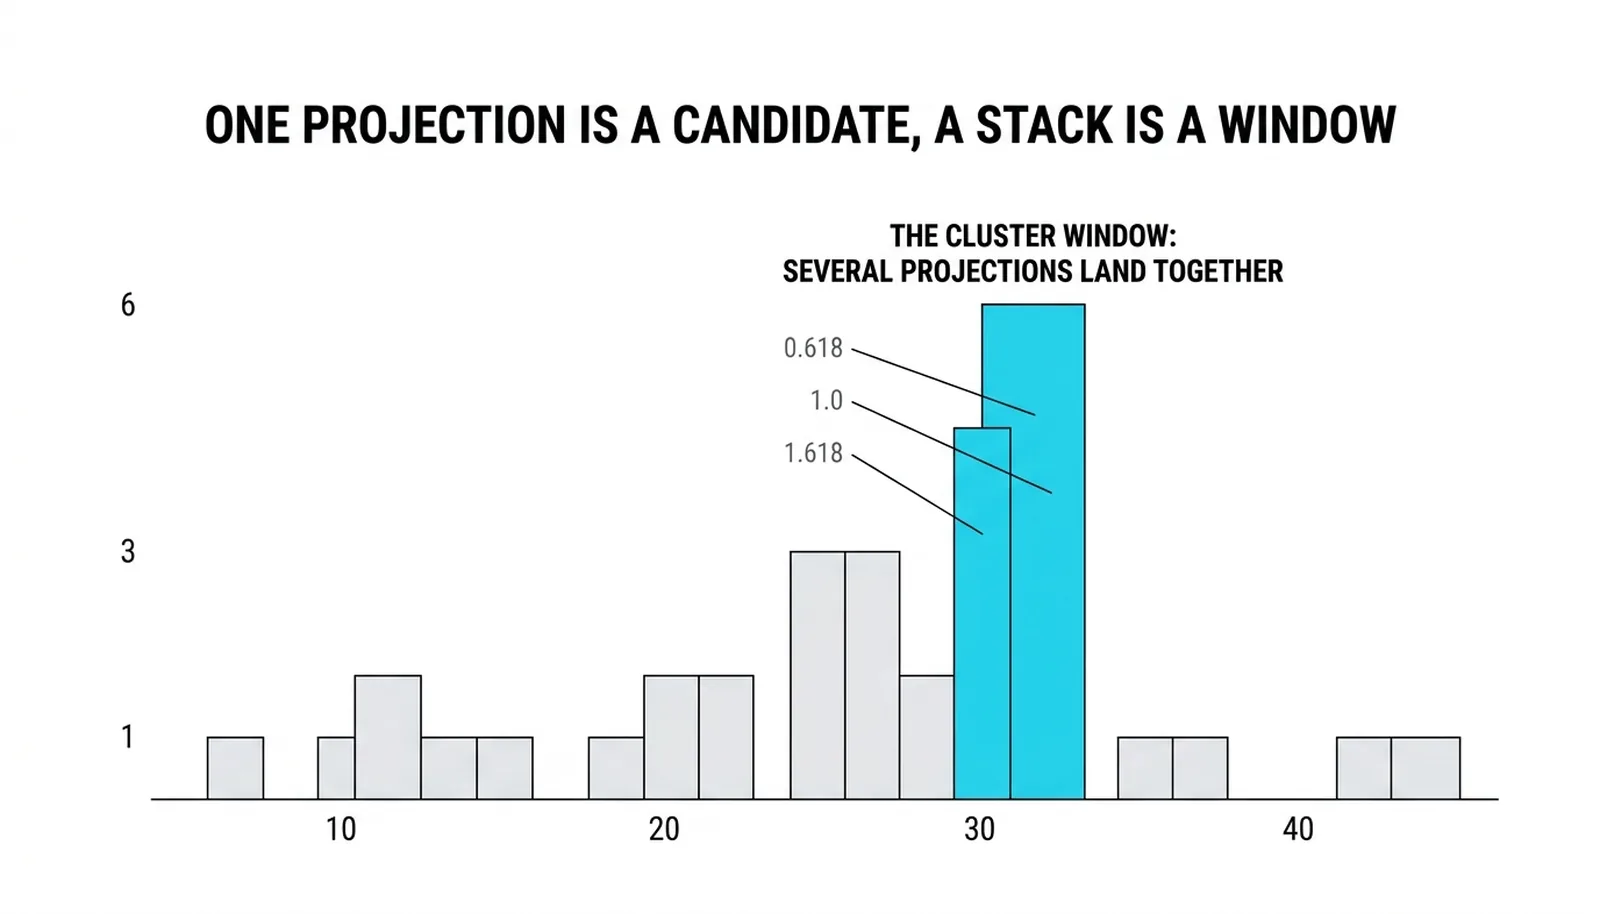
The odds improve when several cycles from different two-point measurements cluster into one window. A low-to-low 0.618 landing at bar twenty-one, a high-to-high 1.0 landing at bar twenty-three, and a low-to-high 1.618 landing at bar twenty-two describe one window, not three. Three independent rhythms pointing at the same stretch of bars is a different quality of signal than any one of them alone.
Clusters work the way confluence works everywhere else in this course. Each measurement is weak by itself. Agreement between independent measurements is the method.
The honesty belongs here too. A cycle is a projection of a pattern, and patterns end without announcing it. The cycle that arrives while the trend is still pressing is the failed version's lesson. No count of bars has ever forced a high.
Trading the Cycle
The trade is a reversal trade taken inside the window, and it needs price confirmation before entry. The cycle says when to pay attention. The chart still has to say what to do.
The sequence runs like this. The projections are drawn forward from the second point. Price rallies into the window. A reversal candle forms inside the window, ideally at a price level that also matters, an extension or an old high. The short is taken on that candle's close, the stop sits above the cycle high, and the target aims back at the base the rally launched from.
The risk is defined by the cycle high because that high is the idea being tested. If price trades back above it, the window failed and the position is wrong. Small, known risk against a measured target.
The failed version deserves equal weight. The thirty-four-bar cycle arrives and the market presses straight through to new highs. The count was kept, the rhythm repeated right up to the bar it stopped repeating, and the trade was wrong. The stop is what makes that outcome survivable, and the next cycle gets projected anyway, because one failed window says nothing about the next one.
What matters is treating the cycle as a window for a decision, not a decision by itself. Windows with price confirmation get traded. Windows without it get watched.
The Cycle at Bar Twenty-One
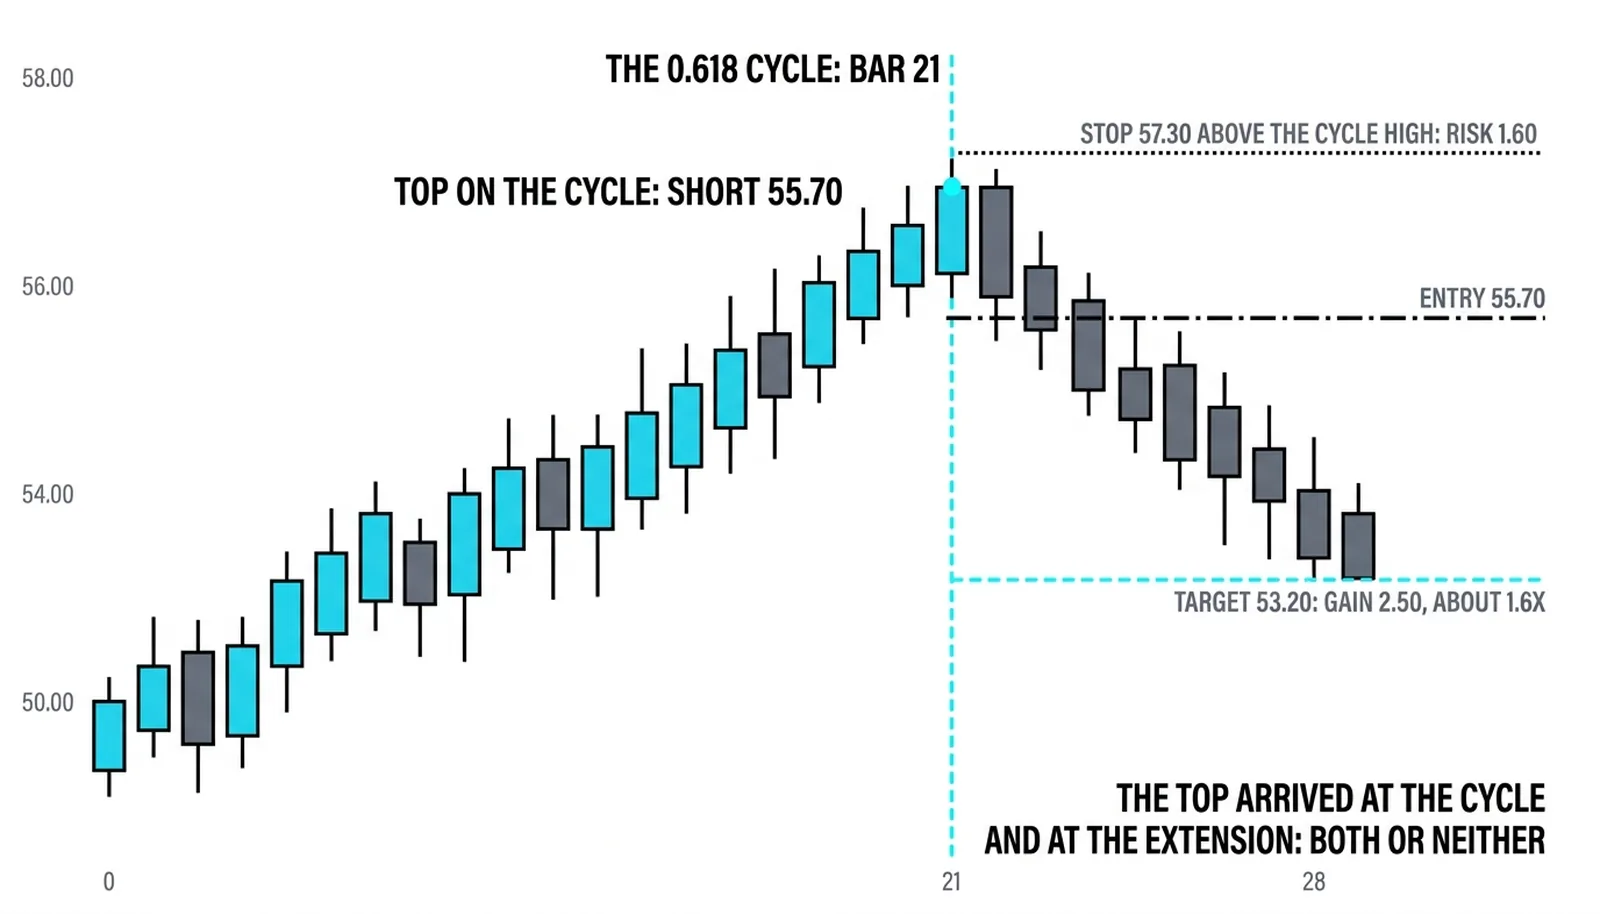
A hypothetical illustration with round numbers. The last two lows on the chart stood thirty-four bars apart. From the second low, the projections fall at twenty-one bars (0.618 of thirty-four), thirty-four bars (1.0), and fifty-five bars (roughly 1.618).
The rally off the second low ran from 50.00 to 57.00 and topped exactly on the twenty-first bar, at the 0.618 cycle. The top also landed near a price extension, so the window arrived with confluence.
The reversal candle closed at 55.80. The short was taken at 55.70 on that close. The stop sat at 57.30, above the cycle high, risking 1.60 per share. The first target was 53.20, near the launch base of the rally.
Price reached the target. The gain was 2.50 per share against 1.60 of risk, about 1.6 times the risk. The cycle supplied the timing, the price extension supplied the location, and the reversal candle supplied the trigger.
The failed version, same setup: the thirty-four-bar cycle arrives with the market pressing upward through 57.40 to new highs. The short from the earlier window is already stopped for its 1.60. The count was right about the rhythm until the rhythm changed, and the only protection was the stop placed before the outcome was known.
| The Projection | The Two Points It Measures | The Ratio It Applies | The Turn It Watches For |
|---|---|---|---|
| Low to low | The last two swing lows | 0.618, 1.0, 1.618 of the bar count | A low forming in the projected window |
| High to high | The last two swing highs | 0.618, 1.0, 1.618 of the bar count | A high forming in the projected window |
| Low to high | A swing low and the high that followed | 0.618, 1.0, 1.618 of the drive's duration | The next low after the drive completes |
| High to low | A swing high and the low that followed | 0.618, 1.0, 1.618 of the decline's duration | The next high after the decline completes |
Cycle Questions, Answered
What are fibonacci time cycles?
They are the durations of completed swings, measured in bars between two turning points and projected forward at ratio intervals. The projection marks windows where a turn becomes more likely, based on the rhythm the market has already shown.
How do you project a time cycle?
Count the bars between two turning points, multiply that count by the ratio, and count the result forward from the second point. A thirty-four-bar swing projects its 0.618 cycle twenty-one bars ahead and its 1.0 cycle thirty-four bars ahead.
Which points do you measure from?
The last two lows, the last two highs, or a low and the high that followed it. The four pairings of the cluster method, low to low, high to high, low to high, and high to low, each capture a different piece of the rhythm, and using several at once is what produces clusters.
Do cycles repeat forever?
No. A cycle is a projection of a pattern, and patterns end without warning. The rhythm holds until the bar it stops holding, which is why every cycle trade carries a stop and why a failed window is normal, not a flaw in the method.
Time analysis continues from here with the calendar itself: sessions, weeks, and the recurring windows the schedule imposes on every market whether the swings cooperate or not.