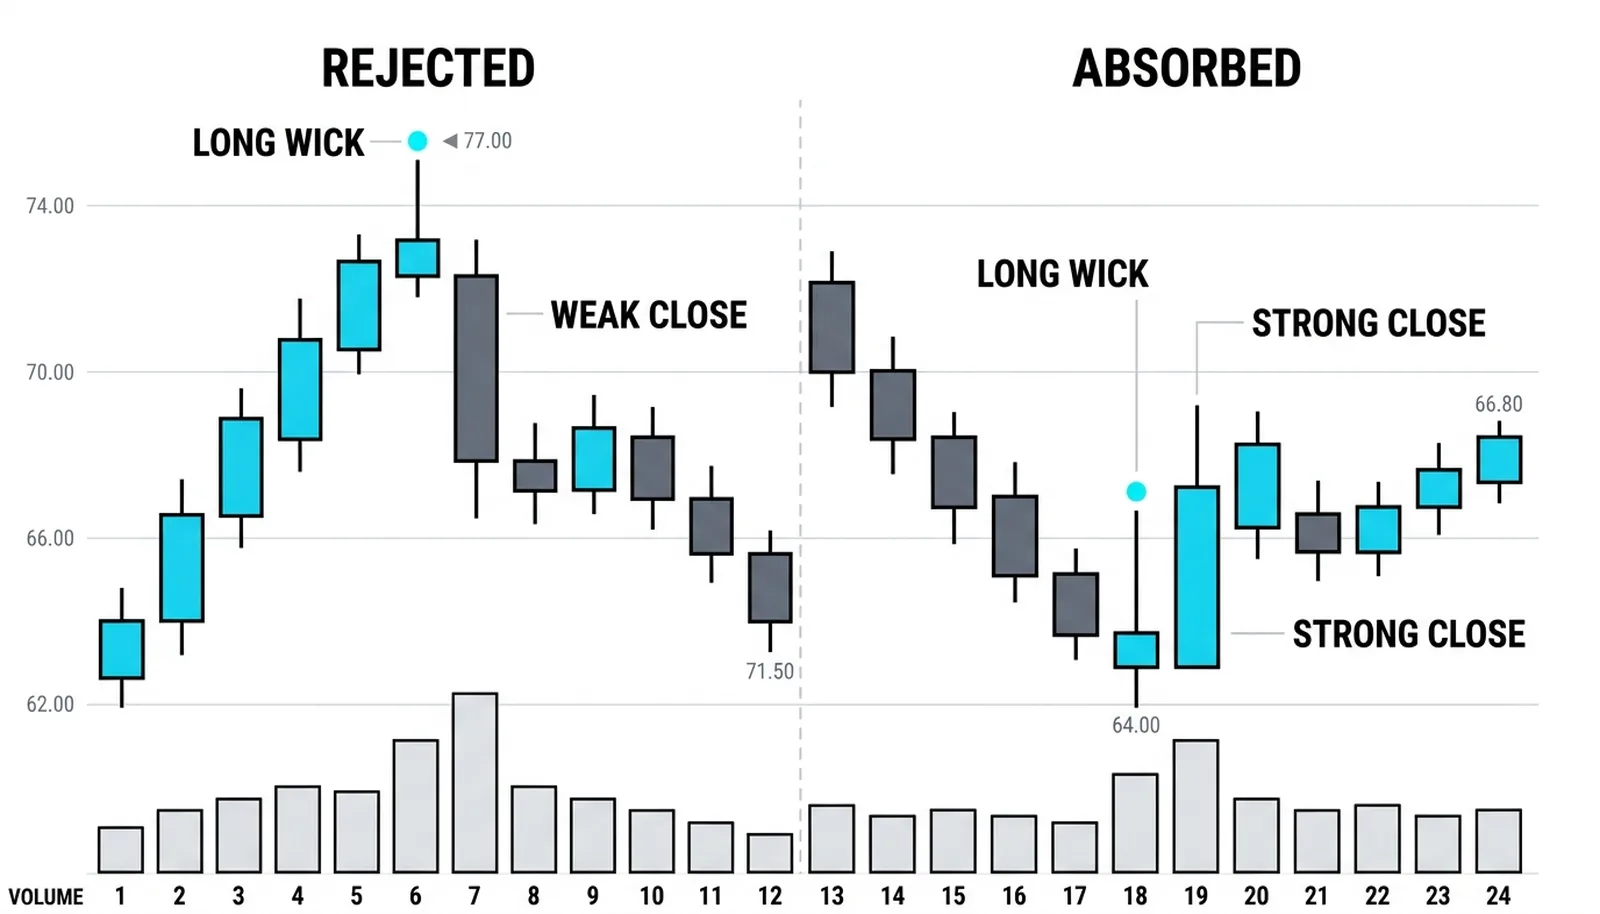
The Psychology Behind Every Candlestick
The psychology of a candlestick is simple once you see it: every bar is a record of a fight for a fixed period of time. The body shows which side won and by how much. The wicks show the prices each side tried to claim and lost. Reading a candle as psychology means asking three questions: who entered, who got trapped, and who gave up. The shape is the outcome. The psychology is the fight that produced it.

Think of a sumo bout. The body is where one wrestler moved the other across the line, and the wicks are the shoves that got reversed at the edge.
An earlier lesson taught candle anatomy, the parts of the bar and their names. Another taught that location matters more than the pattern. This lesson sits between those two: the fight inside the bar.
The Body Is Conviction, the Wick Is Rejection
Each part of the bar confesses something. Learn to hear all four confessions and the chart stops being a drawing.
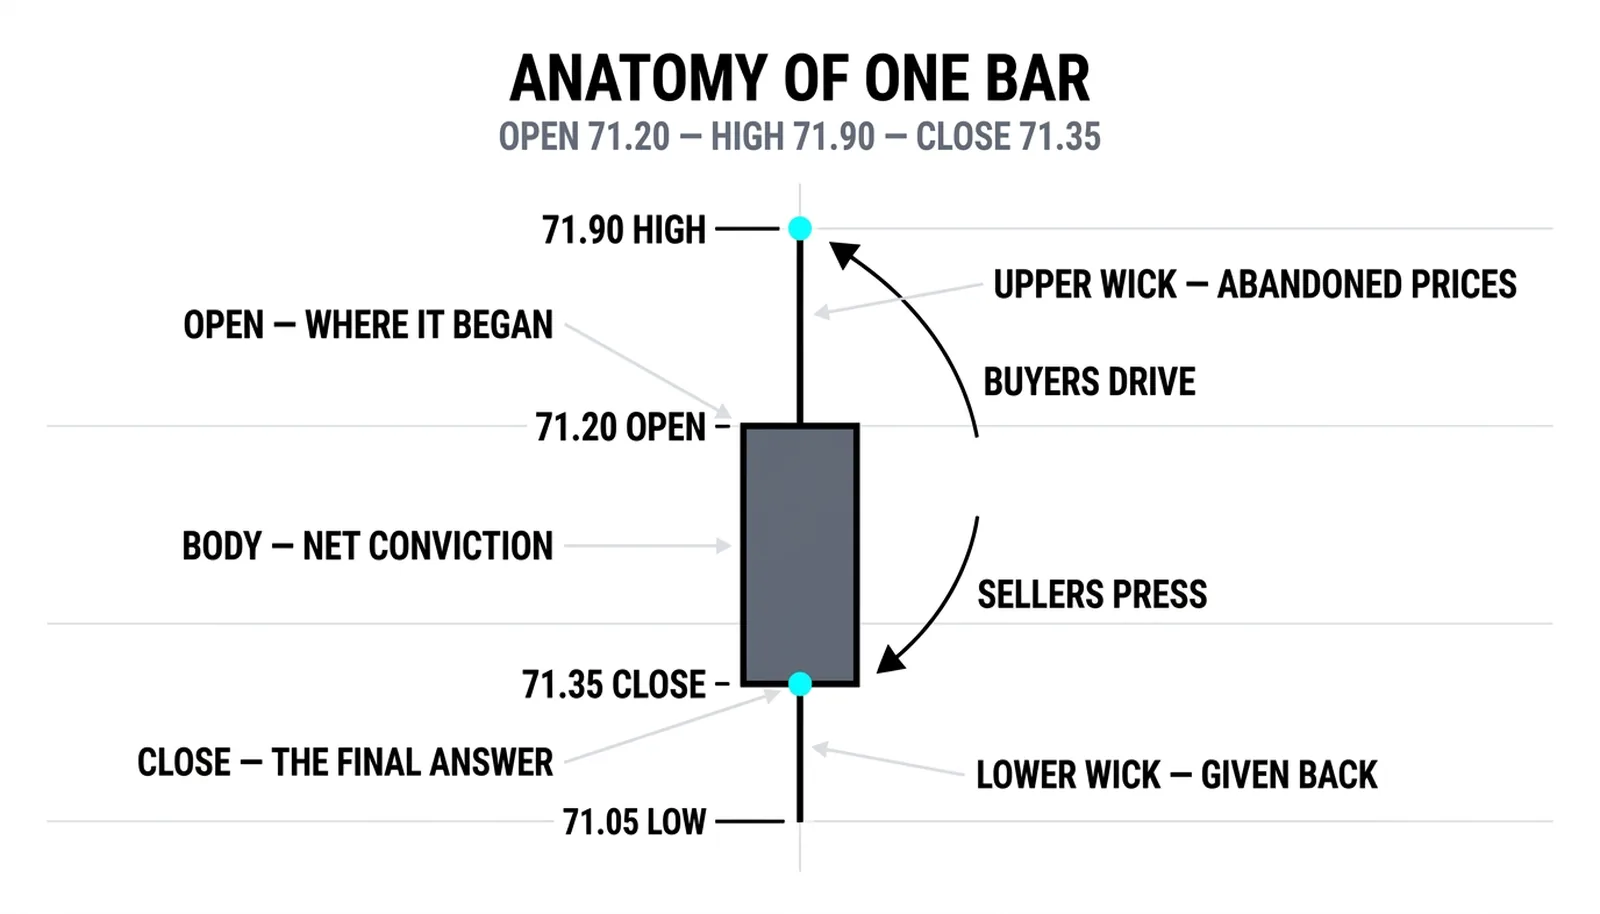
The open is where the period began with both sides present. It is the starting position, nothing more. On its own it says little, but compared against the close it becomes half the story.
The close is where the period ended. It is the only price the crowd could settle on when time ran out, and it is the single most honest number on the chart because it is the final answer. Intraday prices are opinions. The close is the decision.
The body is the net conviction of the period. A big body means one side dominated from open to close and held the gain. A small body means neither side moved the other, whatever happened in between. The price action canon builds an entire bar-by-bar method on this single idea: the size and direction of the body measures how badly one side wanted it.
The upper wick is prices buyers paid for and then abandoned. Someone bought the top of that wick. That person is now underwater, and the bar has recorded the exact price where buying turned out to be wrong.
The lower wick is prices sellers gave away and then wanted back. Someone sold the bottom of that wick. That person is now trapped, watching the price recover without them.
The confessions compound across bars. A long upper wick followed by a weak open means yesterday's trapped buyers become today's forced sellers. This is why the same shape means opposite things after different bars, and why memorizing candle names without reading the sequence is close to useless, the trap the pattern-naming habit sets.
The Trapped Trader
Wicks leave people underwater, and underwater people behave predictably. That predictability is the fuel for the next bars.
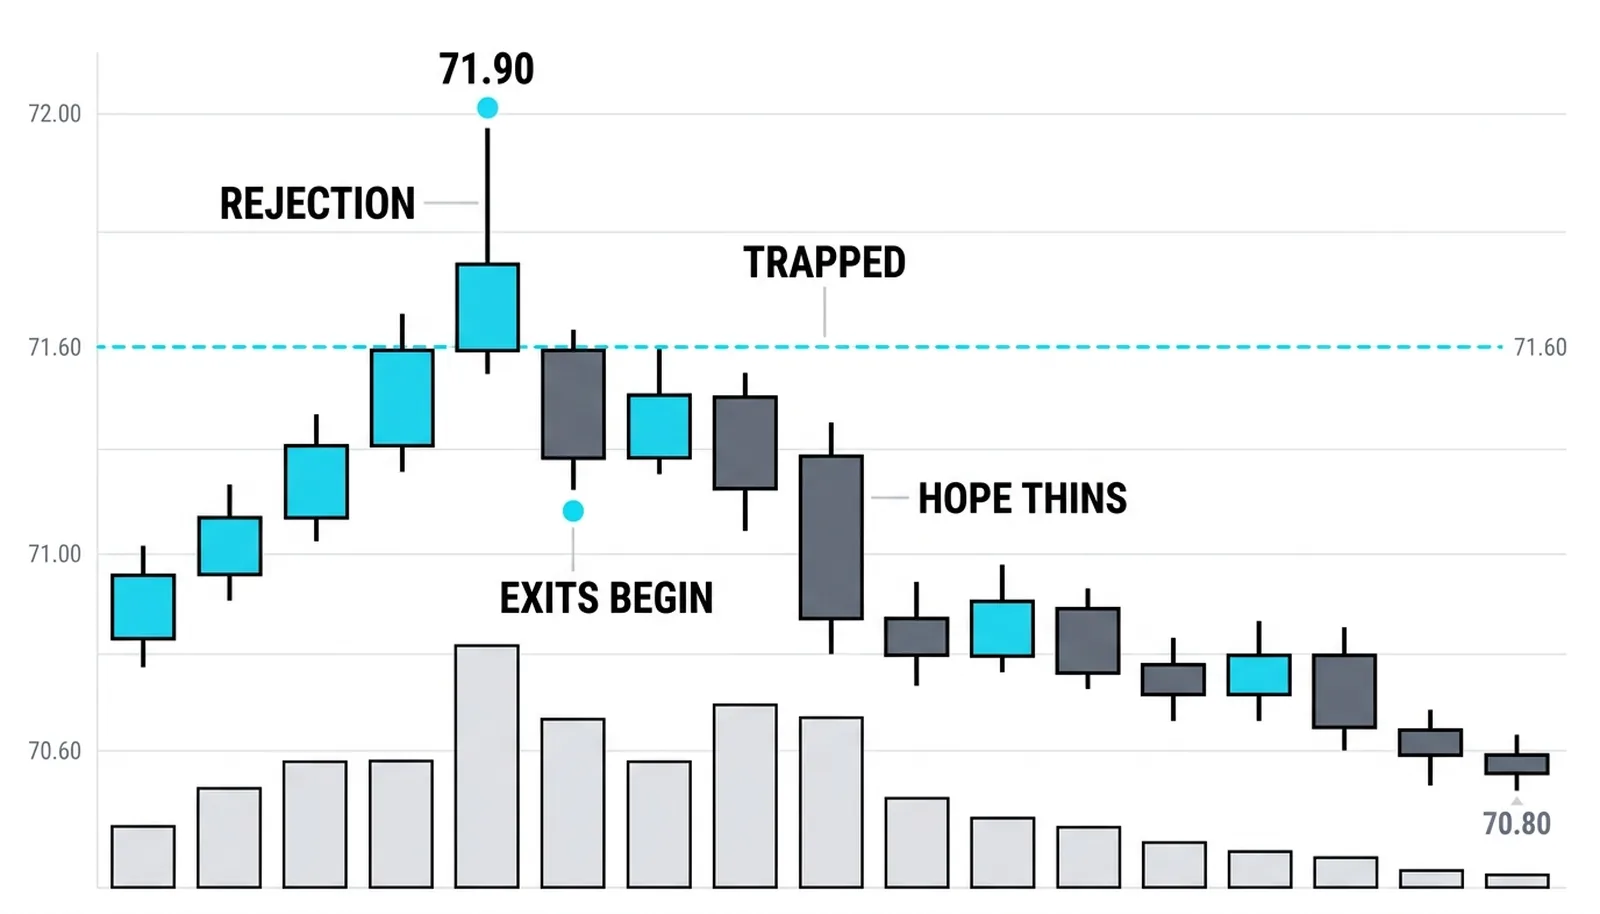
Picture the top of an upper wick. Buyers paid that price. Minutes later the price sits well below it. Every one of those buyers faces the same choice: exit now at a loss, or hold and hope. As the next bars open weak, hope thins out. Exits cluster. Those exits are sell orders, and they hit the market exactly where the chart told you they would.
The same logic runs in reverse at the bottom of a lower wick. Sellers dumped at the low, the price snapped back, and now those sellers are trapped short. Their buy-backs become demand under the market. Kam Dhadwar teaches this as the core of auction thinking: the market moves to where business was done badly, because that is where the regret lives.
A wick is a receipt of someone else's mistake.
This is also why wick size matters relative to the body. A small wick on a large body is noise, a minor skirmish at the edge. A wick longer than the body is a failed campaign. One side committed real effort, reached real prices, and lost all of it. The longer the wick, the more traders sit on the wrong side, and the more fuel exists for the move away from it.
Same Shape, Different Story
The preceding bars decide what a candle means. A shape in isolation is a word without a sentence.
Take the long upper wick. After a steep five-day rally, it often marks exhaustion: buyers chased, reached, and got rejected at the top of a mature move. After a long decline, the identical bar can mark the first sign of life, buyers testing higher ground for the first time in weeks. Same shape. Opposite stories. The difference is what came before.
Location sharpens this further, and an earlier lesson covered it: a pattern at a well-watched level carries weight, the same pattern in the middle of nowhere carries none. This lesson adds the second filter, the bar sequence itself. Ask what the last three to five bars built. Rising bodies with shrinking wicks tell you buyers were in control, so a sudden long upper wick is a genuine change of behavior. Choppy overlapping bars tell you nobody was in control, so the same wick is just another shrug.
Two questions before acting on any candle:
- What did the bars before this one establish about who was winning?
- Does this bar confirm that story or break it?
A bar that breaks the established story deserves attention. A bar that repeats it usually deserves patience.
The Bar at 71.90
A hypothetical stock opens at 71.20. In the first hour it rallies hard to 71.90. Then it fades for the rest of the session and closes at 71.35. The bar prints with a long upper wick and a small body.
Read the confessions. Buyers paid up to 71.90 and were abandoned there. Everyone who bought above 71.60 is underwater by the close. The body is small, so neither side won the day, but the wick tells you the buyers tried something and failed. Their exits are the supply the next sessions must absorb.
The next bar opens at 71.30 and closes at 71.10. The trapped buyers are exiting, exactly as the read suggested. Their selling presses the price down, the read hardens, and the wick high at 71.90 now stands as the level any recovery must reclaim.
Now the contrast case, same first bar. The next session opens at 71.50 and closes at 71.85 on heavy trade. The rejection was absorbed. Buyers stepped in, took the supply the trapped traders were dumping, and pushed through it. The buyers above 71.60 are vindicated, and the wick that looked like a ceiling becomes evidence of demand instead.
Same shape, opposite outcome. The candle proposed a story. The next bar ruled on it. Your job is to wait for the answer, or at least to size your risk knowing the question is still open.
Reading the parts as a checklist
| Candle part | What it confesses | The trap to avoid |
|---|---|---|
| Open | Where both sides started the period | Treating it as meaningful on its own |
| Close | The final answer, the only price the crowd settled on | Trusting intraday prices over the close |
| Body | Net conviction, who dominated and by how much | Reading a small body as a signal instead of a stalemate |
| Wicks | Prices one side paid for and lost, with traders trapped there | Ignoring who the wick leaves underwater |
Questions About Candle Psychology
What does the wick of a candlestick mean?
A wick marks prices that were reached and rejected during the period. An upper wick means buyers pushed up and were forced back down, leaving anyone who bought near the top underwater. A lower wick means sellers pushed down and were forced back up, leaving anyone who sold near the bottom trapped. The wick is the record of a failed attempt, and failed attempts create predictable behavior in the bars that follow.
Which is more important, the body or the wick?
Neither wins in general; the relationship between them is what matters. A large body with small wicks shows clean conviction, one side in control from start to finish. A small body with long wicks shows a fight with no winner, and the longer wick points to the side that failed hardest. Read the body for who won and the wicks for who got hurt, then combine the two.
What does a long upper wick mean?
It means buyers paid higher prices and were abandoned there, so a group of traders now sits underwater above the close. After a mature rally, that often signals exhaustion and supplies sellers for the next sessions. After a decline or at a known level, it can mean buyers are testing higher ground for the first time. The preceding bars and the next bar's reaction decide which story is true.
Can candle psychology be wrong?
Yes, and often. A wick shows rejection during one period, but the next period can absorb that rejection entirely, as the contrast case at 71.50 to 71.85 showed. Candle psychology is a hypothesis about who is trapped and what they will do, not a guarantee. The traders who last treat every read as provisional, define the price that would prove them wrong, and let the next bars decide.
With the fight inside the bar now readable, the level turns to named patterns, starting with the pin bar: a single long wick with a story, read with the same three questions you just learned.