The Clean Chart Approach
The clean chart approach means reading from a chart that carries only the market's own record plus your own marks: price bars, horizontal levels drawn from actual highs and lows, trendlines only where they genuinely apply, and nothing computed from price stacked on top. The discipline behind it is mise en place, everything in its place before the work starts, and nothing extra on the counter.

A chef's mise en place holds exactly the tools the dish needs, because every extra object within reach is one that ends up in the dish by accident. Charts work the same way. Every overlay sitting on the screen is an opinion waiting to leak into a decision, whether the trader invites it or not.
An earlier lesson compared price action with indicators as methods. That argument is settled there. This lesson is the practical side: the actual setup, what stays, what comes off, and the one exception most working traders eventually allow. The tape-reading framework builds an entire reading method on nearly bare charts, and the method holds up precisely because nothing on the screen competes with the bars themselves.
What Stays on the Chart
Start with the bars. Candles or OHLC bars are the only first-hand record the market produces: where price opened, where it closed, how far it traveled, and where it was refused. Everything else on any chart is downstream of those four numbers. The bars stay, always, because they are the evidence.
Next, the levels the trader drew by hand. A horizontal line at a prior high or low is not a computation. It is a marker placed at a price where the market actually did something: buyers stopped paying, sellers stepped in, a move stalled. Those levels carry information because they record behavior, and they cost nothing in screen clutter. A chart with bars and three or four hand-drawn levels is still a clean chart.
Trendlines come with a stricter test. A trendline earns its place only when at least three real touches justify it. Two points make a line anywhere; any two random highs will connect. The third touch is what separates a line the market respects from a line the trader imagined. If a trendline fails that test, it comes off. A line drawn on two points is decoration, not evidence.
What the clean chart refuses, above all, is the automatic. Auto-drawn levels, auto-pattern markers, pivot lines generated by formula: none of these record what the trader actually saw. They record what a script saw. The moment the screen fills with lines nobody chose, the trader stops reading and starts inheriting.
What Comes Off and Why
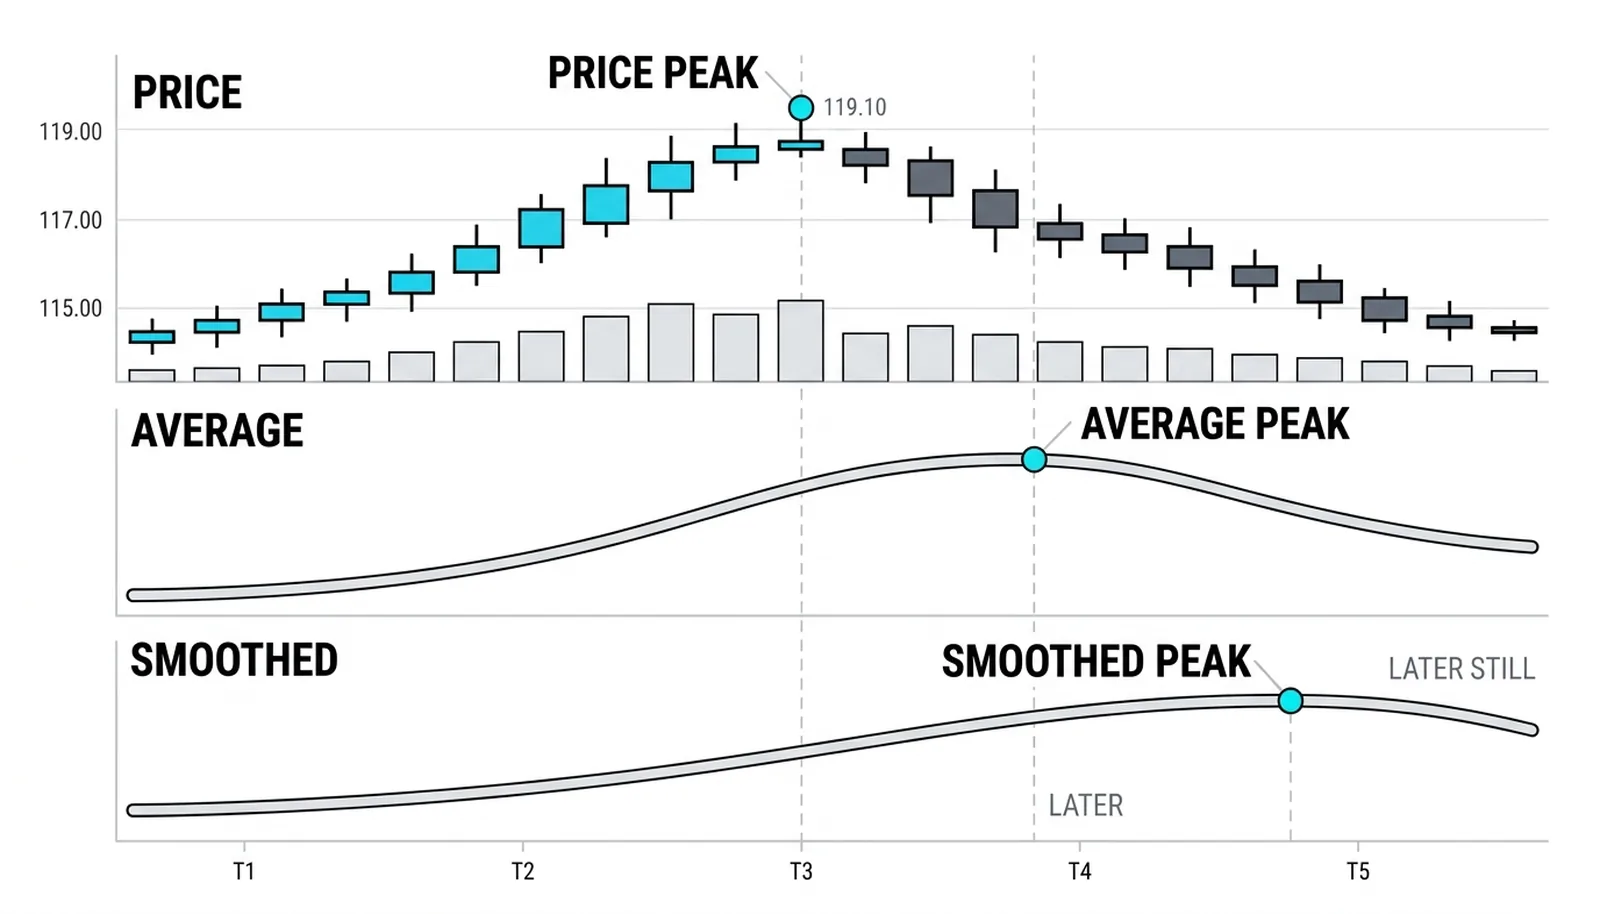
Every derived overlay is a summary of price. A moving average summarizes closes. An oscillator summarizes the relationship between recent closes. A band summarizes a summary. Stacking three of them means reading a summary of a summary of a summary, each layer one step further from the evidence and each one an opinion about the opinion underneath.
The problem is not that these tools lie. The problem is distance. A trader watching the oscillator is watching a processed version of what the bars already showed, delayed and smoothed. Two indicators that disagree create a third problem: now the trader is arbitrating between summaries instead of reading the market. Screen time spent adjudicating between derivatives is screen time not spent on the auction itself.
There is also a subtler cost. Indicators on the chart become anchors. The trader sees the oscillator turn down and starts hunting for reasons the bars agree. Confirmation bias stops being a tendency and becomes a workflow. Removing the overlays removes the anchors, and the bars get an honest reading for the first time.
So off the chart come the moving average ribbons, the oscillator panels, the auto-levels, the bands, the arrows, the signals. Not because they are worthless, but because they are secondhand, and the read has to come from firsthand material. Secondhand has uses. The read is not one of them.
The One-Filter Exception
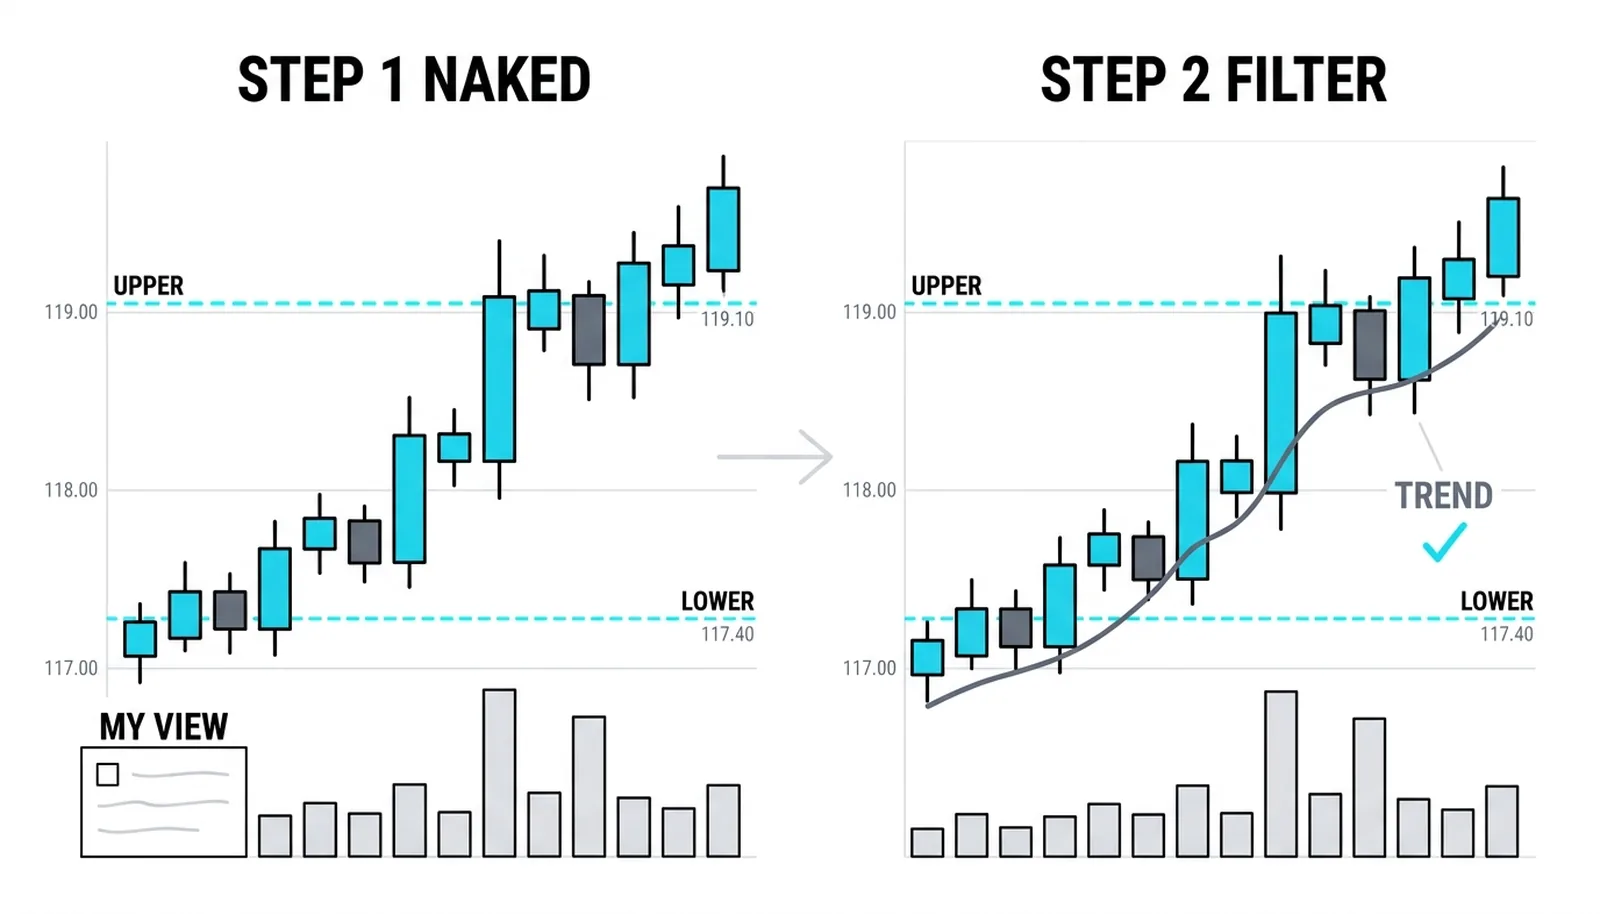
The honest middle, stated plainly: indicators are not evil, they are secondhand, and secondhand information has legitimate jobs, which is why the indicator-picker lesson exists at all. Many clean-chart traders land on a working rule that keeps the discipline without demanding purity. Strip everything for the read. Then, afterward, permit one filter back on if it earns its keep.
The rule has a strict clause: the read itself happened naked. The trader forms the view from bars and levels first, writes it down or says it aloud, and only then consults the filter. If the filter agrees, fine. If it disagrees, that is information too. What never happens is the filter participating in forming the view. One filter, one job, after the read.
The exception carries its own discipline. If a tool sits on the chart every day, it drifts into every decision. That is not a character flaw; it is how attention works. So a filter that comes back must come back deliberately, for a stated job: measuring whether a trend is stretched, timing an entry within an already-formed view, nothing vague. A filter without a stated job is furniture, and furniture multiplies.
A practical test helps. Before re-adding anything, the trader answers one question in writing: what decision does this tool change, and when did it last change one? If the answer is fuzzy, the tool stays off. Most tools fail this test, which is exactly the point of asking it.
Decluttering at 118.60
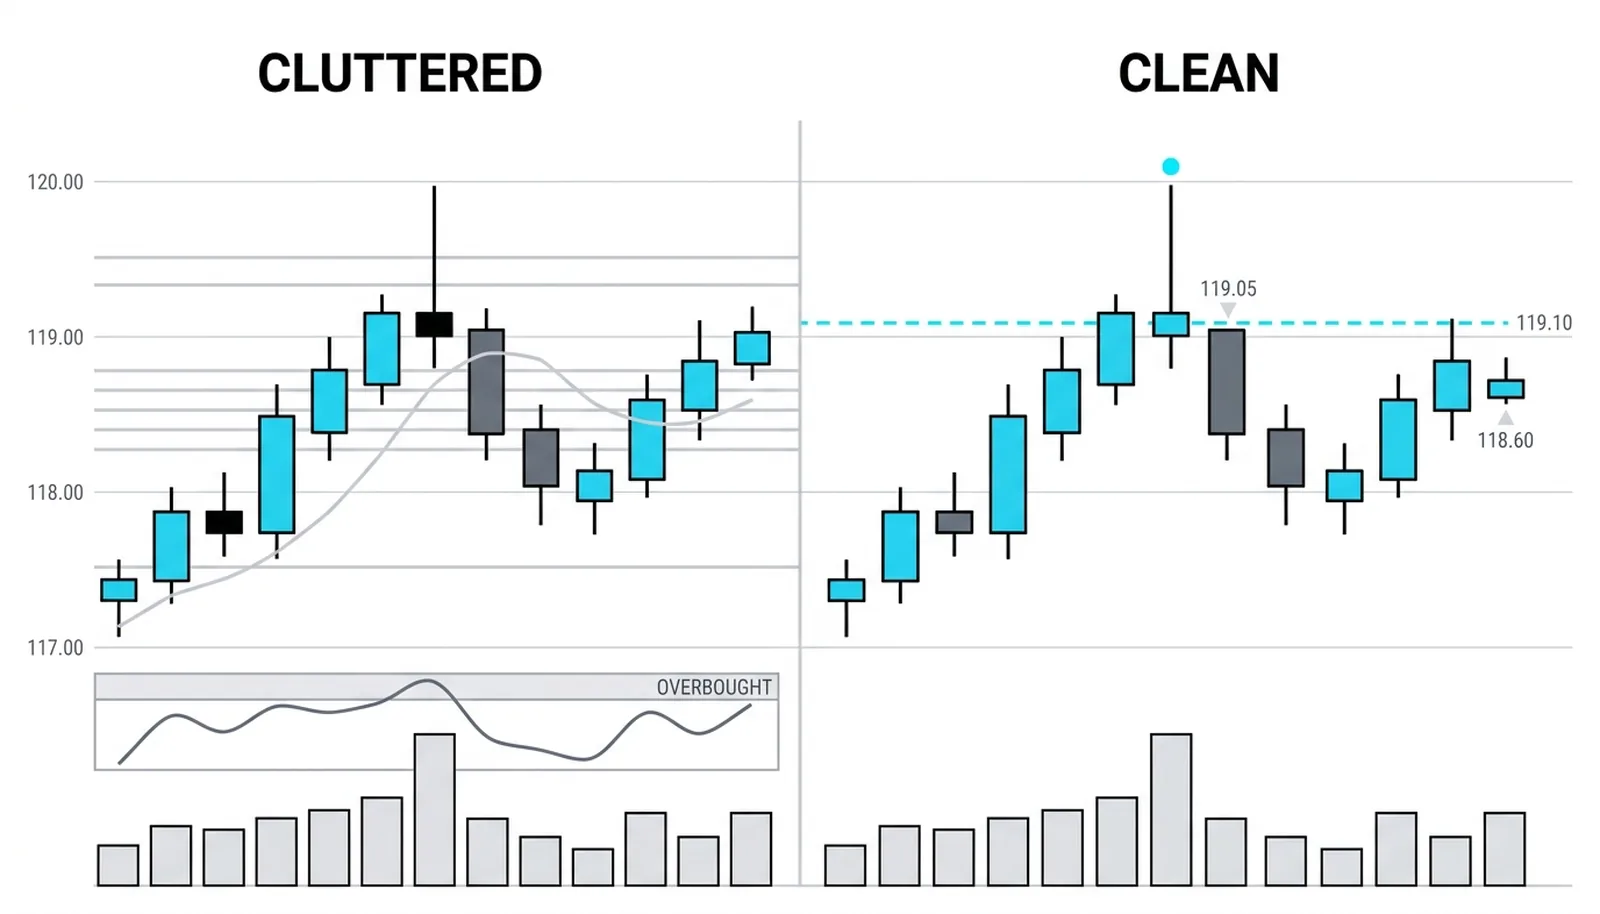
Consider a hypothetical chart. Price sits at 118.60, just under a marked prior high at 119.10. The screen carries a moving average pair, a momentum oscillator, a volume oscillator, and four auto-generated levels. Six extra lines crowd the area between 118.00 and 120.00.
With everything on, the picture is noise. The momentum oscillator reads overbought, which hints at selling. The moving average pair shows the trend is up, which hints at buying. The auto-levels slice the chart into bands nobody chose. Three tools, three nudges, no read.
Strip it to bars and one hand-drawn level at 119.10, and the chart asks a single question: does price accept above 119.10 or get rejected there? The previous week already answered once. Price reached 119.05 and closed back down on a hard-tailed bar, a clean rejection with a long upper wick. That bar is firsthand evidence of sellers at that shelf.
Now the plan is mechanical. Acceptance above 119.10, meaning a close through it that holds, says the sellers at that shelf are absorbed. Another rejection tail says they are still there. The trader watches one price and one behavior. No oscillator can add to that, because the oscillator is only a delayed retelling of the same bars.
| Chart item | Keep or remove | The reason | The replacement habit |
|---|---|---|---|
| Moving average pair | Remove | A smoothed summary of closes the bars already show | Read swing highs and lows for trend direction |
| Momentum oscillator | Remove from the read | Secondhand opinion that anchors bias before the read | Judge momentum from bar size and close location |
| Auto-generated levels | Remove | Lines a script chose, not prices the trader verified | Draw levels by hand from actual highs and lows |
| Hand-drawn level at 119.10 | Keep | Marks a real prior high where sellers appeared | Watch for acceptance or rejection at that price |
The table makes the pattern visible. Everything removed was derived or automatic. Everything kept was either the raw record or a mark placed at a price where the market demonstrably acted. That is the complete filter.
The Clean Chart, Answered
What is a clean chart setup?
A clean chart setup is a chart carrying only the bars, hand-drawn horizontal levels from actual highs and lows, and trendlines with at least three genuine touches. Nothing computed from price sits on top. The setup exists so the read comes from firsthand evidence, with every mark on the screen one the trader chose and can defend.
Should I remove all my indicators?
For the read itself, yes, strip everything and form the view from bars and levels alone. Afterward, one filter may come back if it has a stated job and a track record of changing decisions. The discipline is sequencing: naked read first, filter second, never the reverse.
Can I keep one moving average?
Yes, under the one-filter exception, provided it earns its keep. The test is whether it changes specific decisions and whether the read was already formed before consulting it. A moving average kept as furniture, glanced at reflexively, will drift into every decision and quietly undo the clean chart.
Does clean chart trading work on any time frame?
Yes, because the method depends on bar behavior and level behavior, which exist on every time frame from one-minute to monthly. A rejection tail at a prior high means the same thing on a five-minute chart as on a weekly. What changes with time frame is the size of the moves and the speed of the decisions, not the reading skill.
The clean chart is the foundation for everything that follows in this level. The next lessons build the bar-by-bar reading skill on exactly this stripped screen, so the setup work done here pays off immediately: one chart, the market's own record, and a trader reading what actually happened.