Location Beats the Candlestick Pattern
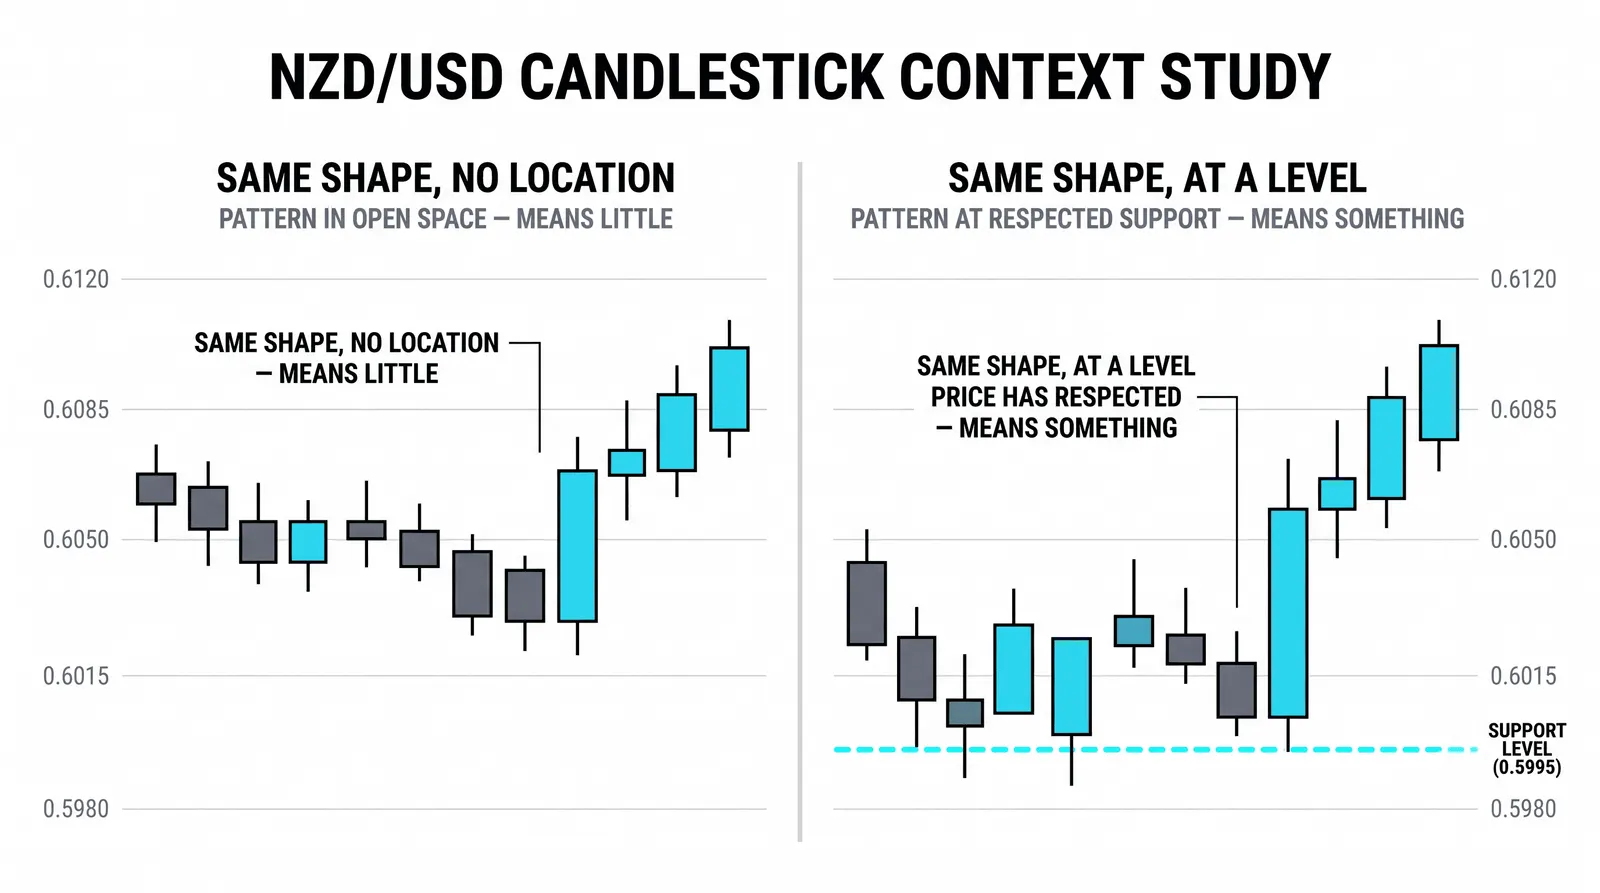
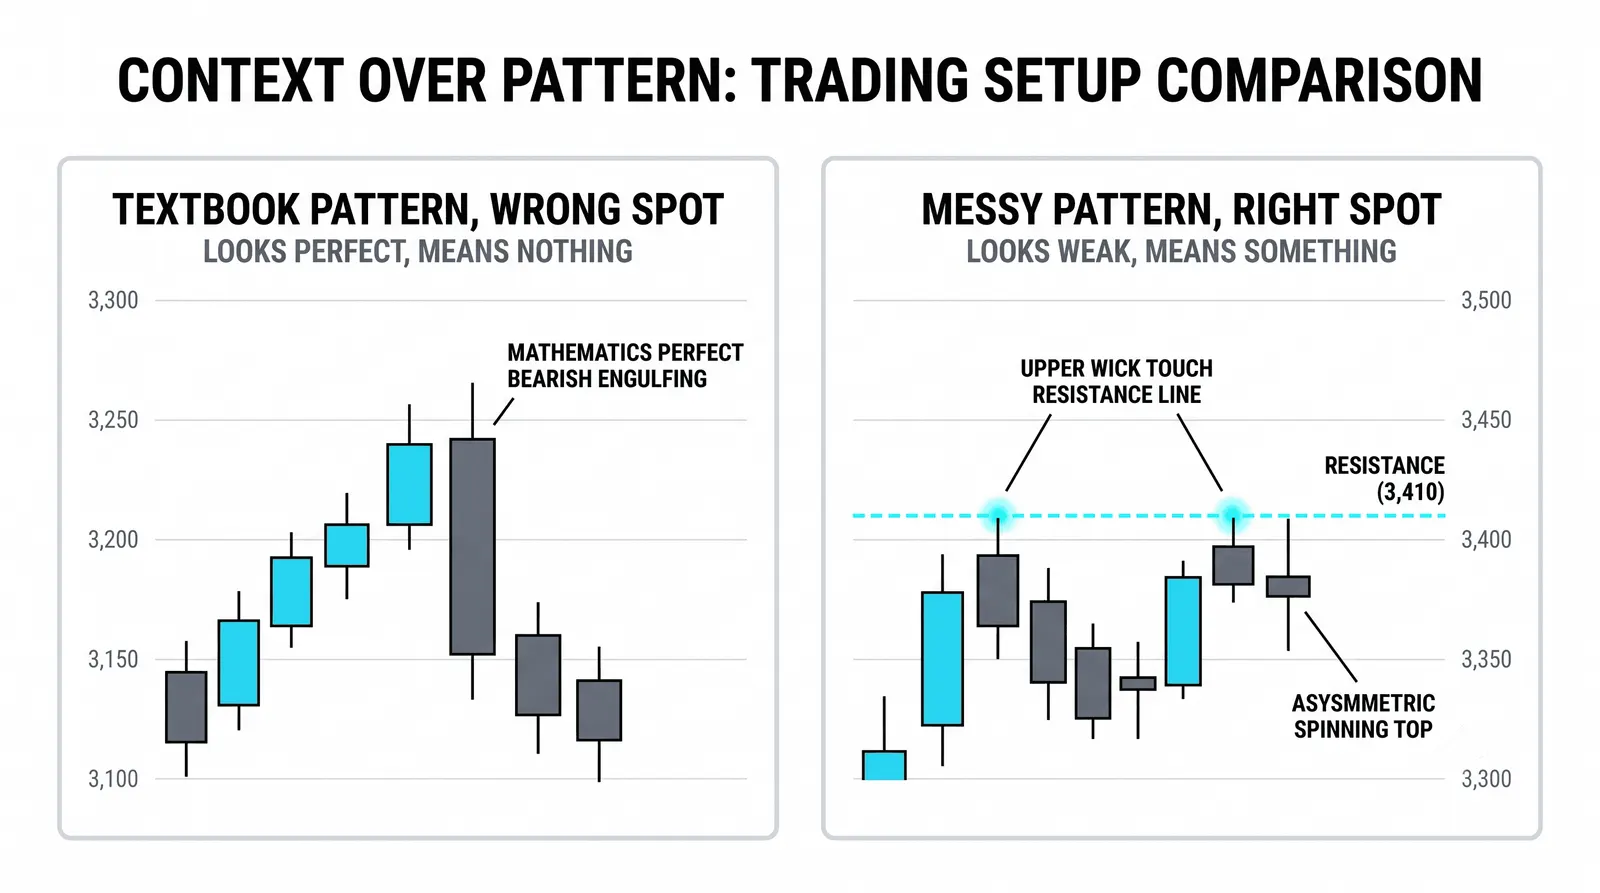
A candlestick pattern means very little until you know where it formed. The same shape at different places on a chart carries opposite meanings, and the pattern's value comes from where it forms. A textbook signal in the wrong spot is worth less than a plain candle at the right one.

Think of an umbrella: a great thing to own on a rainy day, a ridiculous thing to carry through a drought. The object did not change. The context did.
This lesson is about that context. Other lessons catalog the patterns themselves, and you already know the shapes. What most traders never learn is that the shape is the smallest part of the trade.
What Location Actually Means
Location is the position of a candle relative to structure. Three spots matter, and almost every candle you will ever see forms in one of them.
The first spot is a tested support or resistance level. Price has visited this zone before, reacted, and left evidence. A candle forming here is forming where decisions have already been made.
The second spot is a swing extreme after an extended move. Price has run hard in one direction, and the candle prints at the far edge of that run, where the move is most tired.
The third spot is mid-range. No level nearby, no extreme reached, just open chart between two zones traders actually care about. Most candles form here. Most candles mean little.
Now picture the same candle in all three spots. A bullish engulfing bar at a tested support shelf is a signal with a reason behind it. The same bar after a vertical run into resistance is a warning that late buyers are trapped. The same bar mid-range is a shape on a screen.
The candle did not change. The location rewrote its meaning entirely.
Why the Pattern Alone Underperforms
Here is the uncomfortable part. When researchers test classic candlestick patterns across large samples of markets and timeframes, hit rates hover near coin-flip territory. Some patterns do slightly better, some slightly worse, but none of them carry a reliable edge on shape alone.
This is not a secret. Honest teachers say it plainly. Bulkowski's encyclopedia of candlestick patterns, the most thorough public testing of these shapes, reports results that vary widely by market and setting, with many classic patterns performing barely better than a coin flip.
The edge comes from confluence. Pattern plus level plus trend. Each element alone is weak; stacked together, they describe a situation where one side of the market has a genuine reason to act.
Traders who skip this truth end up memorizing forty pattern names and losing money with all of them. The vocabulary was never the edge.
The Three Locations Test
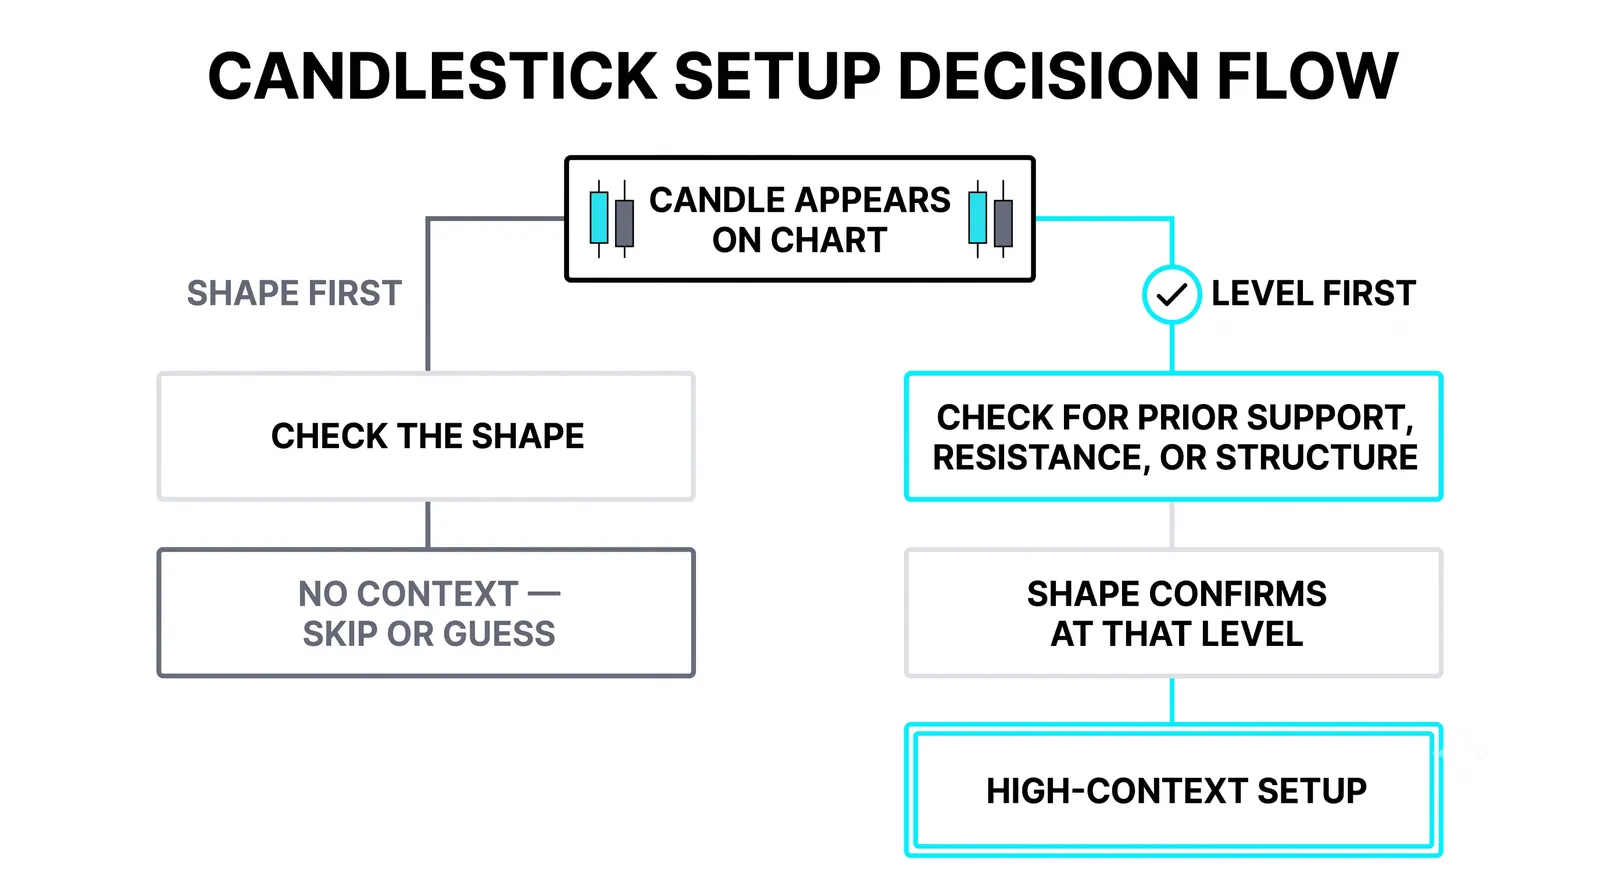
Before you act on any candle, run it through three questions. Where is it?
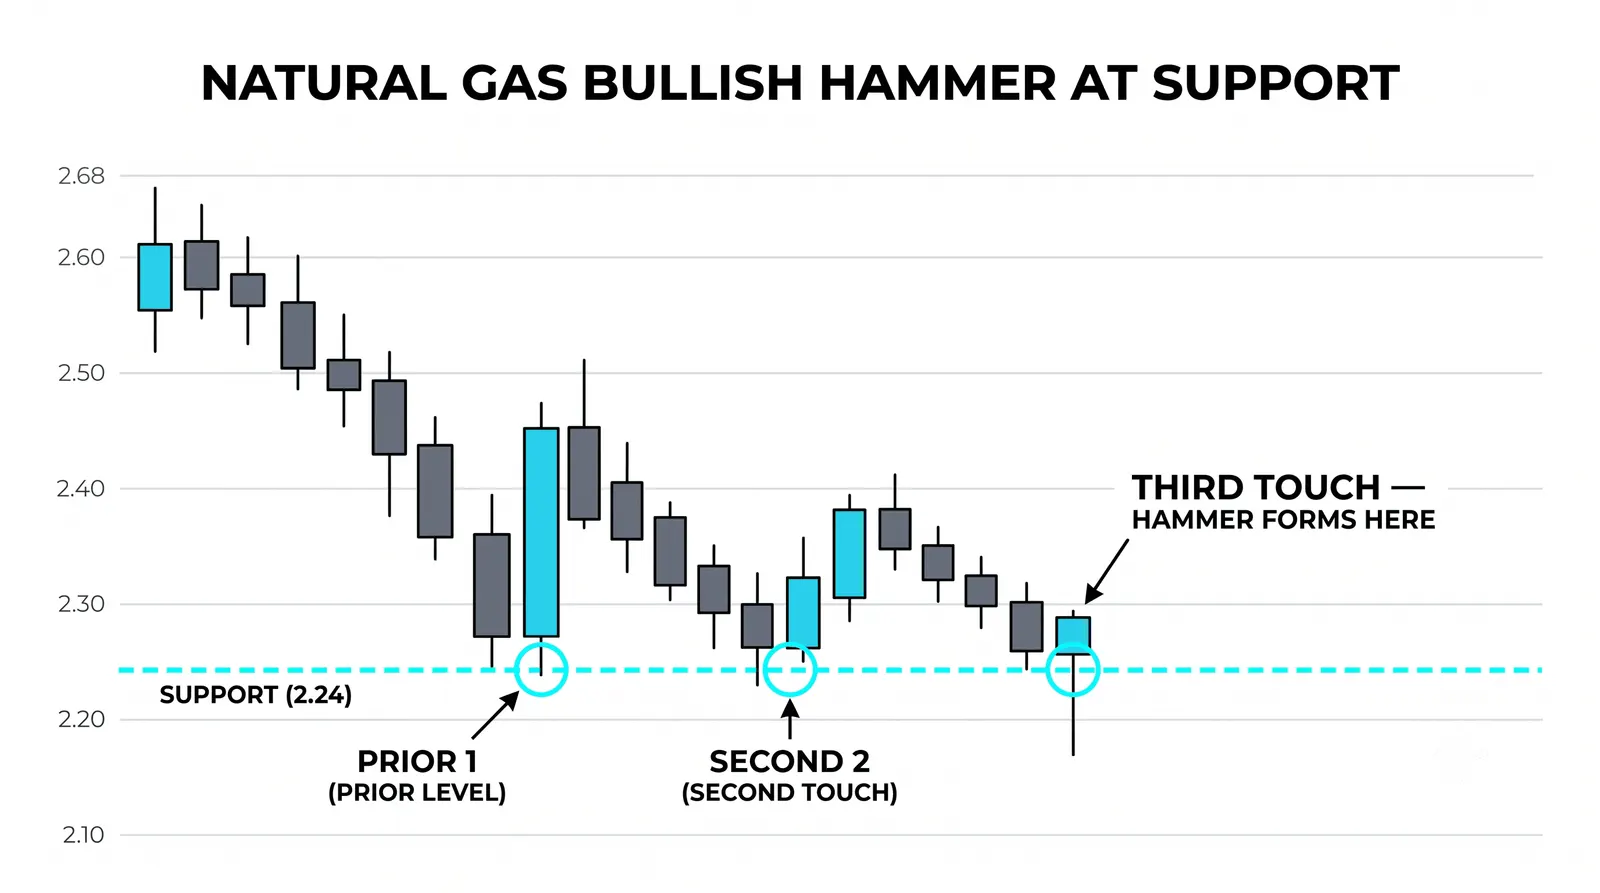
At a level. The pattern becomes a trigger on top of a reason. The level is the reason; the candle is the timing. A rejection wick at support tells you buyers defended a price they defended before. You are trading the level, and the candle tells you when.
After an extended move. The pattern becomes an exhaustion candidate. A strong-looking candle at the end of a long run often marks the last burst of the winning side, not the start of more. Treat these with suspicion until the next candles confirm direction.
Mid-range. The pattern is noise. There is no level to defend, no extreme to exhaust, no crowd committed to a price. Trading a mid-range pattern is a coin flip with costs, and the costs are real: spread, slippage, and your attention.
Most losing candlestick trades come from the third bucket. The trader saw a shape, not a location.
The Confirmation Habit
Even a well-located pattern is a proposal, not a verdict. Let the next candle vote.
Confirmation means waiting for the following candle to agree with the signal. A bullish engulfing at support, followed by a candle that closes higher, is a different trade from the engulfing bar alone. The second close shows that buyers actually followed through rather than vanishing.
Yes, confirmation costs you a few ticks of entry price. That cost is tuition against the far larger cost of acting on every shape that appears. A pattern plus a confirming close filters out a large share of the failures, and it forces patience on traders who need it most.
Impatience is expensive in this business.
One Pattern, Three Places
Here is a hypothetical walkthrough with round numbers. Same candle, three charts, three outcomes.
Scenario one: mid-range chop. Price has been drifting sideways between 50 and 53 for two weeks. A bullish engulfing candle prints at 51.20, right in the middle of nowhere. You buy. Price wobbles for three sessions, dips, rises, and goes nowhere. You exit flat or slightly down after fees. The candle had no level behind it and no extreme to reverse from. It was noise pretending to be a signal.
Scenario two: at a rising support shelf. Price has been trending up and pulls back to a shelf near 51 that has held twice before. The same bullish engulfing prints at 51.20, right on the level. Now it is a trigger on top of a reason. You enter at 51.60 after the next candle confirms, place a stop at 50.40 just under the shelf, and target the prior high near 53. Risk is 1.20, potential reward is about 1.40, and the trade has structure on its side. This is the same candle doing a completely different job.
Scenario three: after a vertical run. Price has climbed from 40 to 52 in a straight line, about 30 percent, and is pressing up under an old top near 53. The same bullish engulfing prints at 51.20 on that final push, on the wrong side of an extended move. The candle fails within two sessions and price rolls over hard. The "bullish" signal was the last gasp of exhausted buyers at the worst possible address.
Three trades, one pattern, three results. The pattern never changed. The location did everything.
Candlestick Context, Answered
Can a strong pattern work in the middle of a range?
Occasionally, yes, and that is the trap. Mid-range patterns work often enough to keep you interested and fail often enough to cost you money over time. Without a level or an extreme behind it, the outcome is close to random, and random minus trading costs is a losing formula.
How much does the higher timeframe change a pattern's meaning?
A great deal. A bullish candle on the 15-minute chart that forms directly under daily resistance is a weak long and a decent short candidate. Always check what your pattern's location looks like one or two timeframes up before treating it as a signal.
Should I ignore patterns entirely and trade levels only?
No. Levels tell you where; patterns tell you when. A level without a trigger leaves you guessing at entries, and a pattern without a level leaves you trading noise. Use the level as the reason and the candle as the timing mechanism.
What is the fastest way to judge location?
Zoom out and mark the nearest support and resistance before you look at any candle. Then ask one question: is this pattern at a level, at an extreme, or in between? If the answer is "in between," close the chart and wait.
Carry this into your next chart session: before you name a single pattern, name its location first. That one habit will filter out more bad trades than any new pattern you could memorize, and the next lessons on multi-timeframe structure will show you how to stack even more context on top of it.