What Is a Candlestick Pattern
A candlestick pattern is a recognizable arrangement of one or a few candles that tends to appear in similar situations on a chart. That is all it is. It describes a recurring fight between buyers and sellers, and it tells you who pushed, who pushed back, and where the fight ended. It is not a magic signal, and it does not predict the future on its own.

Think of each candle as a sentence, and patterns as short paragraphs: the meaning comes from the sentences together, not from any single word. Once you read charts that way, you stop memorizing names and start understanding behavior. The four numbers themselves are covered in reading a basic price chart.
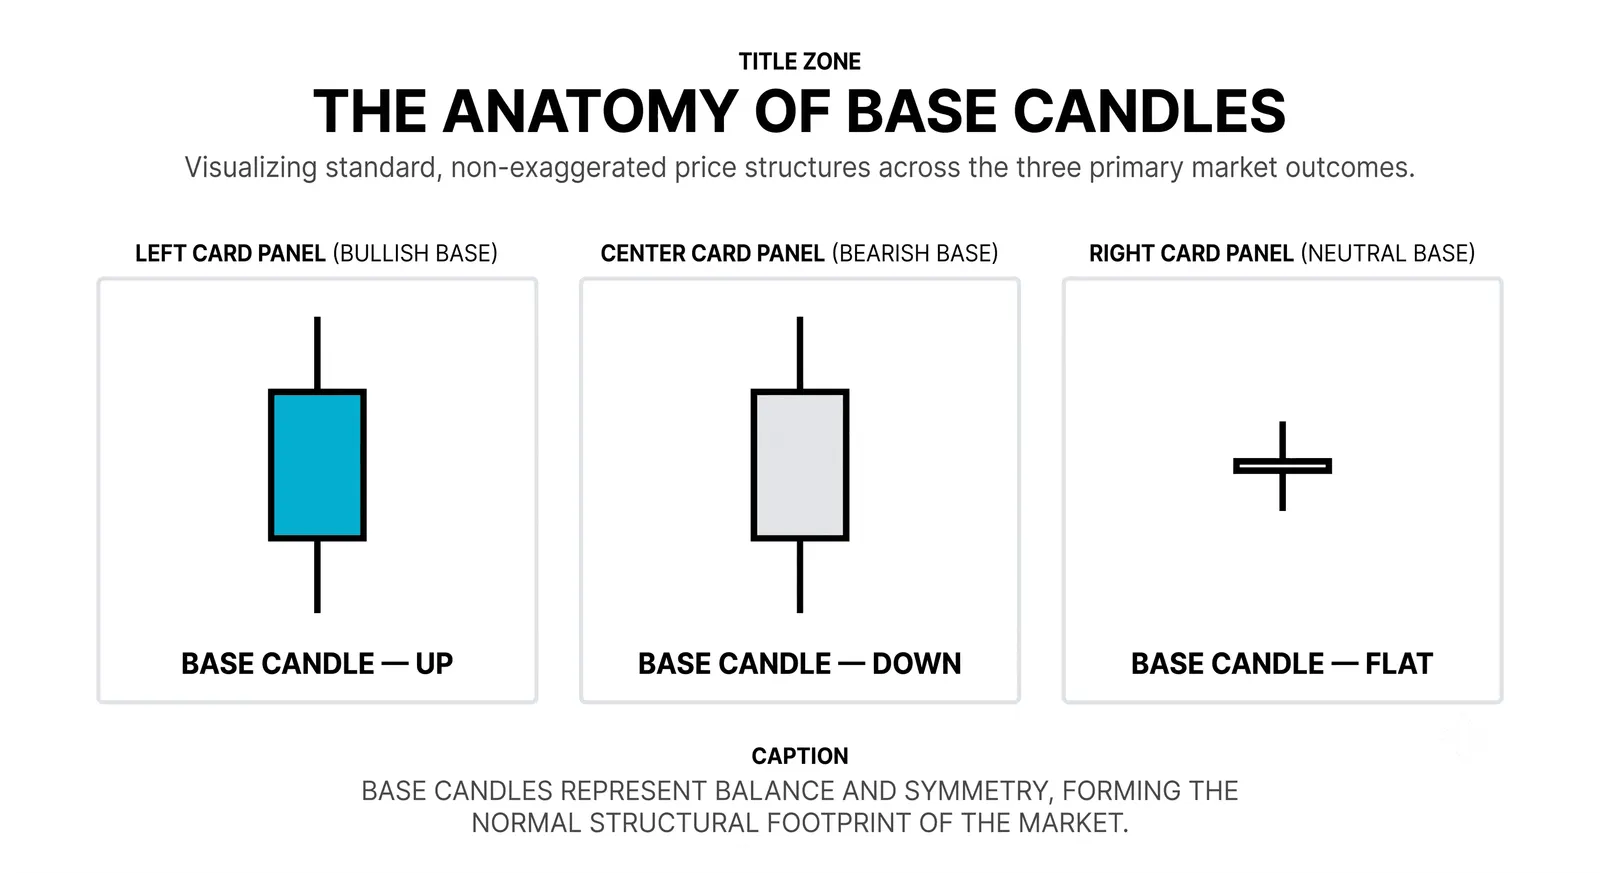
The Base Unit: One Candle, Four Numbers
You already know this, so consider it a quick calibration. Every candle carries four numbers: open, high, low, close. The body shows the distance between open and close. The wicks show how far price traveled beyond that before settling.
Those four numbers answer one question: who won this period, and by how much? A long green body says buyers controlled the session start to finish. A small body with long wicks says both sides pushed hard and neither held the ground. A long lower wick says sellers drove price down and buyers took it back.
Everything else in this lesson is just those four numbers, read across one candle or a few.
One Candle vs. Several Candles
A single-candle pattern tells you the fight within one period was one-sided or was rejected. A long lower wick means sellers tried something and failed. A long upper wick means buyers tried something and failed. The candle is a record of a rejection.
Multi-candle patterns show a fight changing outcome mid-story. Two or three candles can show sellers in control, then hesitation, then buyers taking over. That shift is the information. You are watching momentum change hands in slow motion.
Neither type is better. Single candles are faster but easier to fake. Multi-candle patterns take longer to form but show you more of the fight. New traders often chase exotic five-candle formations. Skip that. A two-candle shift at the right location beats a rare pattern in the middle of nowhere.
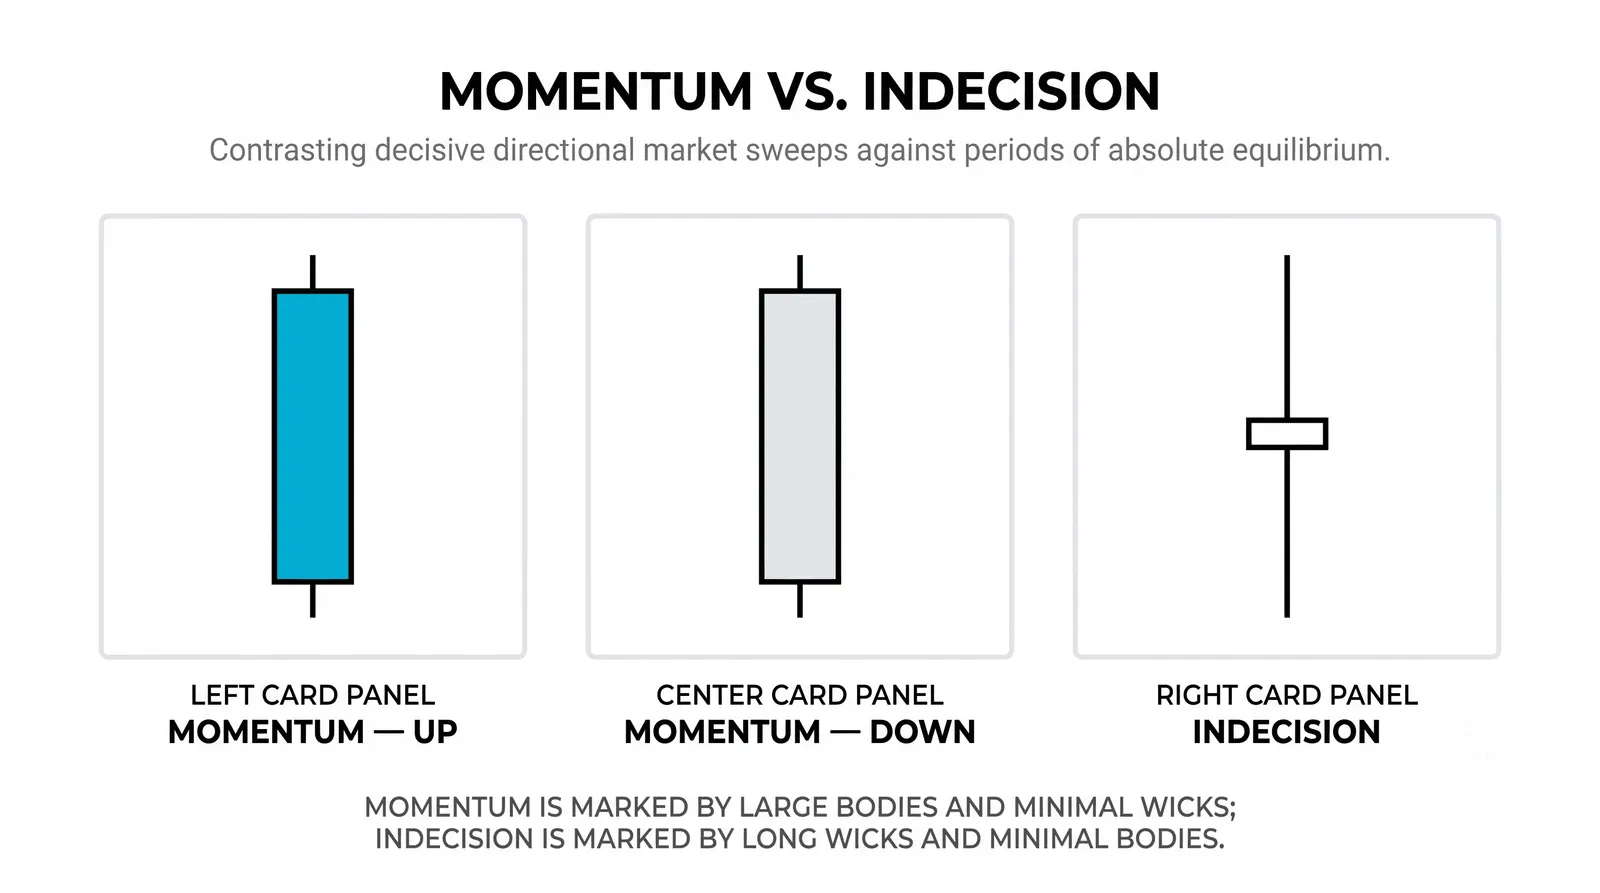
A Worked Example With Round Numbers
Here is a hypothetical. A stock falls from 110 to 100 over two weeks. The area around 100 has held as support twice before, so buyers have a reason to be interested there.
The next day, the stock opens at 99, sinks to 97 in the morning, then rallies and closes at 104. That candle has a small body near the top and a long lower wick. Traders call this shape a hammer. Read it as a sentence: sellers pushed price below support, and buyers rejected the move and took price back above it.
The following day, the stock closes at 107, above the hammer's close. Now the paragraph confirms the sentence. The rejection was real, and buyers followed through. That follow-through candle is what separates a readable story from a random shape.
Notice what made this work. The same hammer-shaped candle at 115, in the middle of a range with no support nearby, would mean almost nothing. The candle was identical. The location was not. The full context argument lives in why location matters more than the pattern.
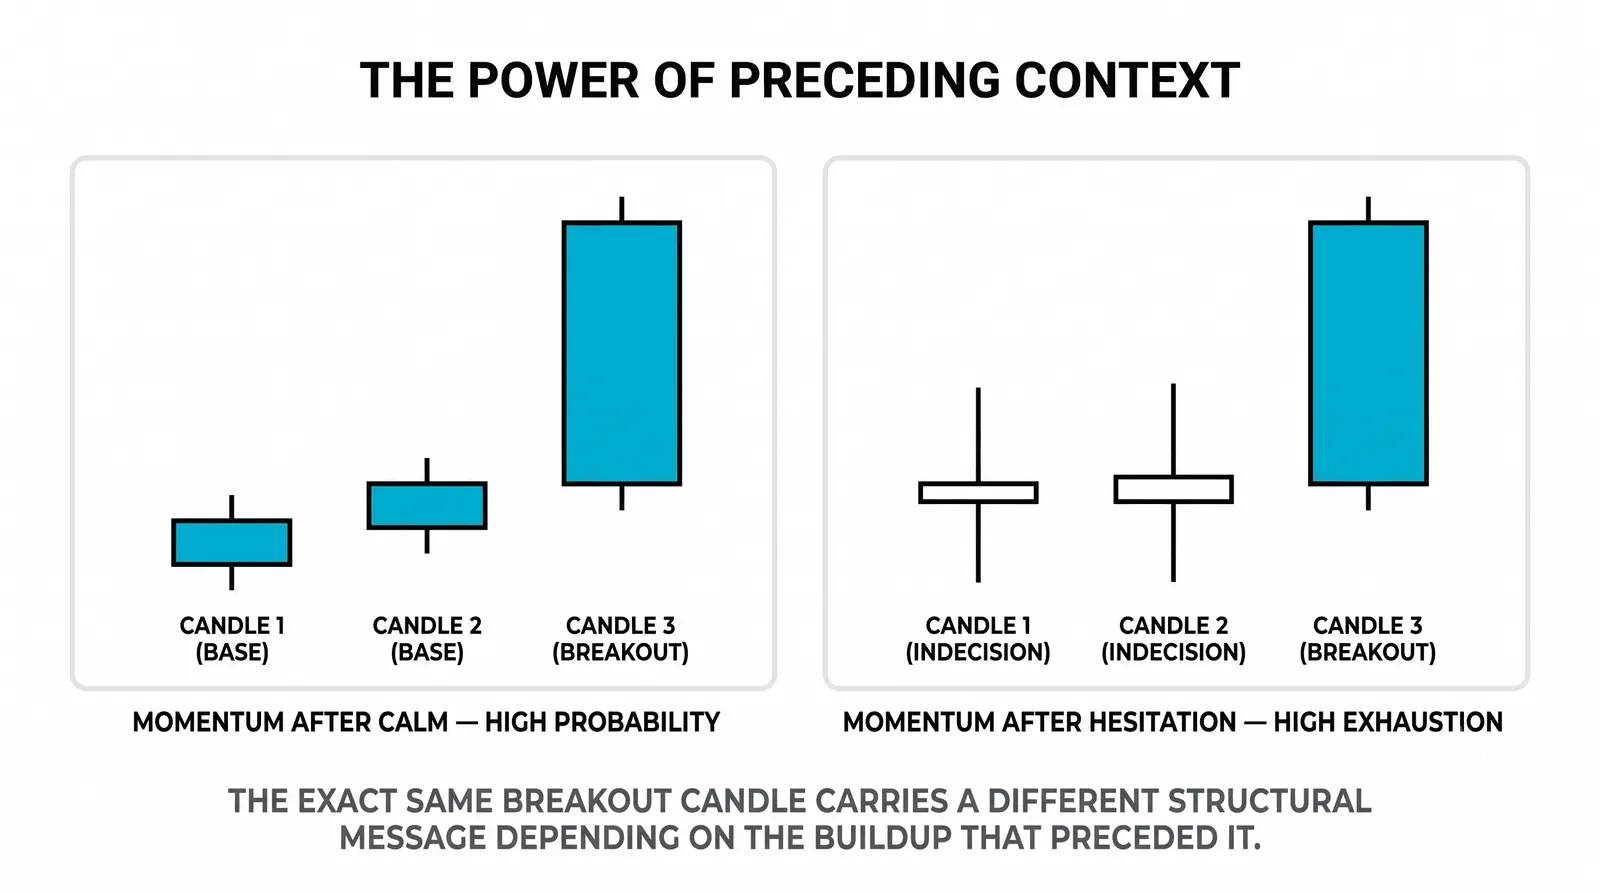
Location Is What Gives a Pattern Meaning
A pattern only means something in context. Three things supply that context: support and resistance, the stage of the trend, and what price did just before the pattern formed.
A rejection candle at a well-tested support level is evidence. The same candle in the middle of a range is noise. A bullish pattern after a long decline, at a level where buyers have stepped in before, carries weight. The same pattern after a long rally, far above any support, is often just exhaustion dressed up as a signal.
Most losing pattern trades fail on location, not on the pattern itself. Traders memorize shapes and ignore where the shape appears. That is backwards. Find the location first, then see if a pattern shows up there. If no pattern forms at your level, there is no trade. That is fine.
Strong Situation vs. Weak Situation
The table below compares the same bullish rejection pattern in two different contexts. The candle is identical. Only the situation changes.
| Factor | Strong Situation | Weak Situation |
|---|---|---|
| Location | At a tested support level | Middle of a range, no level nearby |
| Trend context | After a clear decline into support | Sideways chop with no direction |
| Wick size | Long wick, clear rejection of lower prices | Small wick, weak rejection |
| Follow-through | Next candle closes above the pattern | Next candle drifts or reverses |
| Your plan | Entry, stop below the wick, target defined | Hope, no stop, no target |
Read the right column carefully. Most beginners trade that column and wonder why patterns "don't work." The pattern was never the problem.
Reading Beats Naming
You will encounter dozens of pattern names: hammers, engulfing candles, dojis, morning stars, and so on. Do not memorize them as a checklist. Every one of them is a variation on the same few questions. Did one side push and get rejected? Did control shift from one side to the other? Did the fight end in a stalemate at an important level?
If you can answer those questions from the candles themselves, the names come free. You will recognize a hammer because you understand rejection, not because you flash-carded it. Traders who learn names first tend to force patterns onto charts that are not there. Traders who learn to read first see patterns only when they actually exist.
Blunt truth: a trader who reads three candles well will beat a trader who memorized forty patterns.
Questions About Candlestick Patterns
Do candlestick patterns predict price?
No. A pattern describes what just happened between buyers and sellers; it does not guarantee what happens next. At a good location with follow-through, a pattern tips the odds slightly in your favor. That edge is small and only pays off over many trades with controlled risk.
How many patterns should I memorize?
Almost none. Learn to read what a candle's body and wicks say about the fight, and the common patterns will be obvious without memorization. If you want a starting set, focus on rejection candles and two-candle shifts in control, then stop adding names.
Do patterns work on all timeframes?
Yes, the logic is the same on a five-minute chart and a daily chart, because both record the same fight between buyers and sellers. Lower timeframes produce more patterns and more noise, so location and follow-through matter even more there. Higher timeframes produce fewer, cleaner signals.
What turns a pattern into an actual trade?
Location plus a plan. The pattern must sit at a meaningful level, and you must know your entry, your stop (usually beyond the pattern's extreme), and your target before you enter. A pattern without a plan is just an observation, and observations do not manage risk for you.
Your next step is practice, not more theory. Open a chart, mark the obvious support and resistance levels, and wait. When a candle or a small group of candles tells a clear story at one of those levels, write down what you read and what price did afterward. That journal will teach you more than any pattern encyclopedia, and it prepares you for the next skill: combining candle reading with risk management so a good read becomes a controlled trade.